3.4 - Estimation of storage capacity
For the evaluation of CO2 storage it is important to understand the relations between volumes of fuels, energy content and how much pore space they occupy in the subsurface. The table below shows approximate values for how much natural gas, diesel and coal which will generate 1 Gt of CO2 with 100 % combustion, and how much energy is generated. The values for crude oil depend on the composition, but are quite similar to diesel.
When CO2 in dense phase is injected into a saline aquifer , the density is typically 600-700 kg/m3. With a density of 700, 1 Gt will require a subsurface volume of 1.4 x 10⁹ m3. With a storage efficiency of 4 %, this corresponds to an aquifer volume of 36 x 109 m3.
The subsurface volume occupied by the volume of natural gas in the table, assuming 100 % gas saturation, is approximately twice the subsurface volume of 1 Gt CO2. The subsurface volume of oil is approximately half of the CO2 volume. These sub-surface volumes are depth dependent.
This means that abandoned gas fields produced by pressure depletion can be This means that abandoned gas fields produced by pressure depletion can be good candidates for CO2 injection. These fields can accommodate more CO2 than was generated by combustion of the gas before the aquifer pressure comes back to the initial pressure prior to production.
Fig.3.17
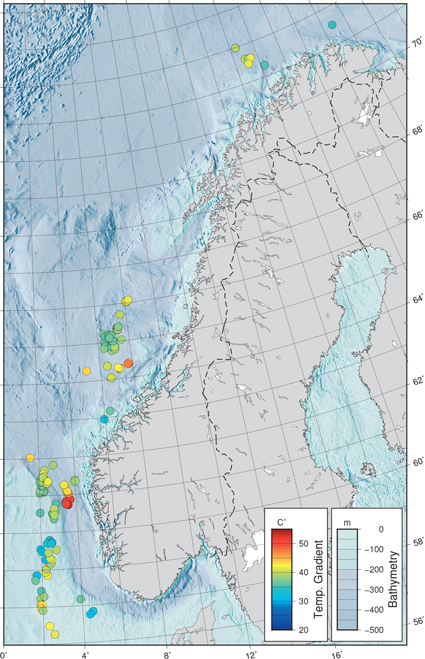
Temperature gradients obtained from drill stem tests in the NCS. The selected exploration wells have temperature measurements from drill stem tests where oil or water was produced. The colours show calculated temperature gradients from the sea floor to the depth of the test, typi-cally 1500 m to 4000 m. High temperature gradients in the order of 40°C appear to be related to basement highs, salt structures and areas with significant glacial erosion. Gradients lower than 35°C seem to correlate with areas of rapid Quaternary subsidence.
Fig.3.18
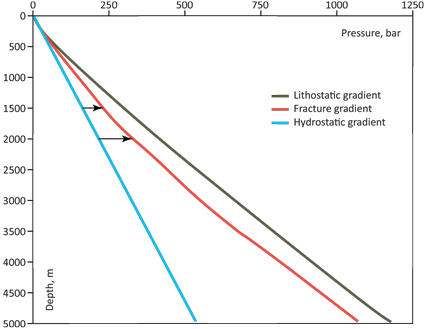
Pressure gradients obtained from pore pressure data and leak-off tests in wells from the Norwegian Sea Shelf and North Sea at water depths between 250 and 400 m. The fracturing gradient marks the lower boundary of measured leak-off pressures and the upper boundary of measured pore pressures. The lithostatic gradient was calculated from gener-al compaction curves for shale and sand with a 300 m water column. The hydrostatic gradient assumes sea water salinity. The arrows show how much pressure can be increased from hydrostatic pressure before it reaches the fracure gradient.
Fig.3.19


