The Bryne and Sandnes Formations
The southern part of the Norwegian North Sea has a well devel-oped sandy sequence, which is made up of the Lower Jurassic, Sandnes and Bryne formations with occasional contact with the sands of the Triassic Gassum and Skagerrak formations. The fine grained, lowermost Jurassic Fjerritslev Formation, is partly developed as a seal between the Gassum and Bryne Formations.
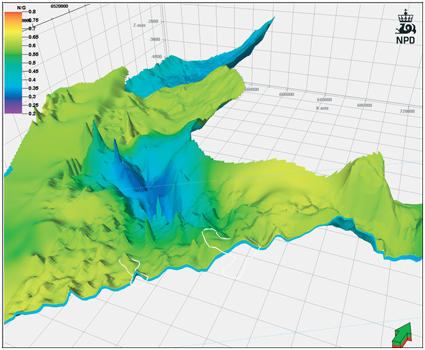
The Sandnes formation is generally developed as a well sorted and widely distributed sand, above the thicker silt and sandstones of the Bryne formation. The vertical permeability of the Bryne formation is lowered by the coaly layers developed in most of the formation. The connectivity in the Bryne formation is hampered by the typical development of isolated channels and channel belts of the delta plain. The two formations typically thin on the crests of salt structures and thicken in the basins. The yellow polygon in the figure outlines the Farsund Basin. This basin is bounded by a basement high to the south, and has been treated as a separate segment within the aquifer.
There is a limited amount of well data for constructing detailed petrophysical maps. In the present aquifer model, an average thickness is presented. For the porosity a general depth trend was applied, and for the net gross factor, a correlation to the formation thickness was attempted.
The aquifer is considered quite well suited for CO2 storage due to the well developed reservoir rocks. The aquifer is capped by the generally thick and robust mud- and clay-stones of the Boknfjord Formation.
Seal integrity should be investigated further above salt structures and in major faults. To get an idea of the storage capacity of these structures is an estimation of two structural closures presented in the table. The smaller structure is thought to be representative for the aquifer. There also seems to be a possibility for larger structures in the saddle area between the Stord Basin and the Egersund Basin. Assuming that the aquifer could contain a few of the bigger structures and that there are many salt structures which could form prospects, a capacity range of 0.5 to 2 Gt for the prospects is assumed. The integrity and res-ervoir quality of each prospect would have to be investigated, hence they are assigned to level 2 in the pyramid.
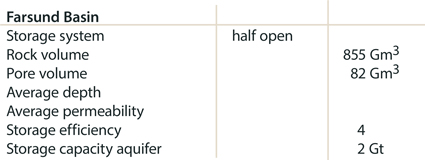
Fig-4-110
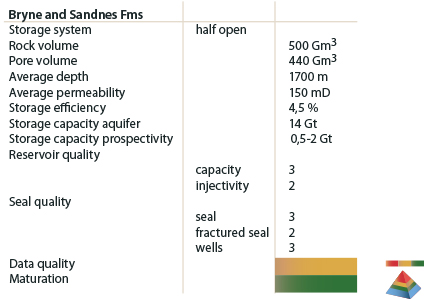
Fig-4-111
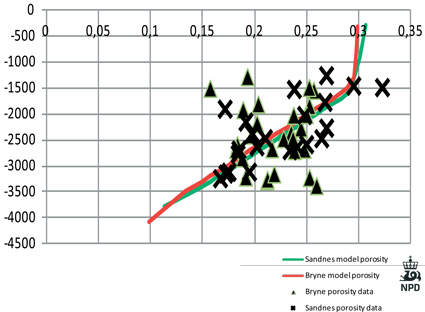
Fig-4-112
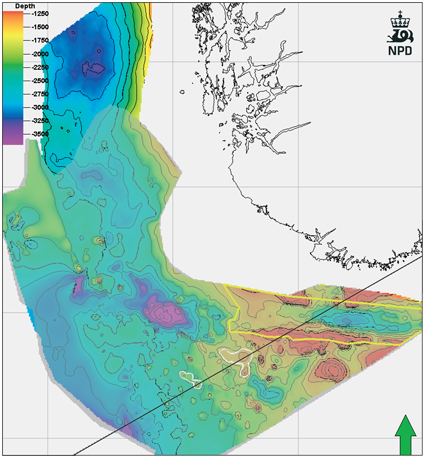
Fig-4-113
The Bryne and Sandnes aquifer. Yellow polygon shows Farsund Basin, white polygons show evaluated prospects.