3 – Undiscovered resources
Undiscovered resources are volumes of petroleum that we project could be recovered from deposits not yet proven through drilling. The estimates of undiscovered resources in opened areas are updated every two years with an assessment of recent years' exploration results, new mapping and new documentation. The analyses were last updated in autumn 2021.
In interim years, the estimates are adjusted based on the last year's drilling activity. The estimates for the ocean areas of Lofoten, Vesterålen and Senja, as well as the Barents Sea North and the ocean area around Jan Mayen have not been updated and therefore remain unchanged since the previous Resource Accounts.

Figure 3-1 Distribution of undiscovered liquids and gas in the various ocean areas with range of uncertainty.
The pie chart in Figure 3-1 shows the percentage distribution between overall undiscovered resources in each ocean area. More than 60 per cent of the undiscovered resources are located in the Barents Sea. In the Barents Sea North, we expect there to be twice the volume of undiscovered liquids compared with the other ocean areas. But this is also where the uncertainty is greatest, which is reflected in the considerable range between the high and low estimate. The potential for gas on the Norwegian shelf is also greatest in the Barents Sea. It is distributed fairly equally between south and north.
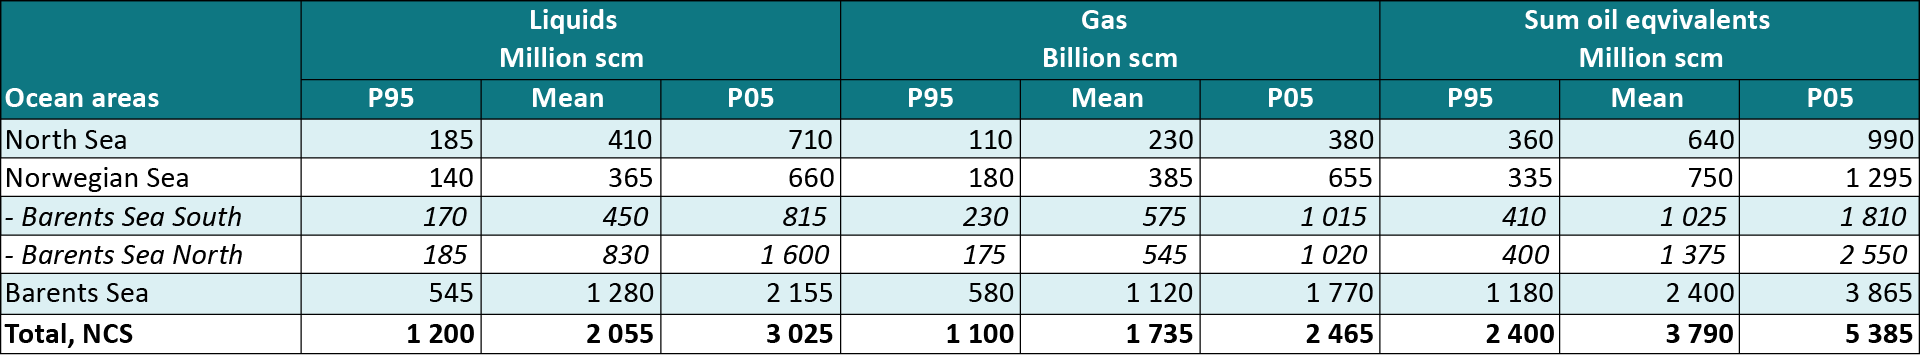
There are nevertheless considerable undiscovered resources in the North Sea and Norwegian Sea as well. In the North Sea, we expect liquids to account for the largest share, while there is an equal distribution between undiscovered liquids and gas in the Norwegian Sea. The range of uncertainty shown in Figure 3-1 is from P95 to P05 in the estimated probability distribution for the resource outcome. The figures are listed in Table 3-1. The percentages shown for each range of uncertainty reflect the change in expectation from the previous year.
Table 3-1 Undiscovered resources per ocean area with range of uncertainty
Undiscovered resources in opened and unopened areas
The NPD expects the undiscovered resources to make up 24 per cent of the overall resources on the Norwegian shelf. 56 per cent of this is in opened areas. 26 per cent of these resources are in the Barents Sea, 13 per cent in the Norwegian Sea and 17 per cent in the North Sea, as shown in Figure 3-2.
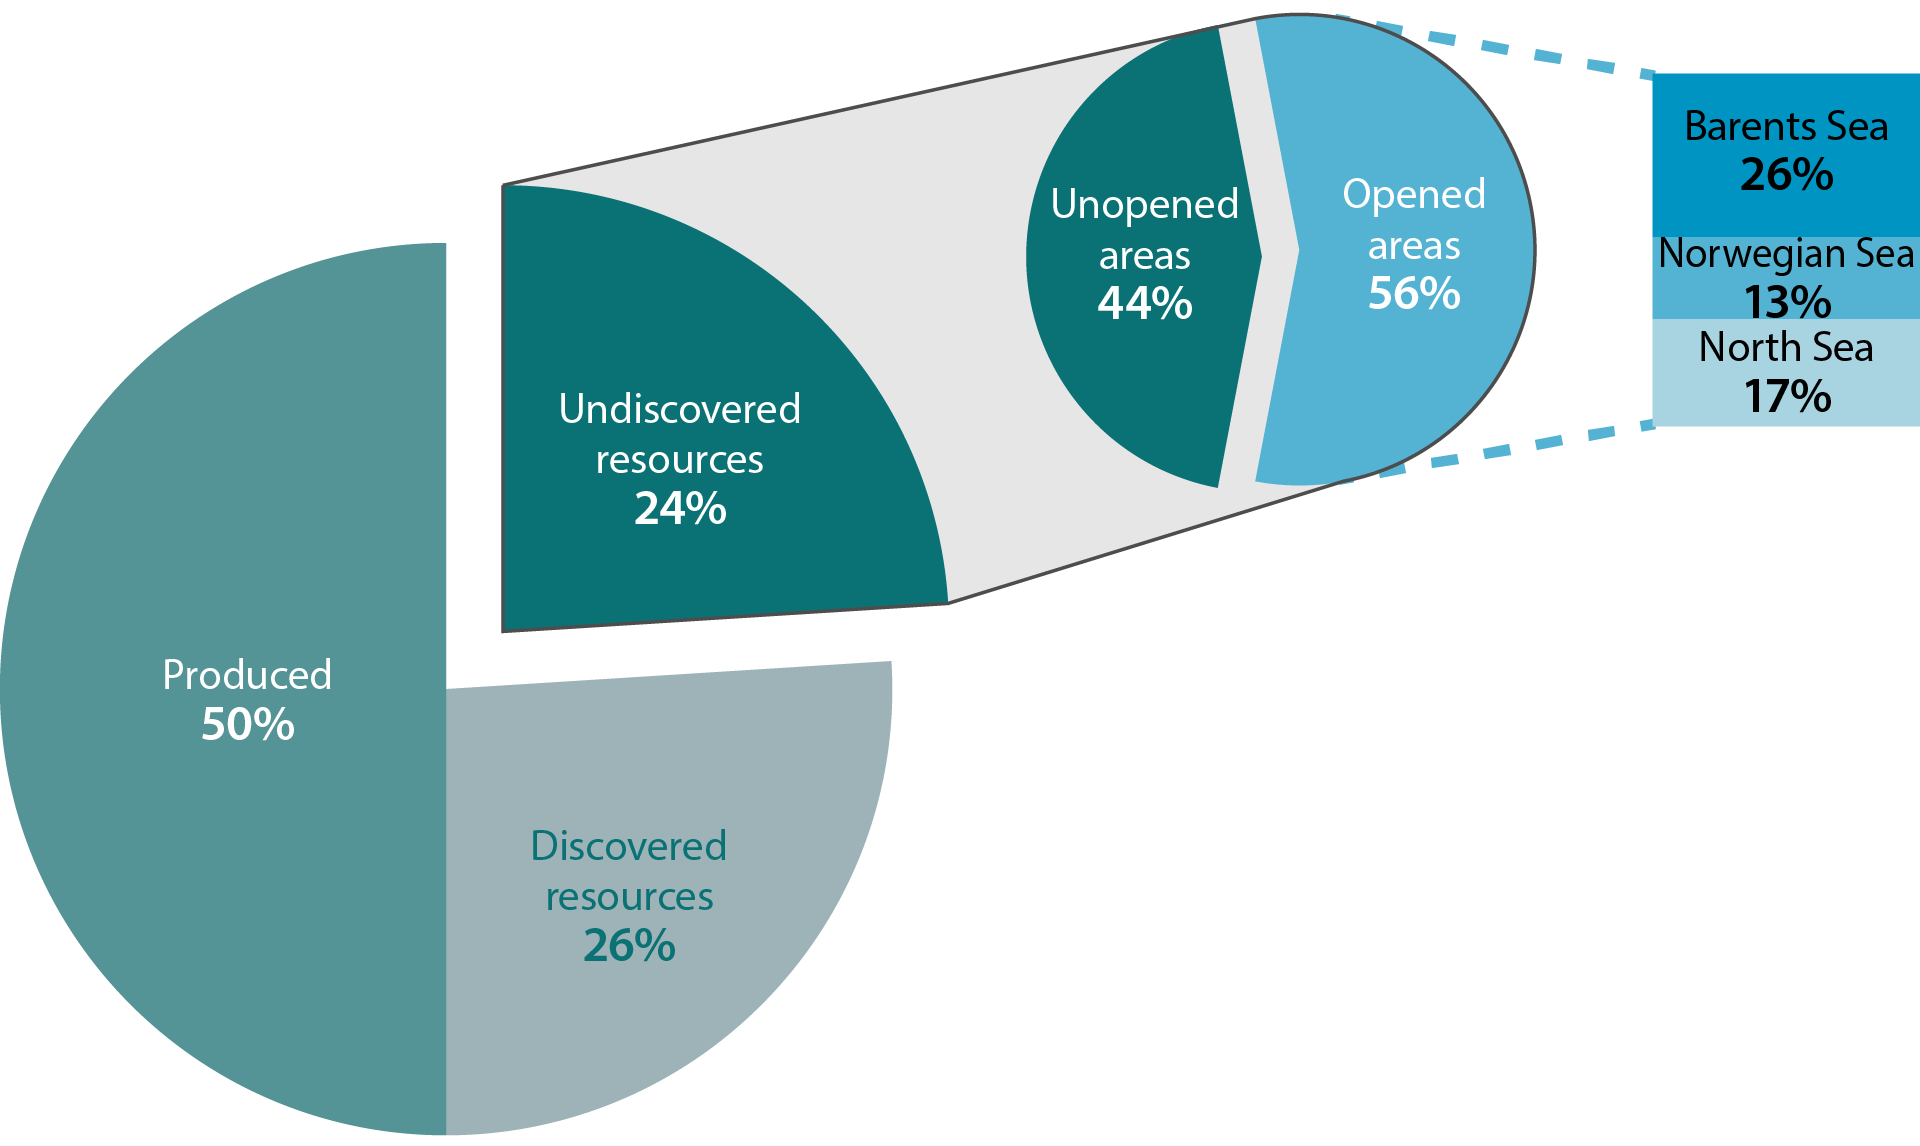
Figure 3-2 Distribution of undiscovered resources between opened and unopened areas.
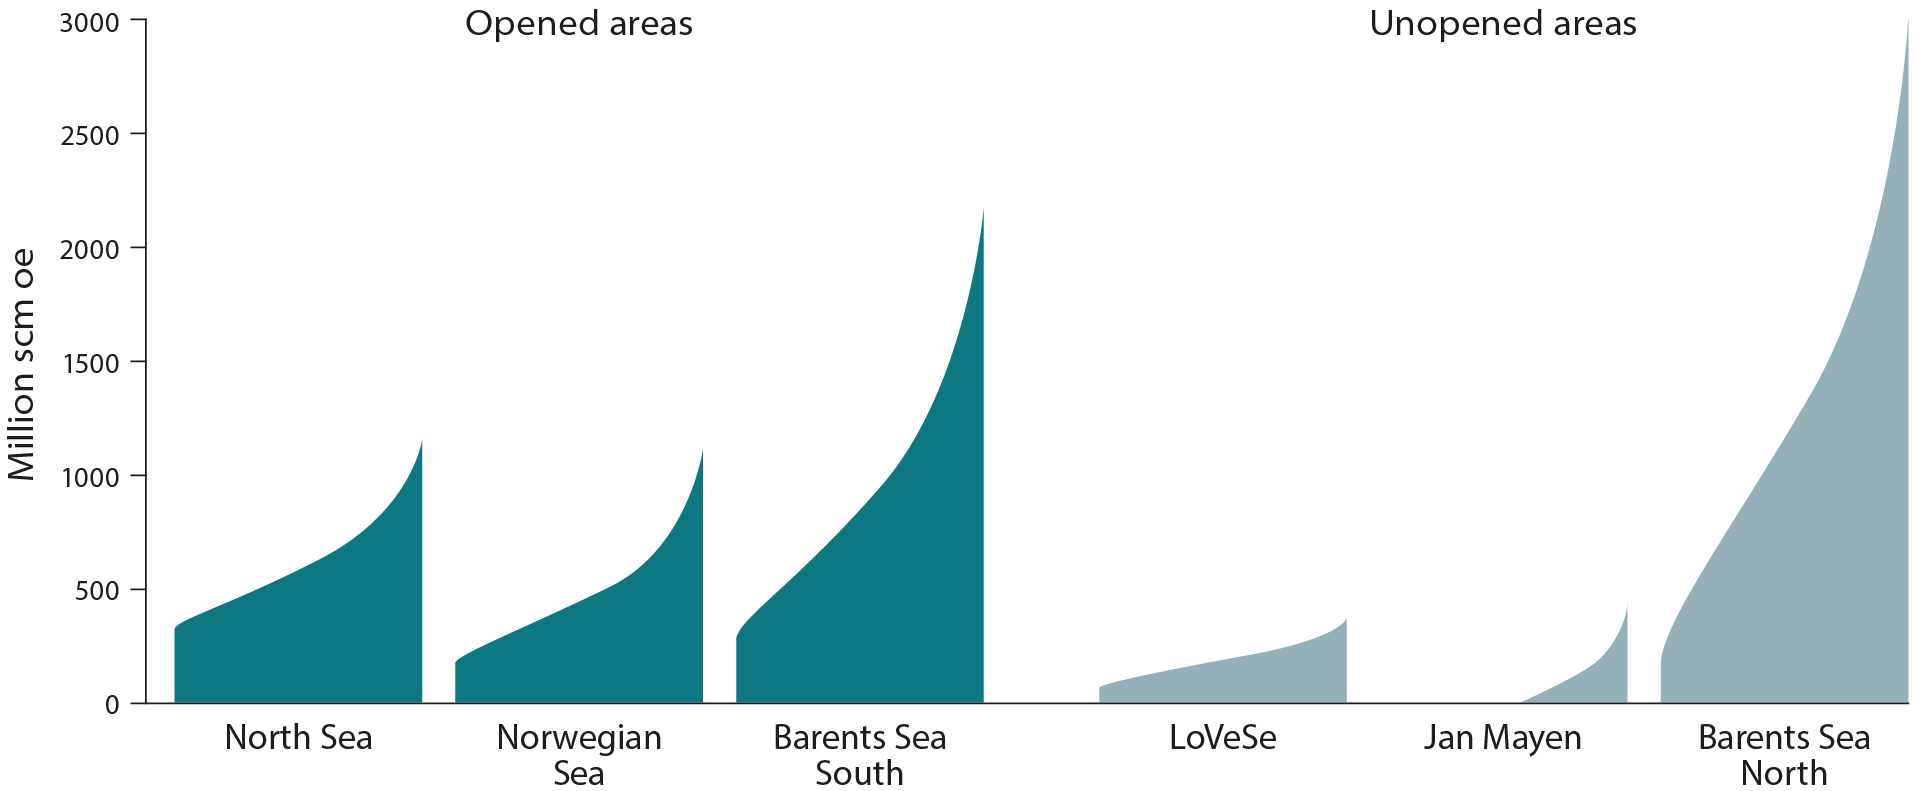
Figure 3-3 Undiscovered resources in opened and unopened areas with range of uncertainty. LoVeSe is an abbreviation for the areas of Lofoten, Vesterålen and Senja.
Despite the somewhat greater resource potential in the opened areas, the upside is greatest in the unopened part of the Barents Sea (Barents Sea North). But this is also where the uncertainty is the greatest, as shown in Figure 3-3. The resources in LoVeSe are distributed between the Norwegian Sea and the Barents Sea South.
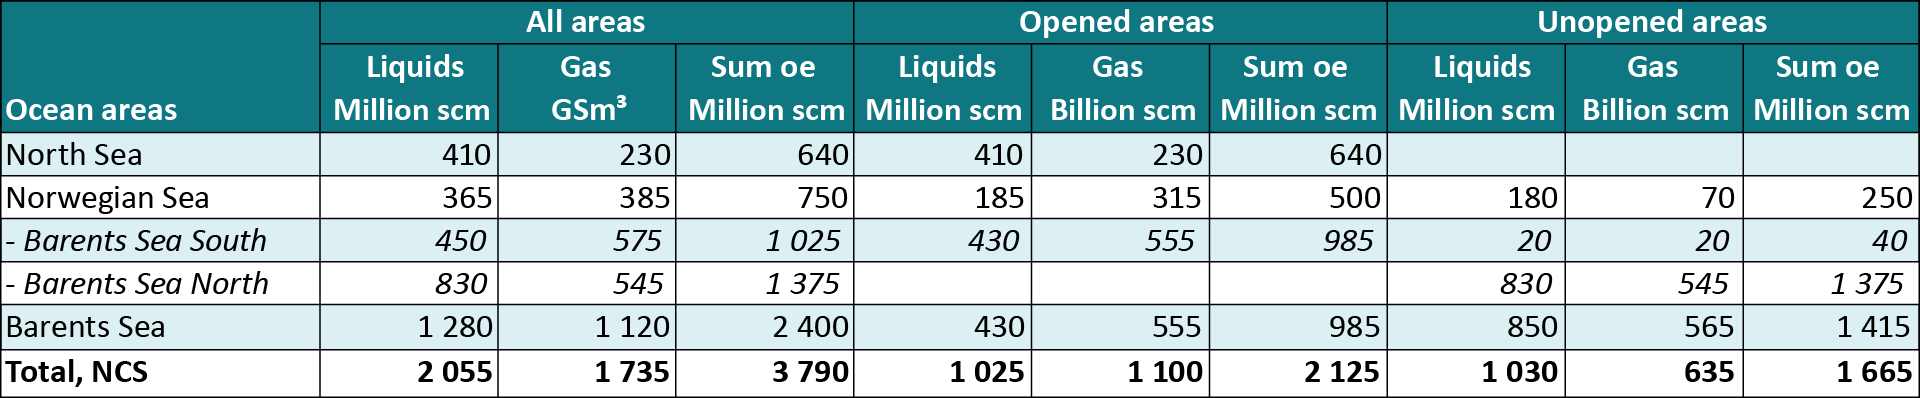
Table 3‑2 Undiscovered resources per ocean area, in opened and unopened areas.
Undiscovered resources in Norwegian ocean areas
The North Sea
The estimate for the undiscovered resources in the North Sea is 640 million scm of recoverable oe This is distributed between 410 million scm of oil and condensate (liquids) and 230 billion scm of gas. This is a reduction of four per cent from the previous year for both liquids and gas resources. This reduction is smaller than the resource volumes proven through exploration since the last estimate, which in real terms means that the estimate for remaining prospectivity is more positive than in the previous estimate.
Even in a mature area such as the North Sea, there is still significant uncertainty in the estimates for undiscovered resources, as illustrated in Figure 3-1. The figure shows a probability distribution where the low end is the P95 estimate (95 per cent likelihood that undiscovered resources exceed this value) and the high end is the P05 estimate (5 per cent likelihood that undiscovered resources exceed this value). These figures indicate the expected value in the distribution. This is normally somewhat higher than the P50 value.
Even if one cannot rule out that larger discoveries could be made in the North Sea, we expect that most discoveries will be relatively small. The average discovery size in the North Sea over the last five years is 3.6 million scm of recoverable oe.
The Norwegian Sea
The estimate for undiscovered resources in the Norwegian Sea is 750 million scm of recoverable oe. This is distributed between 365 million scm of oil and condensate and 385 billion scm of gas. This is an increase from the previous year of 13 per cent and 22 per cent for liquids resources and 5 per cent for gas resources, respectively. The increase is linked to plays in the Early Cretaceous and Late Triassic to Middle Jurassic in the more mature areas in the Norwegian Sea and reflects the successful exploration in this area in recent years. The average discovery size in the Norwegian Sea has increased over the last five years and is now 6.2 million scm of recoverable oe. The resource estimates for the Norwegian Sea also include the unchanged resource volumes in the unopened areas outside Lofoten and Vesterålen, as well as in the ocean area around Jan Mayen. These constitute about 33 per cent of the overall estimate.
The Barents Sea
The estimate for undiscovered resources in the Barents Sea is 2,400 million scm of recoverable oe. This is distributed between 1,280 million scm of oil and condensate and 1,120 billion scm of gas. This is a reduction of 4 per cent from the previous year for both liquids and gas resources. The entire reduction is associated with the Barents Sea South, where the reduction is 11 per cent for liquids and 8 per cent for gas. This reduction is largely linked to plays in the Triassic in the eastern parts of the area. Recent years' exploration results in the Barents Sea have been disappointing, with an average discovery size of 3.9 million scm of recoverable oe. This is the primary reason for the reduction. In the previous five-year period, the corresponding figure was 10.6 million scm of oe.
In the Barents Sea, 59 per cent of the resources are located in areas that have not been opened for petroleum activities, primarily in the Barents Sea North. This is the area with the greatest likelihood of making major new discoveries on the Norwegian shelf. There are considerable uncertainties associated with the estimates in these areas. The NPD is currently engaged in a geological mapping of the Barents Sea North based on new data collected since the previous mapping in 2016. The resource estimates for this area will be updated over the course of 2022.