Costs reduced
CHAPTER 4: Recovery
High oil prices characterised most of the past decade. During 2011-14, in particular, prices were stable and high in an historical perspective. The companies gave priority in this period to securing access to new resources through both exploration and farm-ins. These assets were often acquired at a substantial cost.
High costs and big investment in new field developments and fields on stream meant a number of companies had a weak cash flow – even at a time of peak oil prices. The price slump which began in 2014 reinforced this trend.

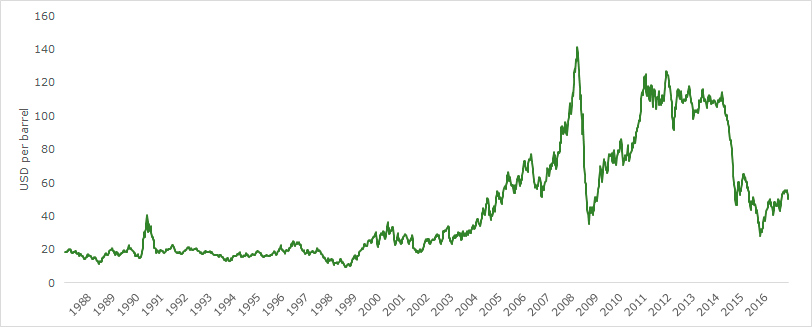
The oil price slump from mid-2014 reinforced the need to reduce costs. Source: US Energy Information Administration (EIA).
Cost-cutting measures
The petroleum industry has taken a number of steps to reduce its cost level. Simpler solutions and more efficient implementation are two measures which have had a big effect. In addition comes the impact of lower prices from suppliers.
Cost-cutting is reflected in lower investment for new projects, reduced spending on production wells on fields on stream, and a decline in operating and exploration costs
Investment costs in seven projects
A rough indicator of cost trends can be obtained by comparing costs for a set of seven field development projects.

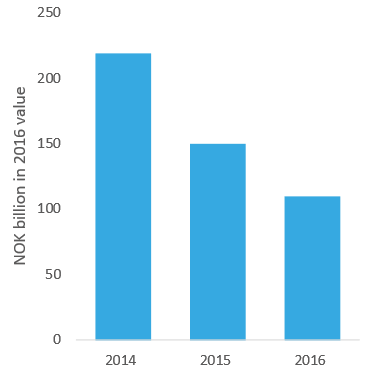
Cost estimates were halved from the autumn of 2014 to the autumn of 2016.
A rough indicator of cost trends can be obtained by comparing costs for a set of seven field development projects.
Operator company estimates for overall investment in these projects was just under NOK 220 billion in 2014. That had been reduced by the autumn of 2016 to NOK 110 billion – in other words, half the original figure. Recoverable resources in the projects are virtually unchanged. The biggest cuts were for new facilities and production wells. Average estimated well costs were roughly halved from 2014 to 2016.
This decline in spending has been very significant for the profitability of these projects. The breakeven price for the seven was reduced to less than USD 40 per barrel – in some cases below USD 30. For certain projects, this represented more than a halving.
The seven projects concerned are Johan Sverdrup phase II, Johan Castberg, Utgard, Oda, Trestakk, Dvalin and Bauge. All are based on subsea installations with the exception of Johan Castberg, which has reported a development solution based on a floating production, storage and offloading (FPSO) unit, and Johan Sverdrup phase II, where a fixed platform has been reported. The common denominator for these projects is that their development concepts remained unchanged from 2014 to 2016.
Cost-cutting measures contribute to profitability in the short term. It is important that the action taken also contributes to long-term value creation.
The NPD emphasises the importance of studying all options, and choosing solutions with the flexibility to take care of future opportunities. It wants all projects which contribute value to society to be implemented. Investment decisions should be taken on the basis of decision criteria which reflect the contribution of the projects to value creation.
SEE ALSO: The NPD’s role in value creation
Investment during periods of low activity in the industry contributes to the continuity of expertise and capacity. This will strengthen the basis for dealing with a later upturn in the business cycle.
READ ALSO: Maximising value
Operating costs
Operating costs have also declined in recent years. The figure below presents their development from 2014 to 2016. Calculations are based on the 67 fields which came on stream before 2013, and which were still in production during 2016.

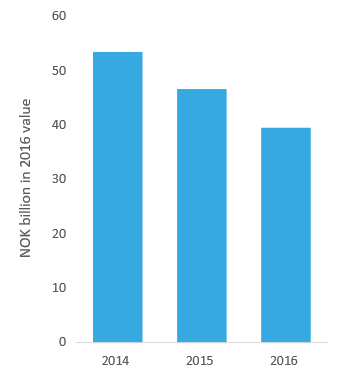
Operating costs down by 26 per cent.
Total annual operating costs for these fields fell from NOK 54 billion on 2014 to NOK 40 billion two years later. That represents a reduction of roughly 26 per cent.
Operating costs exclude spending on gas buying or “operating preparations”. While the figures for 2014 and 2015 are final, those for 2016 represent forecasts and are therefore uncertain.