Big resource in the discovery portfolio
Chapter 4: Recovery
The portfolio comprised 77 discoveries at 31 December 2016. While the largest of these are in the Barents Sea, the biggest number is in the North Sea. In addition come 145 discoveries which are not currently expected to be Commercial.
Discoveries may be regarded as non-commercial for various reasons. The commonest is a combination of small recoverable resources and a long distance to infrastructure. But the discoveries have been made and, if conditions change, they could be developed later. Knowledge of these finds is relevant for players on the Norwegian continental shelf (NCS) because such information will be useful in their assessment of opportunities for exploration, development and developing Technology.
Planning status for discoveries
Eighty-five per cent of the resources lie in 50 discoveries where development has been evaluated and where work is under way on reaching a decision to proceed. Fifteen per cent of the resources lie in 27 discoveries where development has not been evaluated.
Changed assessments mean that discoveries could be included in or excluded from the portfolio between the time they are discovered and a plan for development and operation (PDO) is submitted to the government.
Relicensing of relinquished acreage gives new licensees an opportunity to re-evaluate finds. This year’s accounts assess two discoveries previously classified as unlikely to be produced for future Development.
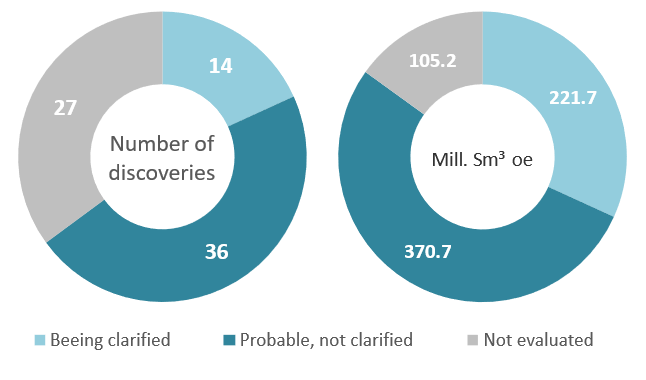
Most discoveries fall into the category “Probable, not clarified”.
Discoveries by NCS region
Johan Castberg in the Barents Sea is clearly the largest of the 77 discoveries under consideration for development. It has an estimated recoverable volume of 88.1 million scm of liquid and 10.9 billion scm of gas. That represents about 42 per cent of the resources in Barents Sea discoveries and roughly 14 per cent of total resources in discoveries where a plan for development and operation (PDO) has yet to be delivered.
Recoverable resources in millions of scm oe are presented in the table below.
| Region | Discoveries | Million scm oe |
| North Sea | 42 | 276,8 |
| Norwegian Sea | 27 | 181,9 |
| Barents Sea (ex Johan Castberg) | 7 | 139,5 |
| Johan Castberg | 1 | 99,0 |
| Total | 77 | 697,2 |
As the table shows, the North Sea is the clear leader for number of discoveries. But most of these are small, with a median volume of 4.1 million scm oe. Because of their size, few will be developed with a stand-alone process facility. Phasing-in to producing fields will often yield cost-effective development solutions, with an added value as a supplementary volume for the continued operation of existing infrastructure.
Assessing opportunities for coordinated development of several discoveries in an early phase is important. The portfolio is large, and many of the discoveries are so small that it could be difficult to bring them on stream separately in a profitable manner. Developing several discoveries together could reduce costs and help ensure profitability.
Distribution between oil and gas in each region
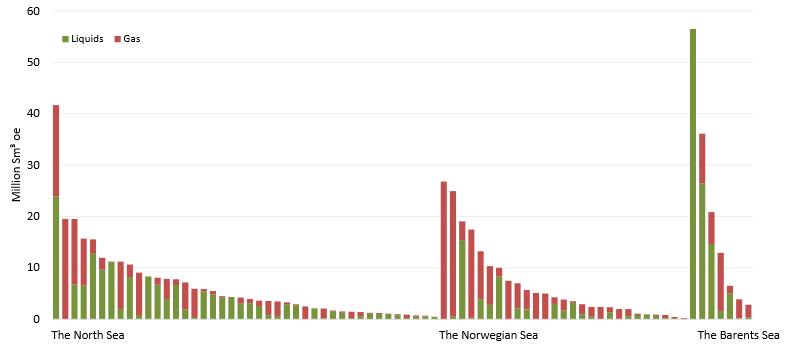
Discoveries broken down by region and size are presented below (excluding Johan Castberg because of its dimensions).
Largest discoveries in the North Sea
Recoverable resources in millions of scm oe (Mscm oe)
| Funn | Discovery year | Operator | Million scm oe |
| 30/11-8 S (Krafla) | 2011 | Statoil Petroleum AS | 42 |
| 35/2-1 (Peon) | 2005 | Statoil Petroleum AS | 20 |
| 1/9-1 TOMMELITEN ALPHA | 1977 | ConocoPhillips Skandinavia AS | 20 |
| 2/4-21 (King Lear) | 2012 | Statoil Petroleum AS | 16 |
| 35/9-7 (Skarfjell) | 2012 | Wintershall Norge AS | 15 |
| 25/2-10 S (Frigg-GammaDelta) | 1986 | Aker BP ASA | 12 |
| 34/6-2 S (Garantiana) | 2012 | Total E&P Norge AS | 11 |
| 34/12-1 (Afrodite) | 2008 | Eni Norge AS | 11 |
| 31/7-1 (Brasse) | 2016 | Faroe Petroleum Norge AS | 11 |
| 15/5-2 EIRIN | 1978 | Statoil Petroleum AS | 9 |
Most of the discoveries not yet sanctioned for development lie in the North Sea. Most are small, and bringing them on stream will depend on existing infrastructure which could have a limited producing life. Conditions also favour merging several discoveries in a joint development solution.
Exploration around existing infrastructure may reveal new discoveries, which could help to improve the profitability of existing finds while also helping to extend the producing life of a possible host Field.
Largest discoveries in the Norwegian Sea
Recoverable resources in millions of scm oe (Mscm oe
| Discovery | Discovery year | Operator | Million scm oe |
| 6506/6-1 (Victoria) | 2000 | Total E&P Norge AS | 27 |
| 6406/9-1 LINNORM | 2005 | A/S Norske Shell | 25 |
| 6406/12-3 S (Pil) | 2014 | VNG Norge AS | 19 |
| 6705/10-1 (Asterix) | 2009 | Statoil Petroleum AS | 17 |
| 6406/2-1 LAVRANS | 1995 | Statoil Petroleum AS | 13 |
| 6506/9-2 S (Fogelberg) | 2010 | Centrica Resources (Norge) AS | 10 |
| 6407/8-6 BAUGE | 2013 | Statoil Petroleum AS | 10 |
| 6706/6-1 (Hvitveis) | 2003 | Wintershall Norge AS | 8 |
| 6607/12-2 S (Alve Nord) | 2011 | Total E&P Norge AS | 7 |
| 6407/7-8 (Noatun) | 2008 | Statoil Petroleum AS | 6 |
The discovery portfolio in the Norwegian Sea is dominated by gas finds. Certain of these have tight reservoirs and thereby present special challenges for production and profitability.
6406/12-3 S Pil is the biggest oil discovery in the Norwegian Sea, and lies close to Njord. Plans call for it to be developed as a satellite to that field. The licensees for 6407/8-6 Bauge submitted a PDO to the government in March 2017, with Njord again as the host installation. A PDO has also been submitted for extending the producing life of Njord, which ensures recovery of residual reserves and makes it possible to implement a number of improved recovery measures
Largest discoveries in the Barents Sea
Recoverable resources in millions of scm oe (Mscm oe)
| Discovery | Discovery year | Operator | Million scm oe |
| 7220/8-1 JOHAN CASTBERG | 2011 | Statoil Petroleum AS | 99 |
| 7324/8-1 (Wisting) | 2013 | OMV (Norge) AS | 56 |
| 7220/11-1 (Alta) | 2014 | Lundin Norway AS | 36 |
| 7120/1-3 (Gohta) | 2013 | Lundin Norway AS | 21 |
| 7120/12-2 (Alke Sør) | 1981 | Eni Norge AS | 13 |
The largest discoveries are located in the Barents Sea and contain substantial oil resources. Several are planned to be brought on stream with stand-alone installations. It is important that development solutions take account of the future tapping of resources in the area.
Considerable activity is being devoted to maturing Johan Castberg, and the intention is to submit a PDO during 2017. Work is also under way on plans to develop the Wisting discovery and to achieve a joint development of Alta and Gohta.

145 discoveries “unlikely to be developed”
This category incorporate petroleum quantities which are regarded as too small to be relevant for development, or which call for substantial changes to technology and access to infrastructure, significantly higher price expectations or other requirements to be developed profitably. Should these conditions change, however, a possible reclassification of these discoveries cannot be excluded. Knowing about them, including their geological data, is nevertheless relevant for players on the NCS. Information about the discoveries is useful when assessing opportunities for exploration, development and developing Technology
A number of criteria can place a discovery in the “unlikely” resource class
- The volume discovered is too small to be relevant for profitable Development
- Development would require new Technology
- The discovery is too far from existing infrastructure
- The discovery is located in a production licence which has been relinquished to the government
The estimate of the possible recoverable volume is based on varying degrees of information, and about 70 per cent have a volume of less than two million scm oe.
Dynamic discovery portfolio
Differing assessments mean that discoveries can move in and out of the portfolio. At 1 January 2016, it comprised 90 development projects. That figure had been reduced to 77 by 31 December, even though 18 new discoveries were made during the year.
READ MORE: How the dynamics of the discovery portfolio works