Fact box 4.1 Drilling costs
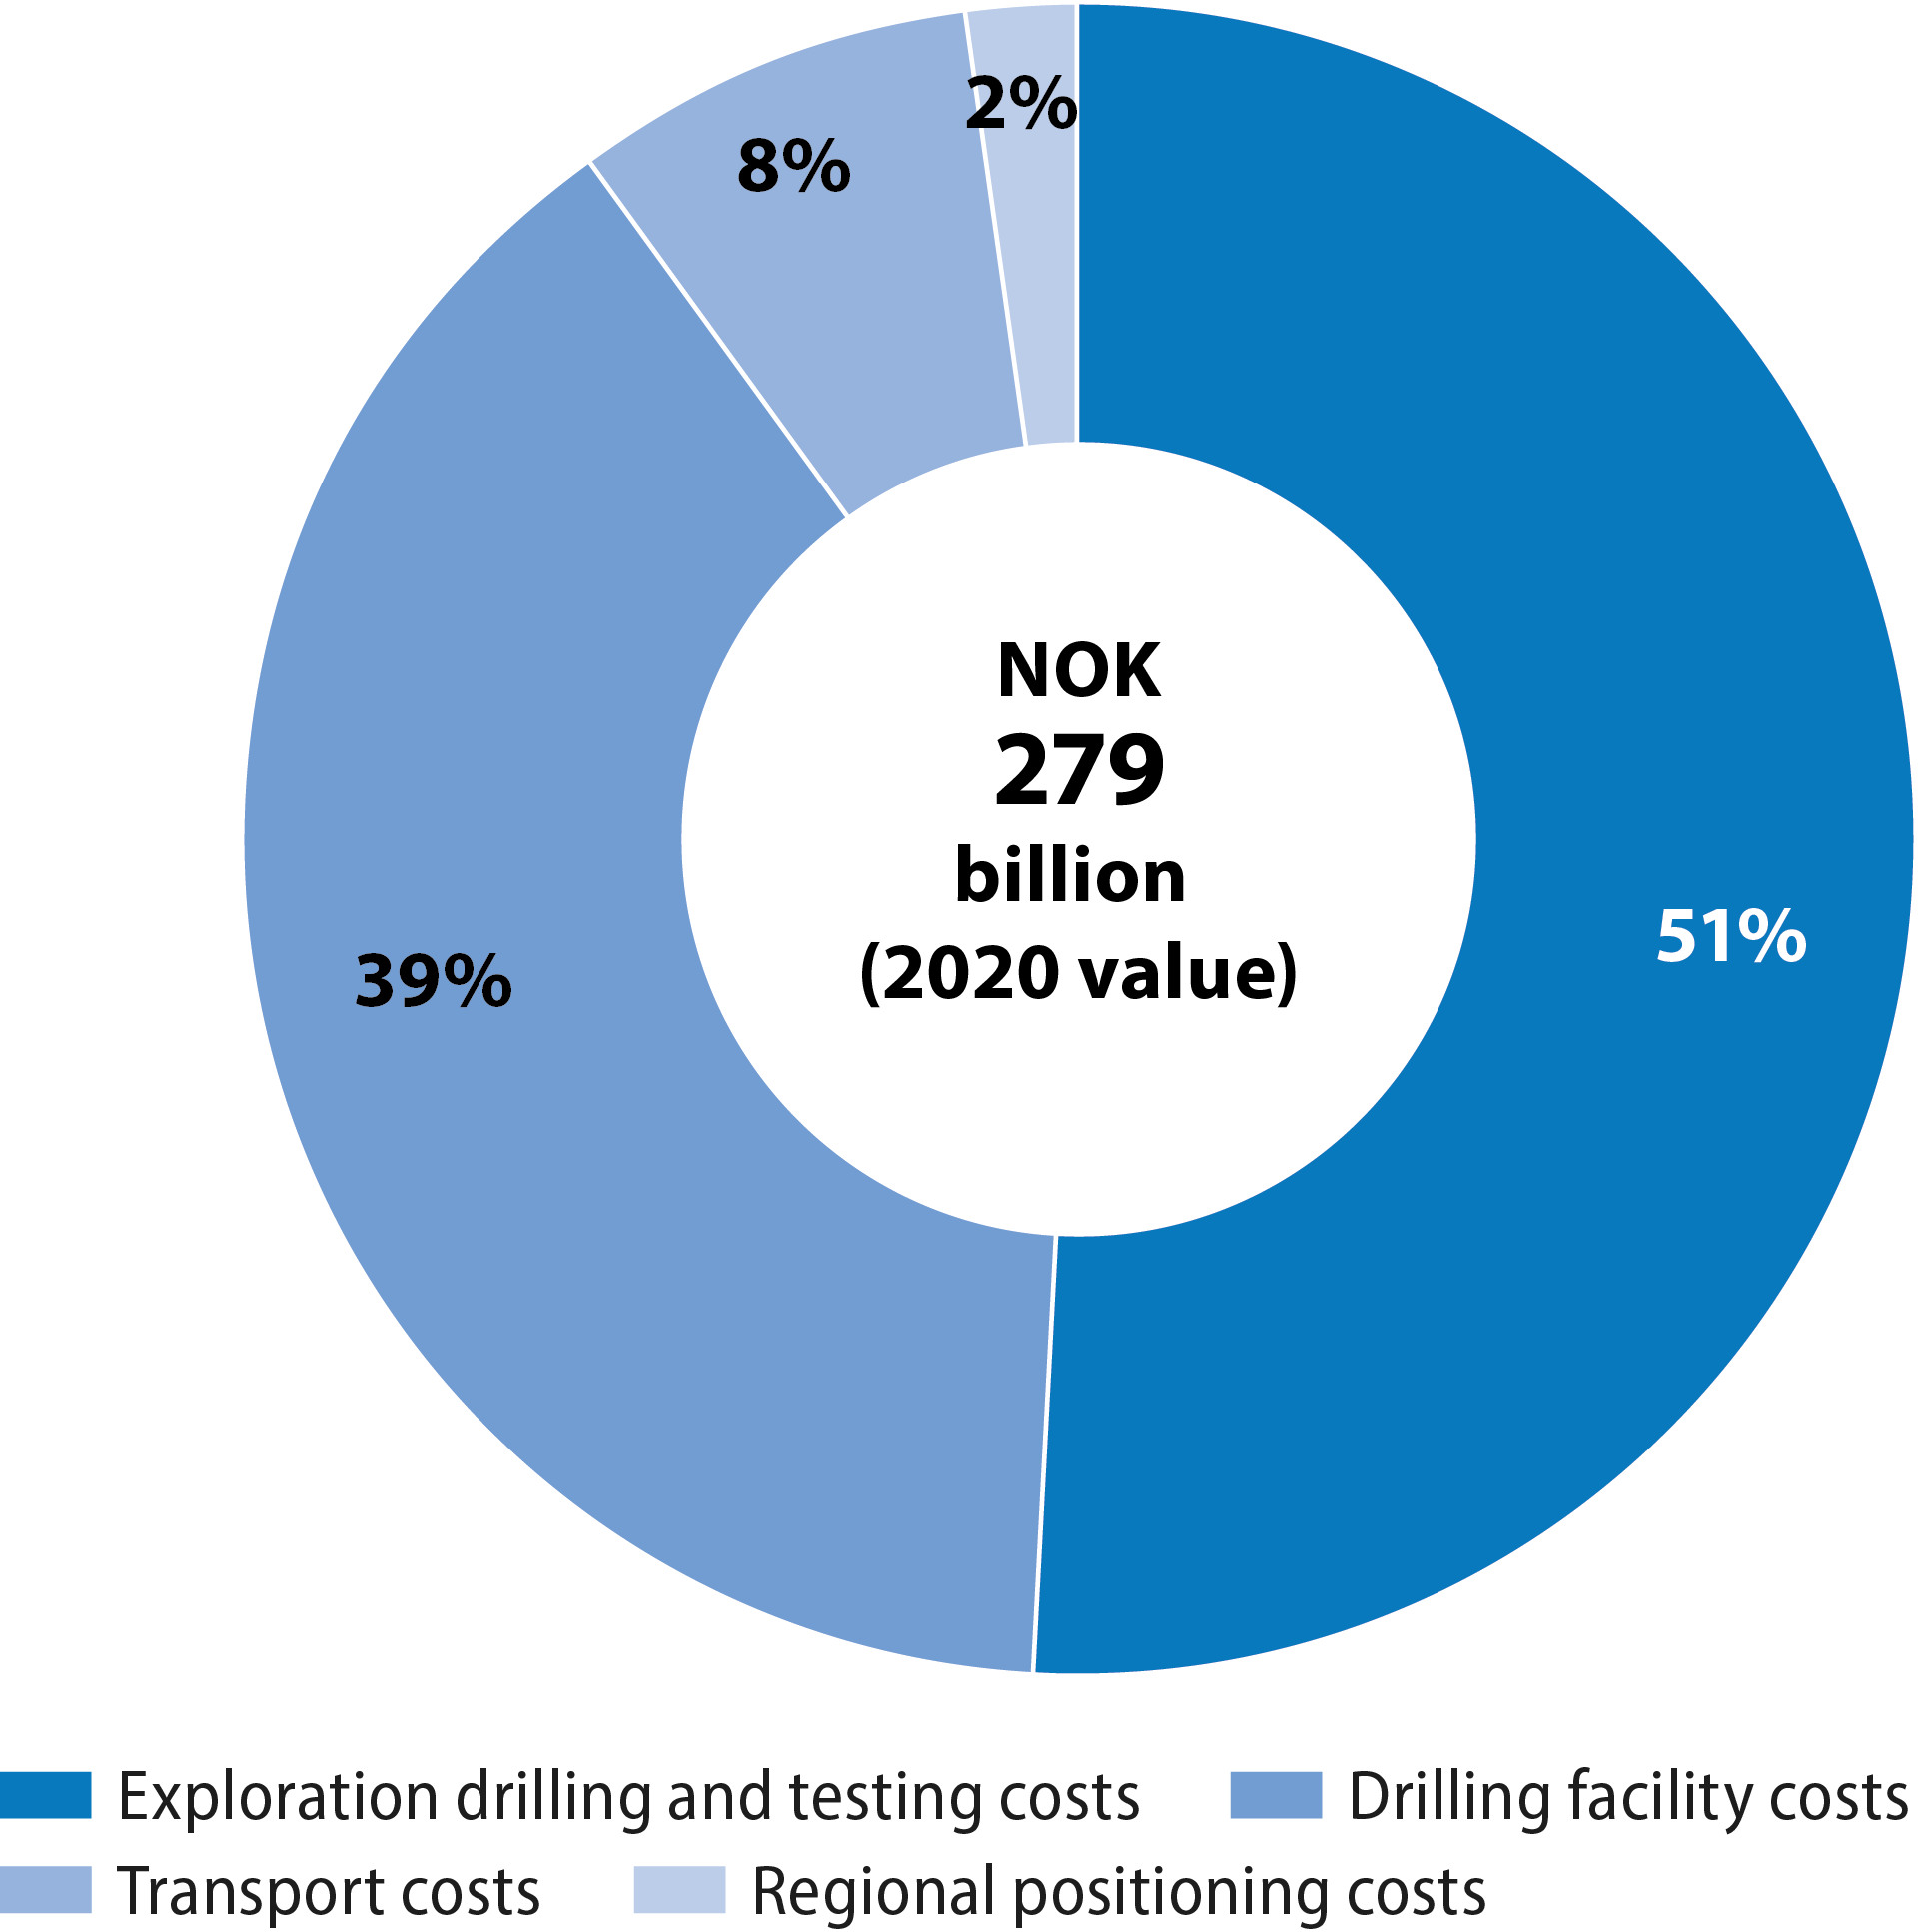
Drilling costs are divided into positioning, transport, exploration drilling and testing, and drilling vessels (figure 4.3).
Regional positioning accounts for less than two per cent of total drilling costs, and comprises spending on acquiring and processing geophysical data in order to determine the well location. Representing about eight per cent, transport covers vessel, helicopter and aircraft expenses.
Exploration drilling and testing account for more than 50 per cent of the total. This includes planning, drilling, downhole testing and data acquisition, test production, completion and plugging of the well, and other technical services such as rig positioning, inspections, weather forecasting, navigation, readying and clearing up, and cement and mud services.
In addition come consumables related to these components. The drilling facility accounts for just under 40 per cent of costs, including hire and other chartering expenses. Rig hire amounted to more than NOK 90 billion (2020 value) in 2000-19, or about a third of total drilling costs in this period and a quarter of overall exploration spending.
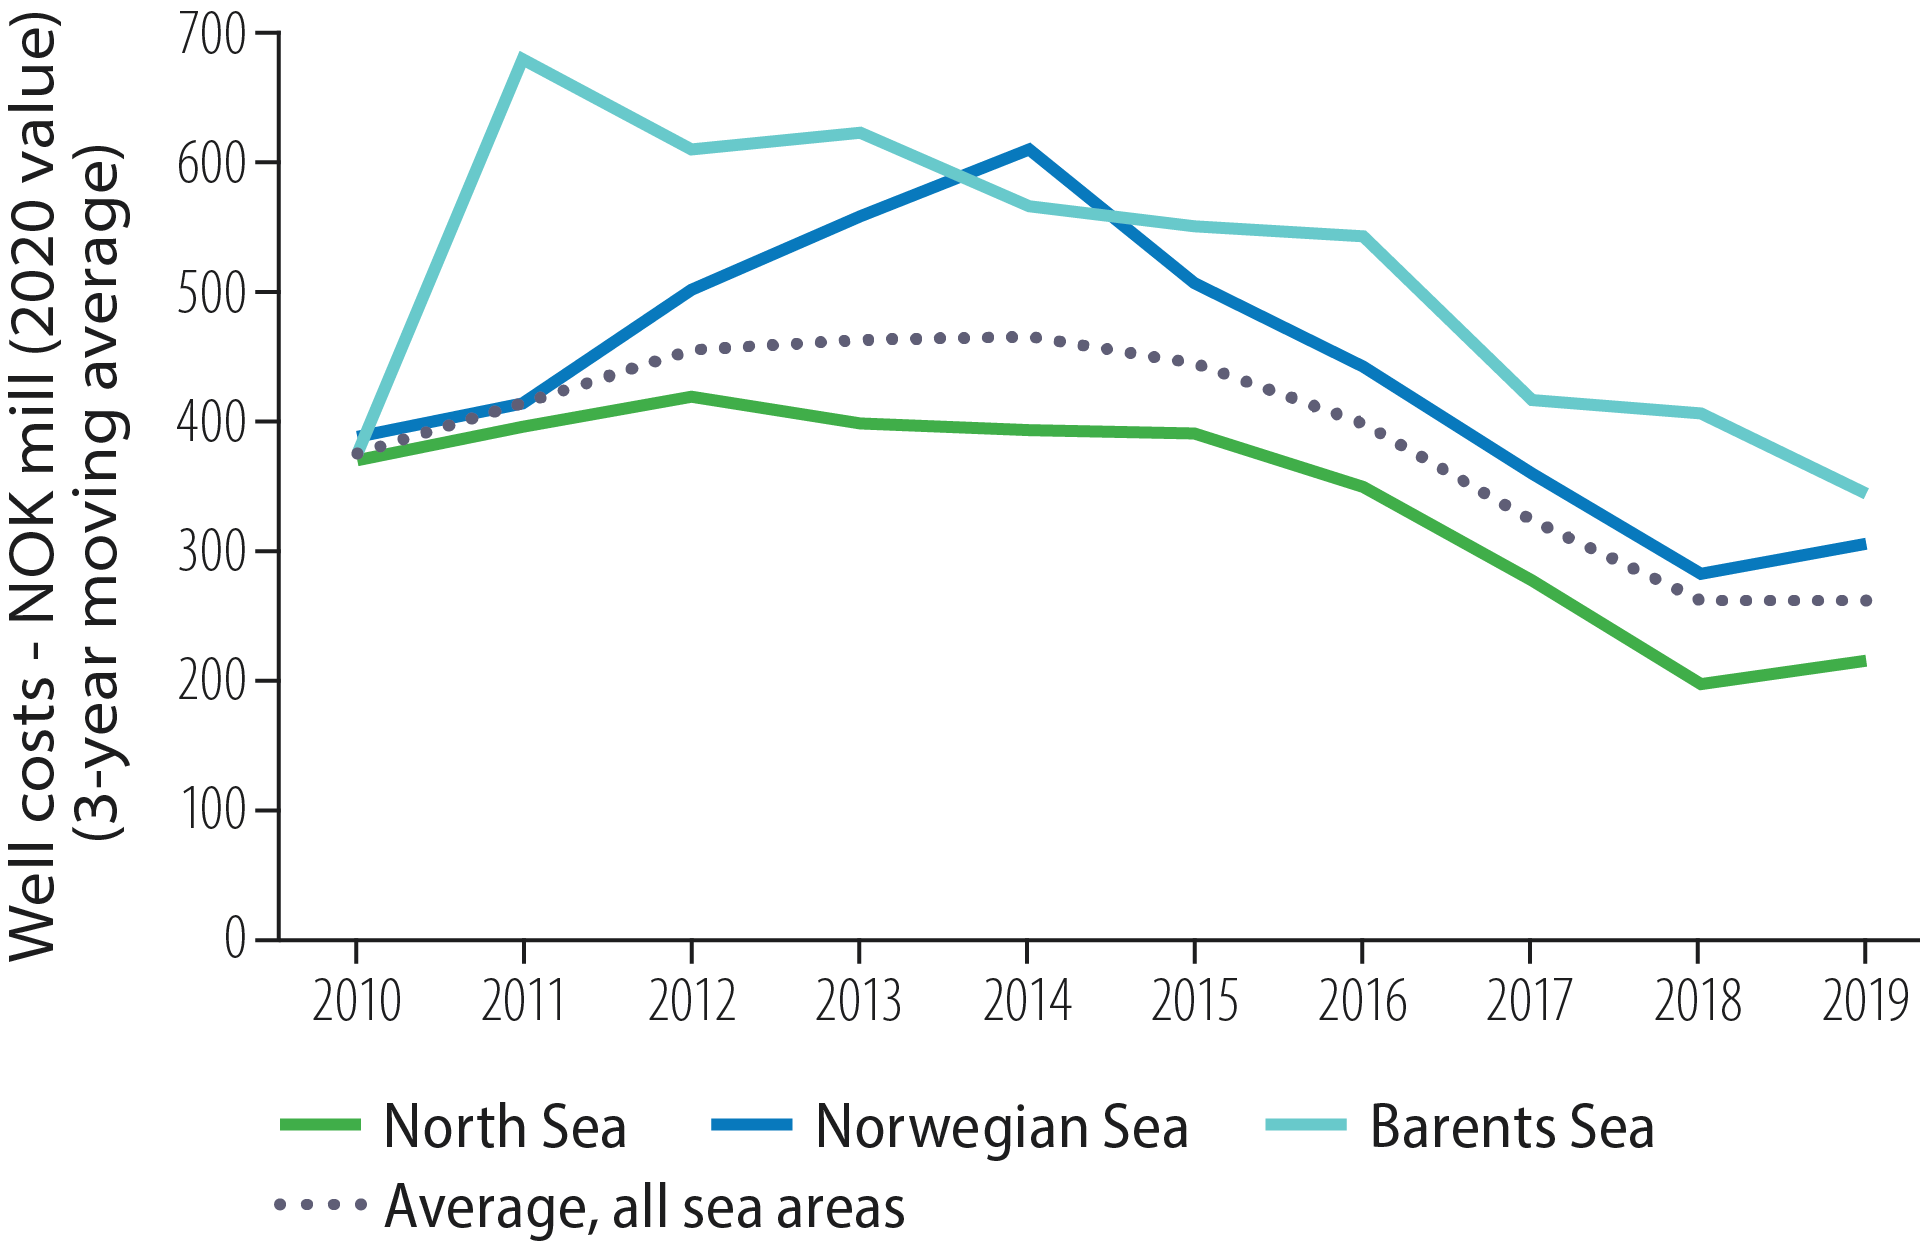
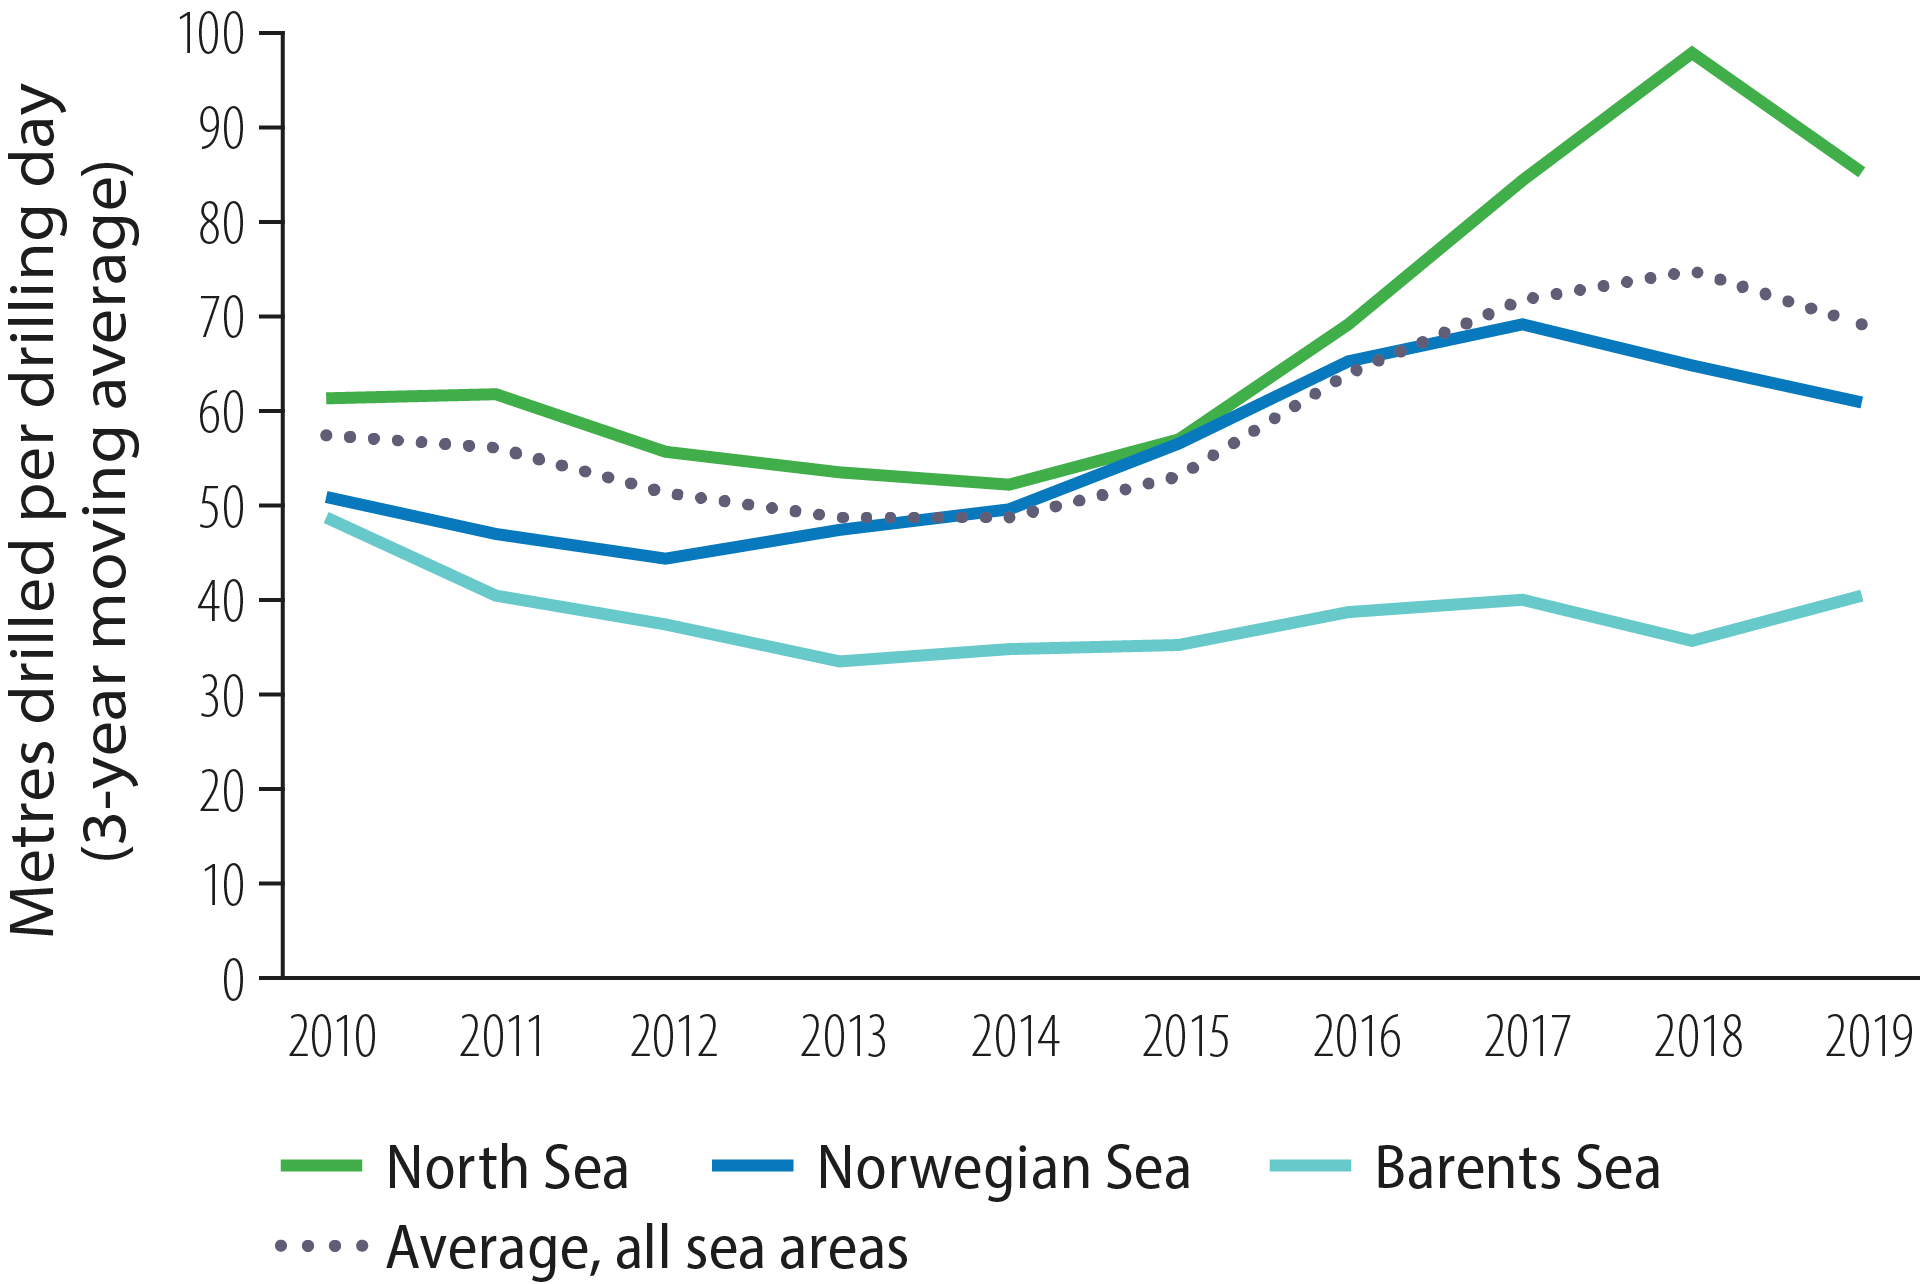
Substantial efficiency gains during recent years have helped to reduce drilling costs. An NPD analysis of drilling efficiency over the past decade (2010-19) shows that the cost per exploration well has declined (figure 4.4) and metres drilled per drilling day are up (figure 4.5).

Figure 4.3 Drilling costs by category, 2000-19

Figure 4.4 Drilling costs per exploration well (well costs) by region, 2010-19

Figure 4.5 Metres drilled per drilling day for exploration wells by region, 2010-19