2 – Remaining petroleum resources
The NPD’s estimate for total petroleum resources on the NCS is 15 864 million scm oe. Roughly half of this quantity has been sold and delivered. Substantial undiscovered resources remain, and about 56 per cent of these are expected to lie in opened areas. The potential for discovering more gas is greatest in the Barents Sea. Fields on stream contain large remaining resources, with a substantial potential for improved recovery.
One of the NPD’s principal duties is to maintain an overview of the total petroleum resources so that the government has the best possible basis for planning measures to ensure good management.
Discovered oil and gas resources are developed as fields if they are technologically and economically commercial. The oil and gas are produced and sold. That creates dynamic resource accounts which change from year to year.
The resource accounts for 2021 estimate the total volume of resources (include the quantities sold and delivered) on the NCS at 15 864 million scm oe. This breaks down as 9 258 million scm of liquids and
6 605 billion scm of gas. Compared with 2020, that represents an increase of 97 million scm oe. The NPD’s resource classification system is presented in chapter 1.
Remaining volumes broken down by resource class together with the volume sold and delivered at 31 December 2021 are presented in Figure 2.1.
The total is shown with the expected volume, and the uncertainty illustrated by low and high estimates. The distribution of both liquids and gas is presented in the figure. Uncertainty in the volume estimates decreases with increasing maturity. The pie chart on the right shows that 50 per cent of the expected resources on the NCS have been produced and that 24 per cent of the total resources remain to be discovered.

Figure 2.1 Total petroleum resources and uncertainty in the estimates at 31 December 2021
Figure 2.2 presents the development in estimated total liquid and gas resources in 2001, 2011 and 2021. The estimate for undiscovered resources in 2021 is about the same as it was in 2001. This is partly attributable to increased knowledge, technology advances and the expansion in the base acreage for calculating resources during the period as a result of opening new areas.

Figure 2.2 Development of the resource estimate.
Area status on the NCS
The NCS covers a total of 2 279 965 square kilometres, six times greater than mainland Norway, Svalbard and Jan Mayen put together. Roughly half this area comprises sedimentary rocks which might contain petroleum. With some exceptions, the North and Norwegian Seas and Barents Sea South have been opened for petroleum activities (Figure 2.4).
The first production licences in the North Sea were awarded in 1965. Opening the Norwegian and Barents Seas (the areas above the 62nd parallel) for petroleum operations occurred in 1980.
Oil and gas in the North Sea are mostly classified as reserves – in other words, they are covered by a development decision. The bulk of the oil and gas resources in the Barents Sea is undiscovered. Large parts of the Barents Sea are not opened for petroleum activities, and this is where the expected value of undiscovered resources is highest (Figure 2.3).
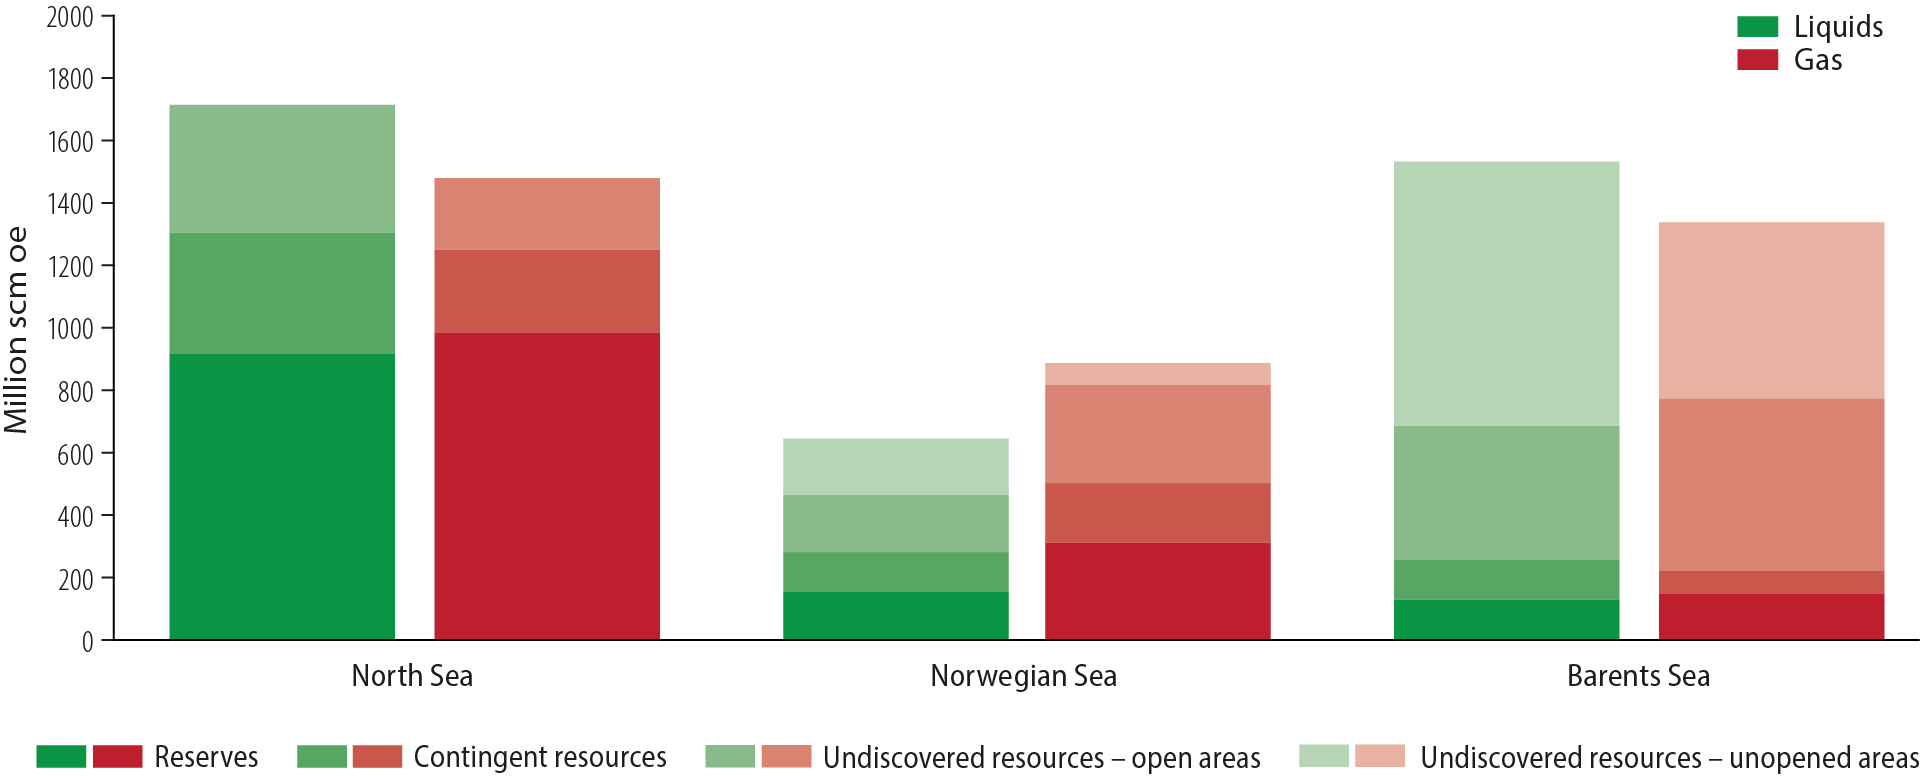
Figure 2.3 Distribution of remaining liquid and gas resources (expected value) by NCS area and class.
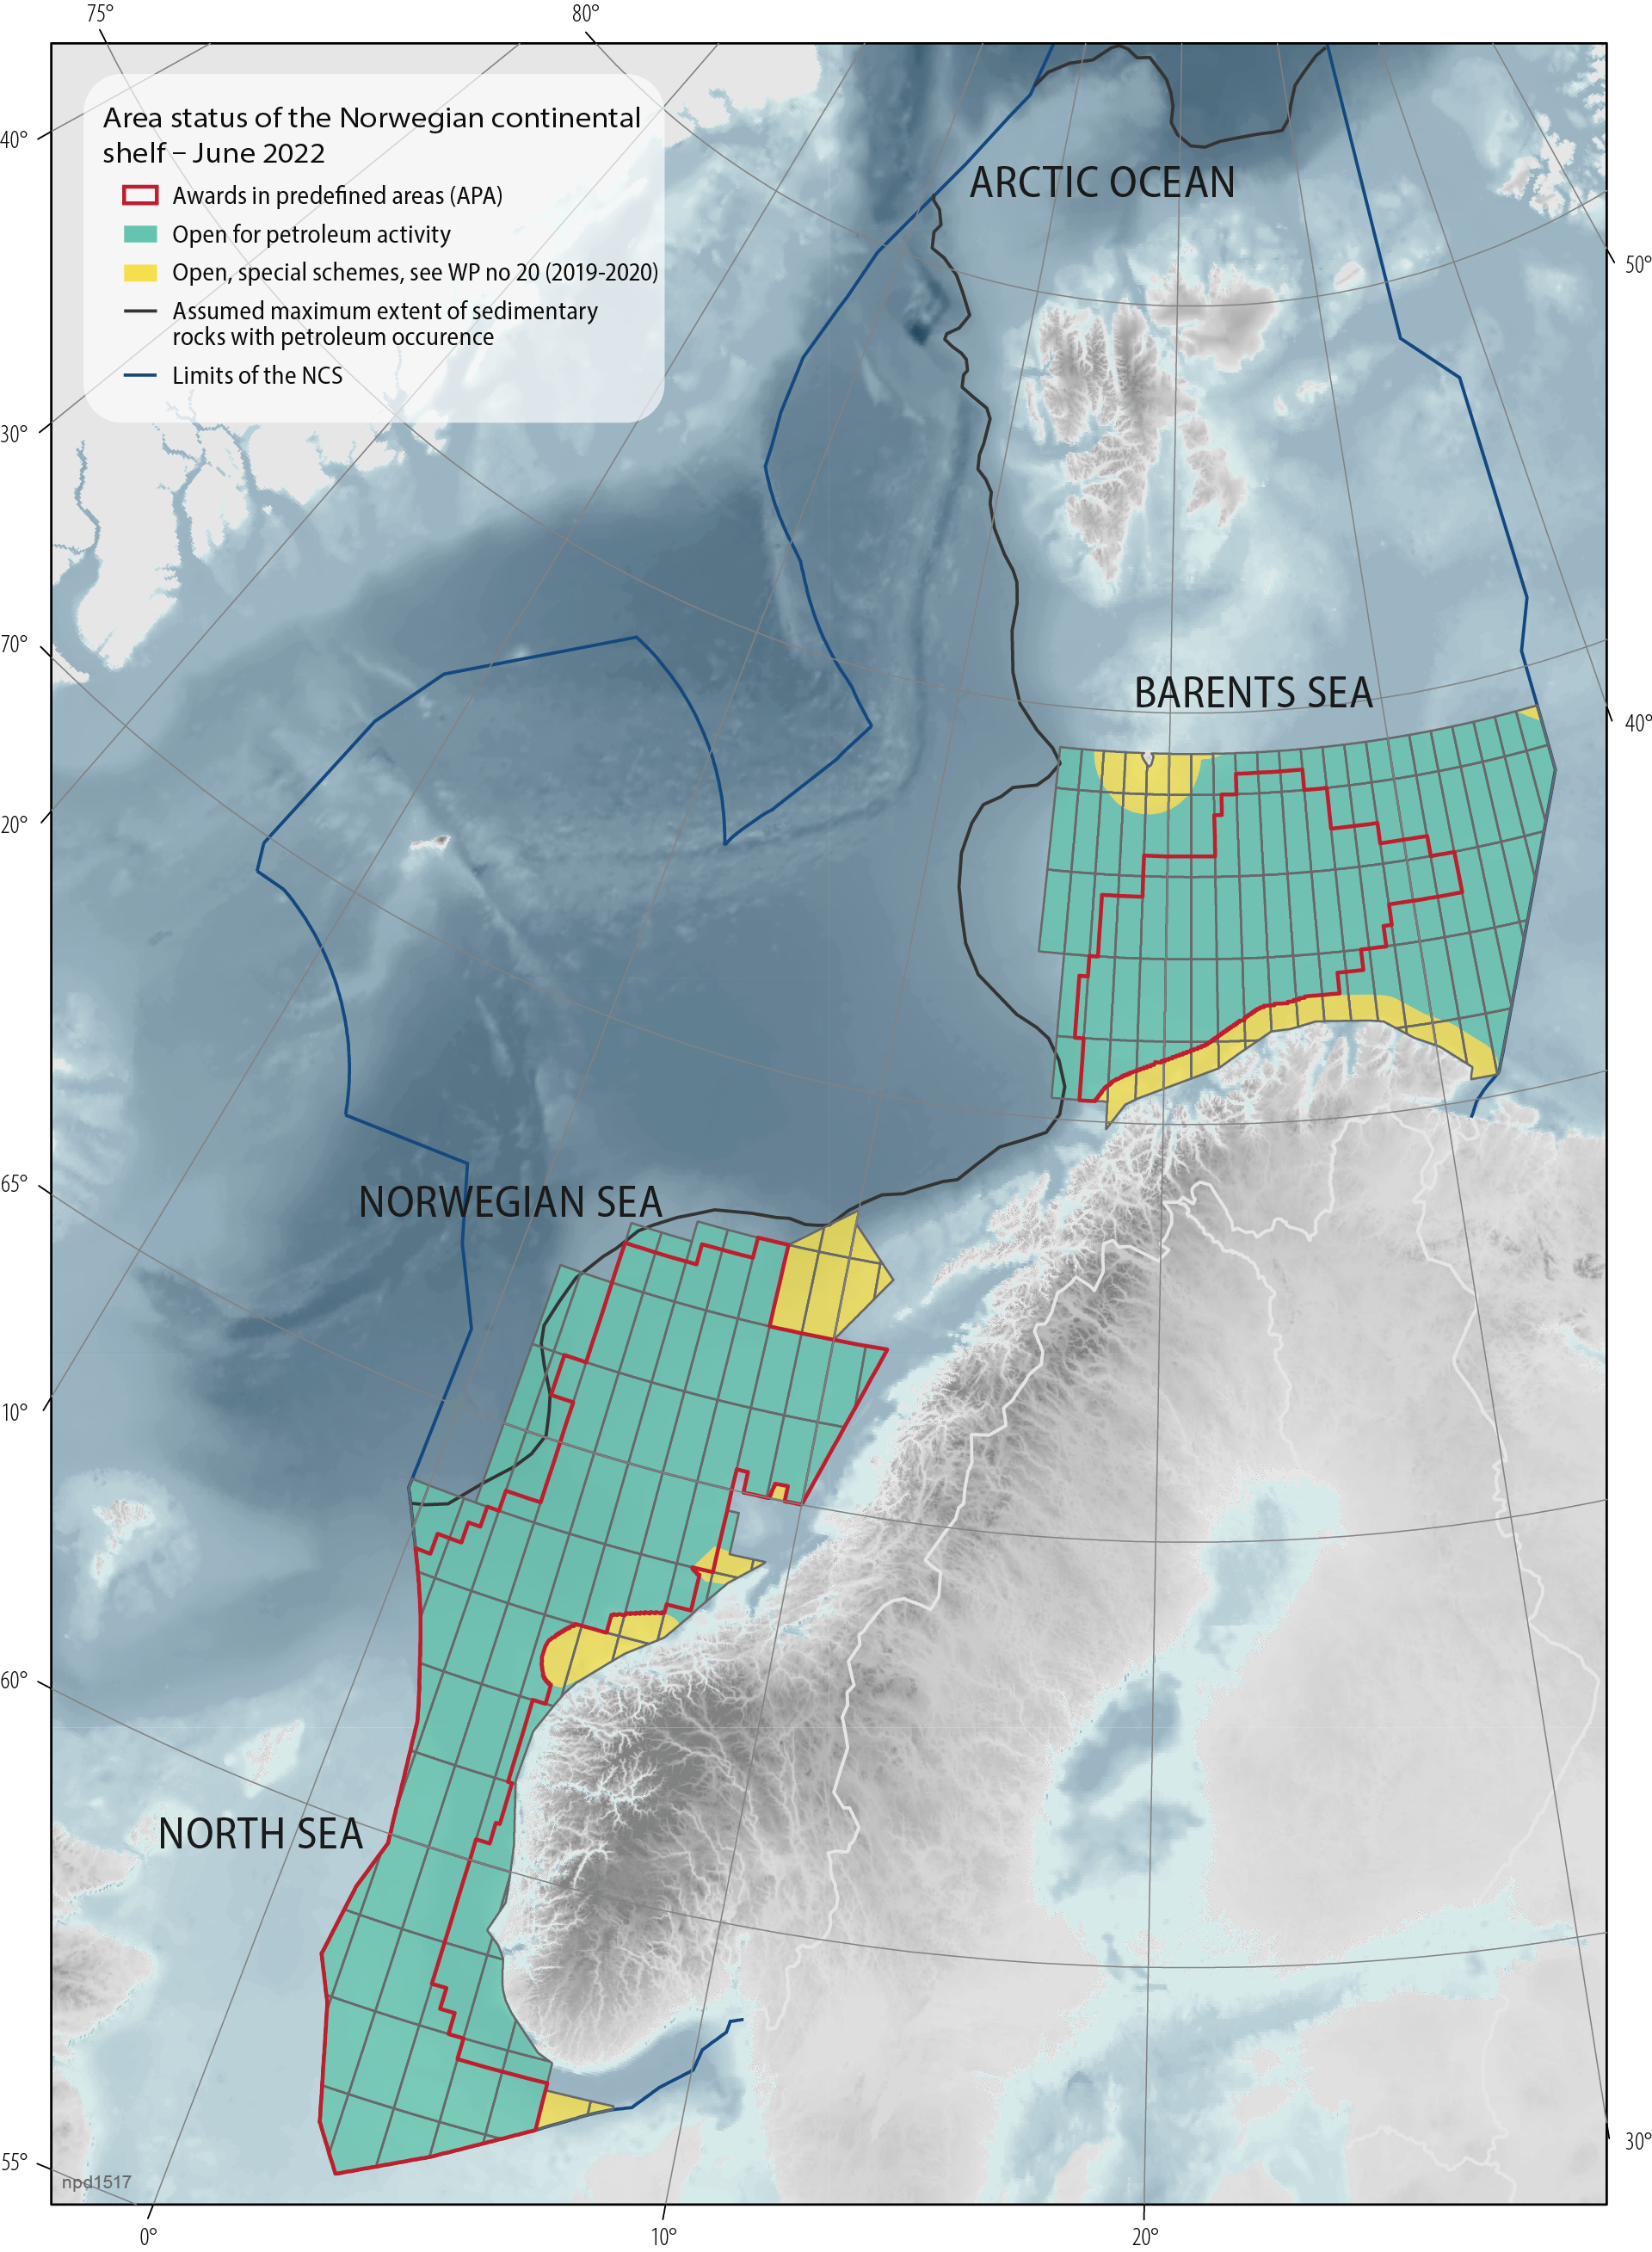
Figure 2.4 Opened and unopened areas on the NCS.
2.1 Undiscovered resources
Undiscovered resources are the quantities of petroleum estimated to be recoverable from deposits which have yet to be proven by drilling. Estimates for undiscovered resources in open areas are updated every other year with assessments of exploration results in the recent past, new mapping and new documentation. These estimates were last updated in the autumn of 2021 and published in the resource accounts at 31 December 2021.
The method for estimating undiscovered resources is described in the resource report for 2016 [4].
Uncertainty in the estimates is discussed in the fact boxes on Uncertainty in resource estimates and on Surprises.
Estimates have not been updated for the areas off Lofoten, Vesterålen and Senja or for Barents Sea North and the waters around Jan Mayen.

Figure 2.5 Distribution of undiscovered liquids and gas in the various NCS areas with the uncertainty range.
Fact box – Uncertainty in resource estimates
Being aware that unexpected outcomes may occur is in itself a form of knowledge
Substantial undiscovered resources remain on the NCS. The NPD expects them to comprise 24 per cent of total resources. Of this, 56 per cent are in opened areas, with the Barents Sea containing 26 per cent, the Norwegian Sea 13 per cent and the Norwegian Sea 17 per cent.
Substantial undiscovered resources remain on the NCS
Although the overall resource potential is somewhat larger in opened areas, the upside is greatest in the unopened part of the Barents Sea (Barents Sea North, Figure 2.6). Resources in the Lofoten, Vesterålen and Senja area are split in Figure 2.5 between the Norwegian Sea and Barents Sea South

Figure 2.6 Undiscovered resources in opened and unopened areas with the uncertainty range LoVeSe is an abbreviation for the areas off Lofoten, Vesterålen and Senja.
Historically, most of the resources have been discovered in the North Sea. Resource growth by NCS area demonstrates its uniqueness (fact box: The North Sea is unique and Figure 2.7). Undiscovered resources are expected to contain a preponderance of liquids in the North Sea, and to be equally divided between liquids and gas in the Norwegian Sea.
The potential for discovering gas is greatest in the Barents Sea
The potential for discovering more gas on the NCS is greatest in the Barents Sea, and divided fairly equally between south and north (Figure 2.5). Uncertainty is greatest in Barents Sea North, as reflected in the wide range between the high and low estimates.

Figure 2.7 Total resources by NCS area.
Fact box – The North Sea is unique
North Sea
Estimated undiscovered resources in the North Sea amount to 640 million scm oe, which breaks down as 410 million scm oil and condensate and 230 billion scm gas. That represents a four per cent decline from the year before for both liquids and gas. This reduction is smaller than the quantity of resources proven by exploration since the previous estimate.
The play with the biggest resources in the North Sea, both discovered and undiscovered, lies in the northern section of the Viking Graben and adjacent terraces. It extends from about 60°N to 62°N (Figure 2.9).
Reservoirs in the play are sandstones ranging from Late Triassic to Middle Jurassic in the Hegre to Brent Groups.
Almost 240 wildcats have been targeted at this play, with a technical success rate of about 60 per cent. These wells have collectively proven about 3 500 million scm oe, about three-quarters being liquids. Some the biggest NCS discoveries are in this play, including Statfjord, Oseberg and Gullfaks (Figure 2.8).

Figure 2.8 Creaming curve for the North Sea Creaming curve for the Late Triassic-Middle Jurassic play (Hegre to Brent Groups) in the northern North Sea.

Figure 2.9 Play with the largest resources in the North Sea The contour shows the extent of the play, circles indicate which wells have tested the play and which are discoveries.
Over the past 10 years, some 100 million scm oe has been proven in this play. Roughly 60 per cent are liquids (Figure 2.10). The average discovery size during the period was about 2.9 million scm oe and
the technical success rate was 65 per cent. Estimated undiscovered resources in the play have an expected value of some 200 million scm oe. Although the possibility of larger ones cannot be excluded, most discoveries in the play are expected to be relatively small. The estimate for undiscovered resources includes an expectation of an average future discovery size of 2.5 million scm oe.

Figure 2.10 Creaming curve past 10 years Creaming curve for the Late Triassic to Middle Jurassic play (Hegre to Brent Groups) in the northern North Sea.
Success rates for Jurassic plays in the Norwegian North Sea below 60°N are strikingly poorer than above that latitude (Figure 2.11). These plays have been the target for 58 wildcats drilled over the past 10 years, with only 15 discoveries made. That represents a success rate of 26 per cent, compared with 58 per cent in the northern part of the North Sea. The average discovery size is almost identical for the two areas, at 3.1 million scm oe. Figure 2.11 also shows a declining trend for both success rates and average discovery sizes compared with the previous decade. In all, Jurassic plays in the southern area have yielded about 45 million scm oe. Liquids account for roughly 60 per cent (Figure 2.12)

Figure 2.11 Success rates the past 10 years Success rates for Jurassic plays in the North Sea. The north-south boundary is 60°N.

Figure 2.12 Creaming curve for the southern North Sea the past 10 years Curve for Late Triassic-Jurassic plays (Hegre-, Statfjord-, Vestland- og Tyne Groups).
No resources have been proven in Cretaceous plays in the southern area, with the Hod, Tor and Ekofisk Formations as reservoirs, since the late 1990s. The last discovery of any size was Tommeliten Gamma in 1978, with about 15 million scm oe. Since then, the 36 wildcats drilled have proven less than five million scm oe in three small discoveries.
Norwegian Sea
Estimated undiscovered resources in the Norwegian Sea amount to 750 million scm oe, which breaks down as 365 million scm liquids and 385 billion scm gas. That represents a rise from previous years of 22 per cent for liquids and five per cent for gas, and 13 per cent overall. Involving Early Cretaceous and Late Triassic to Middle Jurassic plays in more mature parts of the Norwegian Sea, the increase reflects the exploration success of recent years in this area.
The average discovery size in the Norwegian Sea has risen over the past five years and is now 6.2 million scm oe. Resource estimates for this part of the NCS also include the unchanged volumes in the unopened areas off Lofoten and Vesterålen and in the waters around Jan Mayen, which account for about 33 per cent of the total.
As in the North Sea, the Norwegian Sea has one dominant play. This extends across the Halten and Dønna Terraces along with parts of the Nordland Ridge and the Revfallet Fault Complex. Reservoirs in the play are sandstones from the Late Triassic to the Middle Jurassic in the Båt and Fangst Groups (Figure 2.13).

Figure 2.13 Play with the biggest potential in the Norwegian Sea The contour shows the extent of the play, circles indicate which wells have tested the play and which are discoveries.
About 160 wildcats have tested the play and the technical success rate has been 52 per cent. These wells have proven about 1 500 million scm oe, with 57 per cent being liquids (Figure 2.14). More than 80 million scm oe have been proven in this play over the past 10 years, with some 56 per cent being liquids.
The average discovery size has been 3.2 million scm oe, while the technical success rate is 63 per cent. Estimated undiscovered resources in this play amount to roughly 210 million scm oe, with 52 per cent being liquids. Although most of the future discoveries in the play are expected to be small, exploration in recent years shows that larger ones can be made – such as 6507/5-10 S (Slagugle).

Figure 2.14 Creaming curve for Norwegian Sea Creaming curve for Late Triassic to Middle Jurassic plays (Båt and Fangst Groups).
Barents Sea
Estimated undiscovered resources in the Barents Sea amount to 2 400 million scm oe, which breaks down as 1 280 million scm liquids and 1 120 billion scm gas. That represents a decrease of four per cent for both liquids and gas from the year before. This reduction relates in its entirety to Barents Sea South, where it amounts to 11 per cent for liquids and eight per cent for gas. To a great extent, the decline concerns Triassic plays in the eastern part of the area.
Exploration results in the Barents Sea during recent years have been disappointing, with an average discovery size of 3.9 million scm oe. That is the main reason for the downward adjustment. The corresponding figure for the previous period was 10.6 million scm oe.
Unopened areas of the Barents Sea have the highest probability of large
new discoveries
Fifty-nine per cent of resources in the Barents Sea lie in areas which have not been opened for petroleum activities, mostly in Barents Sea North. That area has the highest probability of making large new discoveries on the NCS.
The biggest play in terms of resources in Barents Sea South extends over much of the Barents Sea (Figure 2.15). The expected value for this play is about 220 million scm oe, with 60 per cent being liquids.

Figure 2.15 Extent of the Early to Middle Jurassic play The contour shows the extent of the play, circles indicate which wells have tested the play and which are discoveries.
Reservoirs in the play are in the Early to Middle Jurassic and include the Kapp Toscana Group with the Tubåen, Nordmela, Stø and Fruholmen Formations. The most important source rock is Early- Middle Triassic (the Steinkobbe Formation). A critical factor in the play is the presence of cap rocks which provide sufficient sealing and retention. The whole area has been subject to tilting and reactivation of faulting. In addition, Cenozoic uplift and erosion create an increased risk of leakage, particularly for shallow and truncated structures.
Only 24 wildcats have been drilled in the play, with eight discoveries. That represents a technical success rate of about 33 per cent. The bulk of the undiscovered resources in the play are expected to be in its western part, where the probability of discovering liquids is also far higher. This is primarily because of a much lower probability of oil-generating source rocks to the east. Possible gas deposits in the latter part of the play lie at shallow depths and the recoverable quantities are therefore limited. By far the biggest discovery is 7324/8-1 (Wisting), with 78.2 million scm of oil and 3.9 billion scm of gas (Wisting including the 7324/8-1 and 7324/7-2 wells).

Figure 2.16 Creaming curve for Barents Sea Creaming curve for the Early to Middle Jurassic play (Tubåen, Nordmela, Stø and Fruholmen Formations).
Ninety-four million scm oe has been proven in the play (Figure 2.16). Liquids account for about 90 per cent. Discovery sizes have varied considerably, with the average of about 12 million scm oe strongly influenced by the Wisting discovery.
Figure 2.17 presents an overview of primary targets reported for wildcats in 1990-2021. Forty-five per cent of the wells were primarily targeted at Jurassic reservoirs, which include the Tubåen, Nordmela, Stø and Fruholmen Formations (mainly the Stø Formation). By comparison, only one well had the Early Triassic play (Havert Formation) as its primary target.

Figure 2.17 Exploration targets Primary exploration targets during 1990-2021 in the Barents Sea.
Fact box – Exploration activity and results over the past decade
2.2 Discoveries
At 31 December 2021, 88 discoveries (RC4F, RC5F and RC7F, Figure 1.4) on the NCS were under consideration by the licensees for development (Figure 2.20).
These amount to 666 million scm oe, which breaks down into 359 million scm liquids and 307 billion scm gas.
Of the 88 discoveries, 47 with a total of 299 million scm oe are located in the North Sea, 26 with a total of 211 million scm oe in the Norwegian Sea and 15 with a total of 157 million scm oe in the Barents Sea (Figure 2.20).
The discovery portfolio represents 16 per cent of the remaining proven resources. Twenty-nine discoveries are in the planning phase for production (RC4), and account for 60 per cent of resources in the portfolio. The NPD expects plans for development and operation (PDOs) of a number of these discoveries to be submitted in 2022.
Figure 2.20 presents the discovery portfolio in the resource accounts by size per NCS area. The largest discovery, 7324/8-1 (Wisting), is in the Barents Sea, with 6406/9-1 (Linnorm) and 30/11-8 S (Krafla) as the biggest in the Norwegian and North Seas respectively.

Figure 2.20 Discoveries by NCS area.
Plans call for 83 of the discoveries in the portfolio (Figure 2.21) to be tied back to established infrastructure. In some cases, new infrastructure is planned in coordination with other discoveries in an area. The five discoveries being considered for development with production facilities (featuring separation and process equipment) depend on relatively large resources or coordinated development with smaller discoveries to be profitable.

Figure 2.21 Probable development solutions for the discovery portfolio.
Discoveries unlikely to be produced (RC6)
In the NPD’s resource classification system, discoveries where production is unlikely are placed in resource class 6 (RC6, Figure 1.4). These are assessed as unprofitable today because they are too small, require the development of new technology or lack access to infrastructure.
RC6 contains 168 discoveries, including 90 in the North Sea, 45 in the Norwegian Sea and 33 in the Barents Sea (Table 2.1). They are divided almost equally between oil and gas discoveries.

Table 2.1 Discoveries in resource class 6 at 31 Dec 2021.
It is important that these are not written off, since technological advances, available infrastructure, coordination and changes in market conditions could make their development relevant. Certain of them might become commercial if new discoveries in the vicinity offer the possible basis for a coordinated development (chapter 3.2 Assets in the discovery portfolio). New technology or infrastructure could move discoveries out of RC6.
Almost 70 per cent of the discoveries are located in licensed acreage. Those in relinquished areas can be made available to the industry through licensing rounds.
2.3 Fields
Since petroleum production began on the NCS more than 50 years ago and up to 31 December 2021,
5 218 million scm of liquids and 2 798 billion scm of gas have been sold and delivered (fact box Gas production). Figure 2.22 shows how this breaks down between the NCS areas.

Figure 2.22 Gas and liquid volumes produced at 31 December 2021.
At 31 December 2021, 94 fields were producing on the NCS. Five came on stream in 2021 – Duva, Martin Linge, Solveig, Yme and Ærfugl North. Troll phase 3, a large project for improved recovery from a producing field, also came on stream.
Eight PDOs were submitted to the government. The biggest projects are Tommeliten A, Ormen Lange phase 3, Troll West electrification (TWEL) and the Oseberg gas capacity upgrade and power from shore project (OGP). No fields ceased production in 2021. The Knarr and Veslefrikk fields had ceased producing by 31 May 2022
The North Sea is the area which has yielded the largest quantity, produced for longest, and possesses the largest remaining resources in fields and discoveries. Reserves total 1 885 million scm oe in the North Sea, while they amount to 466 million scm oe and 277 million scm oe in the Norwegian and Barents Seas respectively.
Fact box – Goal of reserve growth
2.4 Improved recovery
A potential exists for improving recovery from fields. Figure 2.26 presents oil volumes produced and sold from the 25 largest oil fields (grey columns), the volume remaining to be produced under plans currently sanctioned (dark green columns), and the volume which will be left behind under current plans (light green columns).
The resource accounts for 2021 include 184 specific but unsanctioned projects for improved oil and gas recovery (IOR). Figure 2.25 presents these broken down by project type, with associated resources in oe.
IOR projects primarily involve production wells (wells), in terms of both number (75) and volume (about 130 million scm oe).
Other projects which could help improve recovery are late life production (24 with about 60 million scm oe) and low pressure production (28 with about 58 million scm oe).
Few measures have been identified where new injection and advanced methods (enhanced oil recovery – EOR) are adopted to improve recovery (13 totalling about 10 million scm oe). In addition, 27 projects are identified as further development. This could help to extend a field’s producing life, particularly by phasing in new discoveries (almost 100 million scm oe).

Figure 2.25 Specific projects for improved recovery from fields, number and resources.
In addition to the projects reported by the companies, the NPD has identified a substantial resource potential related to adopting EOR methods (Figure 2.27). The figure presents the potential for specific EOR methods summed for 27 discoveries and fields (described in more detail in the resource report for 2019, [6]).
Despite the big resource potential, few projects are being assessed by the companies – as Figure 2.25 shows.

Figure 2.26 Oil reserves and resources for the biggest oil fields.

Figure 2.27 Increased potential for oil with EOR methods on the NCS.
Measures to improve recovery from fields could also include starting production from reservoir zones which have not previously been considered producible in a profitable manner. These might be, for example, tight formations or injectites (fact box Injectites). Tight formations have poorer quality and require different types of wells and completions to achieve profitable production. Examples of such solutions include slim hole technology (chapter 3.5 Technology development and expertise) and hydraulic fracturing.
Reservoirs with injectites have long been difficult to understand because mapping their extent is challenging. That has thereby made it difficult to place the wells in a good way. Understanding has increased considerably in recent years, largely because of big advances with seismic imaging and geological modelling. Progress also made in drilling and completion technology makes it more attractive to develop injectite deposits.
Improved understanding of aquifers has become increasingly important in mature areas (fact box Aquifers). A number of initiatives are under way on constructing aquifer models. With its unique access to NCS data, the NPD is well placed to produce holistic models. It is pursuing an internal modelling project of the aquifers around Frigg-Heimdal at the Palaeocene- Eocene level and around Troll at the Jurassic level. These aquifer models will be made as accessible as possible to the industry and academia, so that the players can combine them with detailed modelling of the individual field.