3 – Competition and value creation
Exploration for and production of oil and gas have provided huge value for Norwegian society. The petroleum sector is Norway’s largest industry by value creation, government revenues, investment and export value. Timely exploration and development are important for ensuring good resource management.
A competitive continental shelf is a precondition for maintaining value creation. Indicators such as unit costs and CO2 intensity (emissions per unit produced) provide a good basis for assessing the competitiveness of the NCS.
The NCS is a capital-intensive petroleum province where exploration and development costs are higher in relative terms than operating expenses [8].
With relatively high exploration and development costs, the competitiveness of the NCS will come under pressure if resource growth slows even further. Falling production from a number of fields means that total operating expenses per unit produced rise and thereby weaken competitiveness. Measures to increase resource growth and exploit capacity in the infrastructure will be important in the future.
Measures to increase resource growth and exploit capacity in the infrastructure will be important in the future
Remaining resources on the NCS have a low CO2 intensity compared with other petroleum provinces. Analyses also show that Norwegian gas sales to Europe have the lowest climate footprint per unit compared with other exporters [9]. Important reasons for the relatively low CO2 intensity include the provision of power from shore to a number of facilities, as well as the government ban on production flaring and the introduction of a CO2 tax as early as 1974 and 1991 respectively.
Although several measures are being initiated to cut emissions, CO2 intensity may increase if transport and processing capacity is not matched to reduced production on the fields. This trend can be countered by phasing in new discoveries, by reducing the water cut through better drainage solutions, or by water separation downhole or on the seabed.
Norway’s biggest industry
The petroleum sector is the biggest industry in Norway measured by value creation, government revenues, investment and export value. It is expected to account for 28 per cent of gross domestic product (GDP) and 58 per cent of Norwegian exports in 2022 (Figure 3.1, [1]).
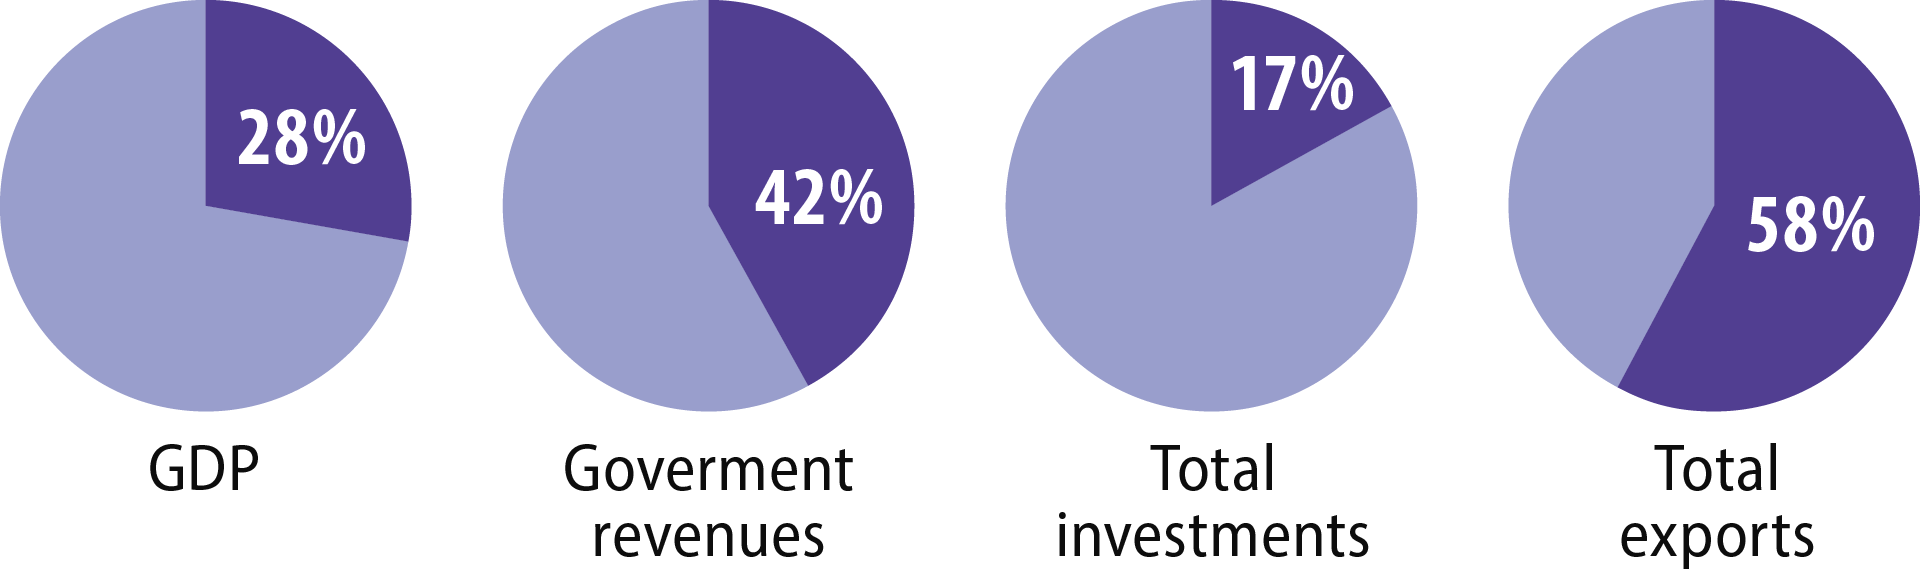
Figure 3.1 The petroleum sector’s share of value creation, 2022 estimate Source: Ministry of Finance, 2022.
According to Statistics Norway (SSB), the export value of crude oil in 2021 was NOK 349.6 billion, compared with NOK 207.8 billion the year before. The value of natural gas exports came to NOK 475.8 billion, more than four times the 2020 level [10].
About 200 000 people nationwide were employed by the petroleum industry in 2020. Almost 165 000 of these related to activities on the NCS. Some 35 000 people were employed in exports to the international petroleum industry [11].
Welfare for generations
The high level of earnings in 2021 yielded NOK 287.5 billion in government revenues, or about 20 per cent of the total. This figure is expected to reach NOK 960 billion in 2022, or more than 40 per cent [1] of the total.
Government revenues from petroleum make this sector a key contributor to financing the welfare state. The state’s net cash flow from petroleum operations is transferred in its entirety to the government pension fund global (the oil fund), to ensure that these revenues benefit both present and future generations. The fund had a market value at 31 December 2021 of more than NOK 12 000 billion [12].
Important for Norway’s economy
Investment in the petroleum sector accounted for 18 per cent of total capital spending in Norway for 2021 [1]. However, it has declined somewhat over the past two years after rising in 2019. Reporting by the companies indicates that investment will also fall in 2022 but increase thereafter. That is because many investment decisions have been and will be taken on profitable projects, in part thanks to the temporary changes to the petroleum tax regime. Overall investment in the petroleum sector over the next few years will be on a par with the period after 2015. Figure 3.2 presents investment in fields and discoveries as well in exploration, plus forecasts for the next five years.
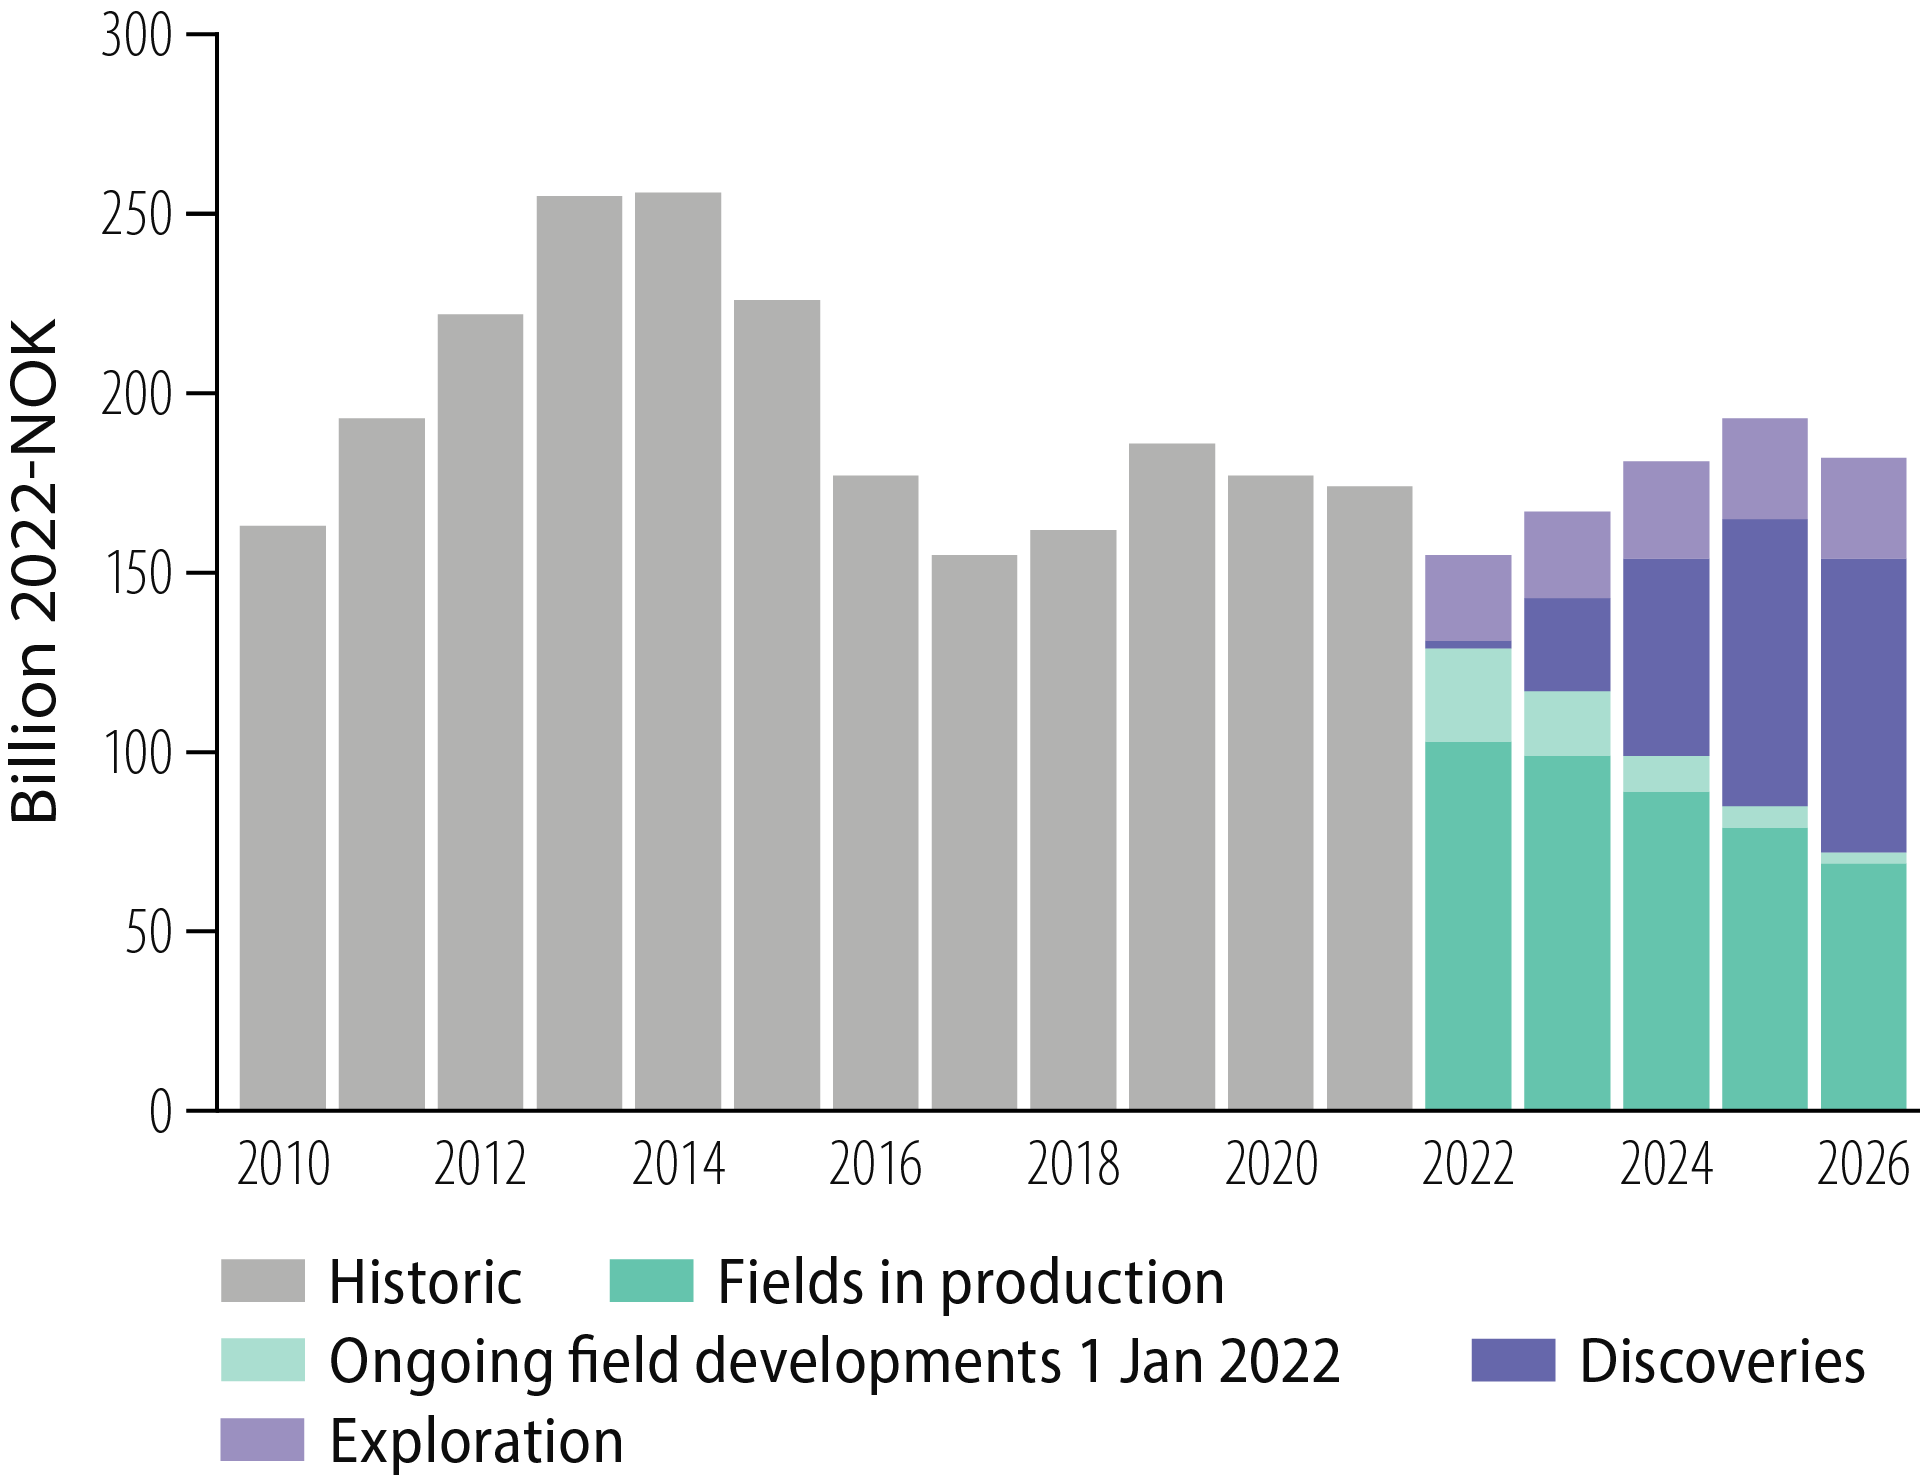
Figure 3.2 Investment on the NCS from 2010, with forecasts to 2026.
3.1 Profitability of exploration
Successful exploration is a precondition for long-term production and export of petroleum. The NPD’s analyses show that exploration for oil and gas over the past 20 years has been profitable in all NCS areas and has contributed great value to society.
Successful exploration is a precondition for long-term petroleum production and export
Methods and preconditions
The profitability of exploration is defined as calculated revenues from the discoveries made during the period, less all costs. The latter encompass exploration which has yielded discoveries or has failed discounted to the same year. Profitability calculations do not include indirect economic effects or spin-offs for the rest of the economy.
More than 80 per cent of the resources discovered over the past two decades have yet to be produced. Great uncertainty attaches to the profitability estimates, owing to uncertainties over future prices, production profiles, the resource estimates and costs. Assumptions about future oil and gas prices accord with those applied in the revised national budget (RNB) for 2022. Historical prices for oil and gas have been applied for the pre-2022 period [13].
Investment in exploration and resource growth
A total of 813 exploration wells (including 249 for appraisal) were spudded in 2002-21, with about NOK 550 billion (2022 value) invested in exploration (Figure 3.3).
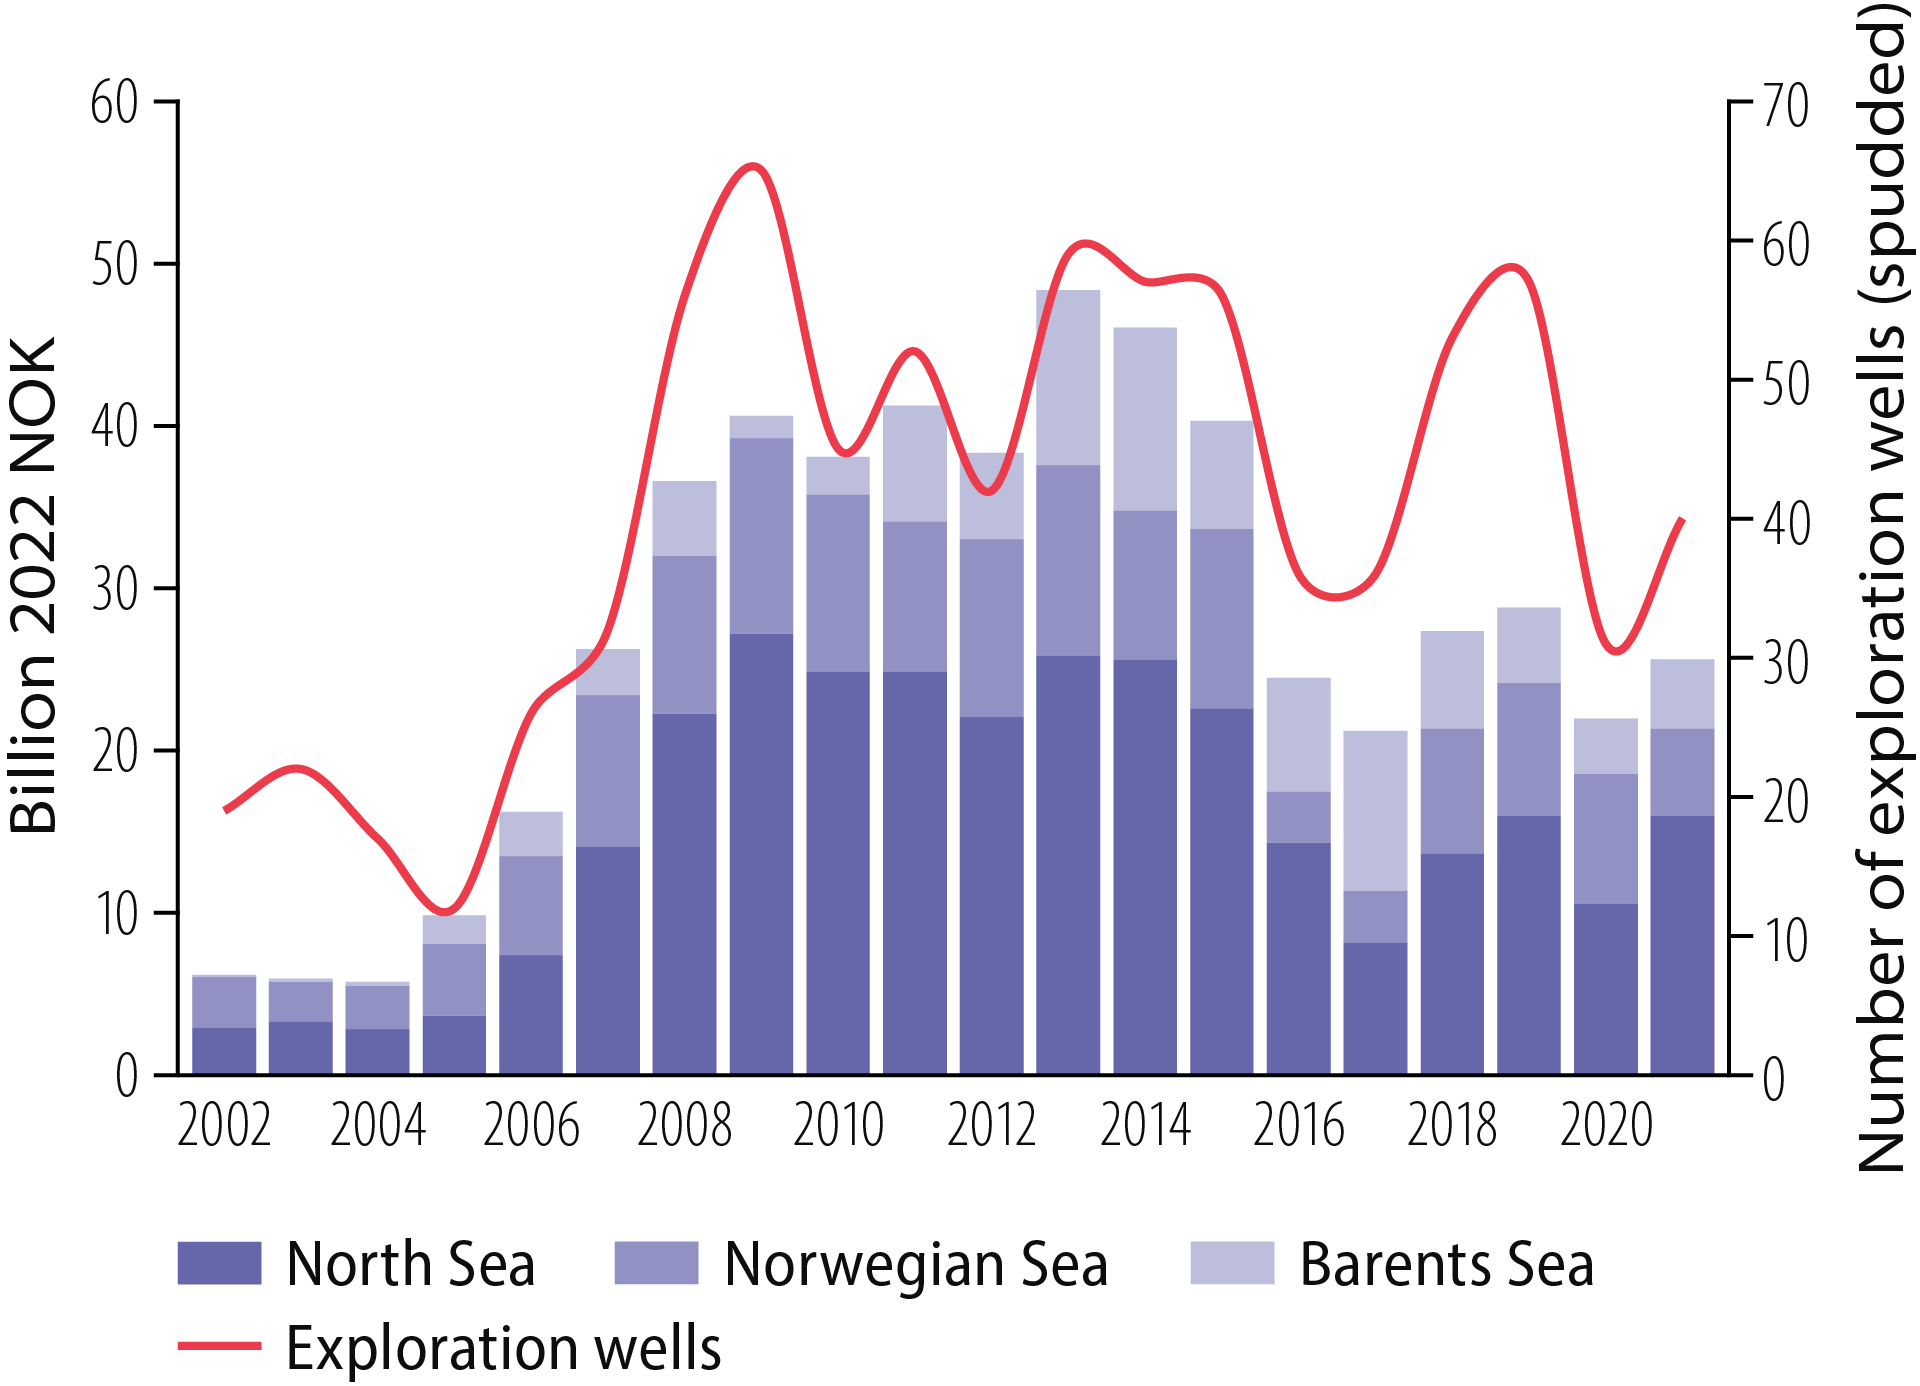
Figure 3.3 Exploration costs and wells, 2002-21.
Exploration activity during this period resulted in almost 300 discoveries and a total growth of about 1 900 million scm oe in resources (Figure 3.4). Of these, 190 discoveries totalling 1 600 million scm oe are included in the profitability calculations. Discoveries not included are mainly categorised as RC6 (chapter 2.2 Discoveries).
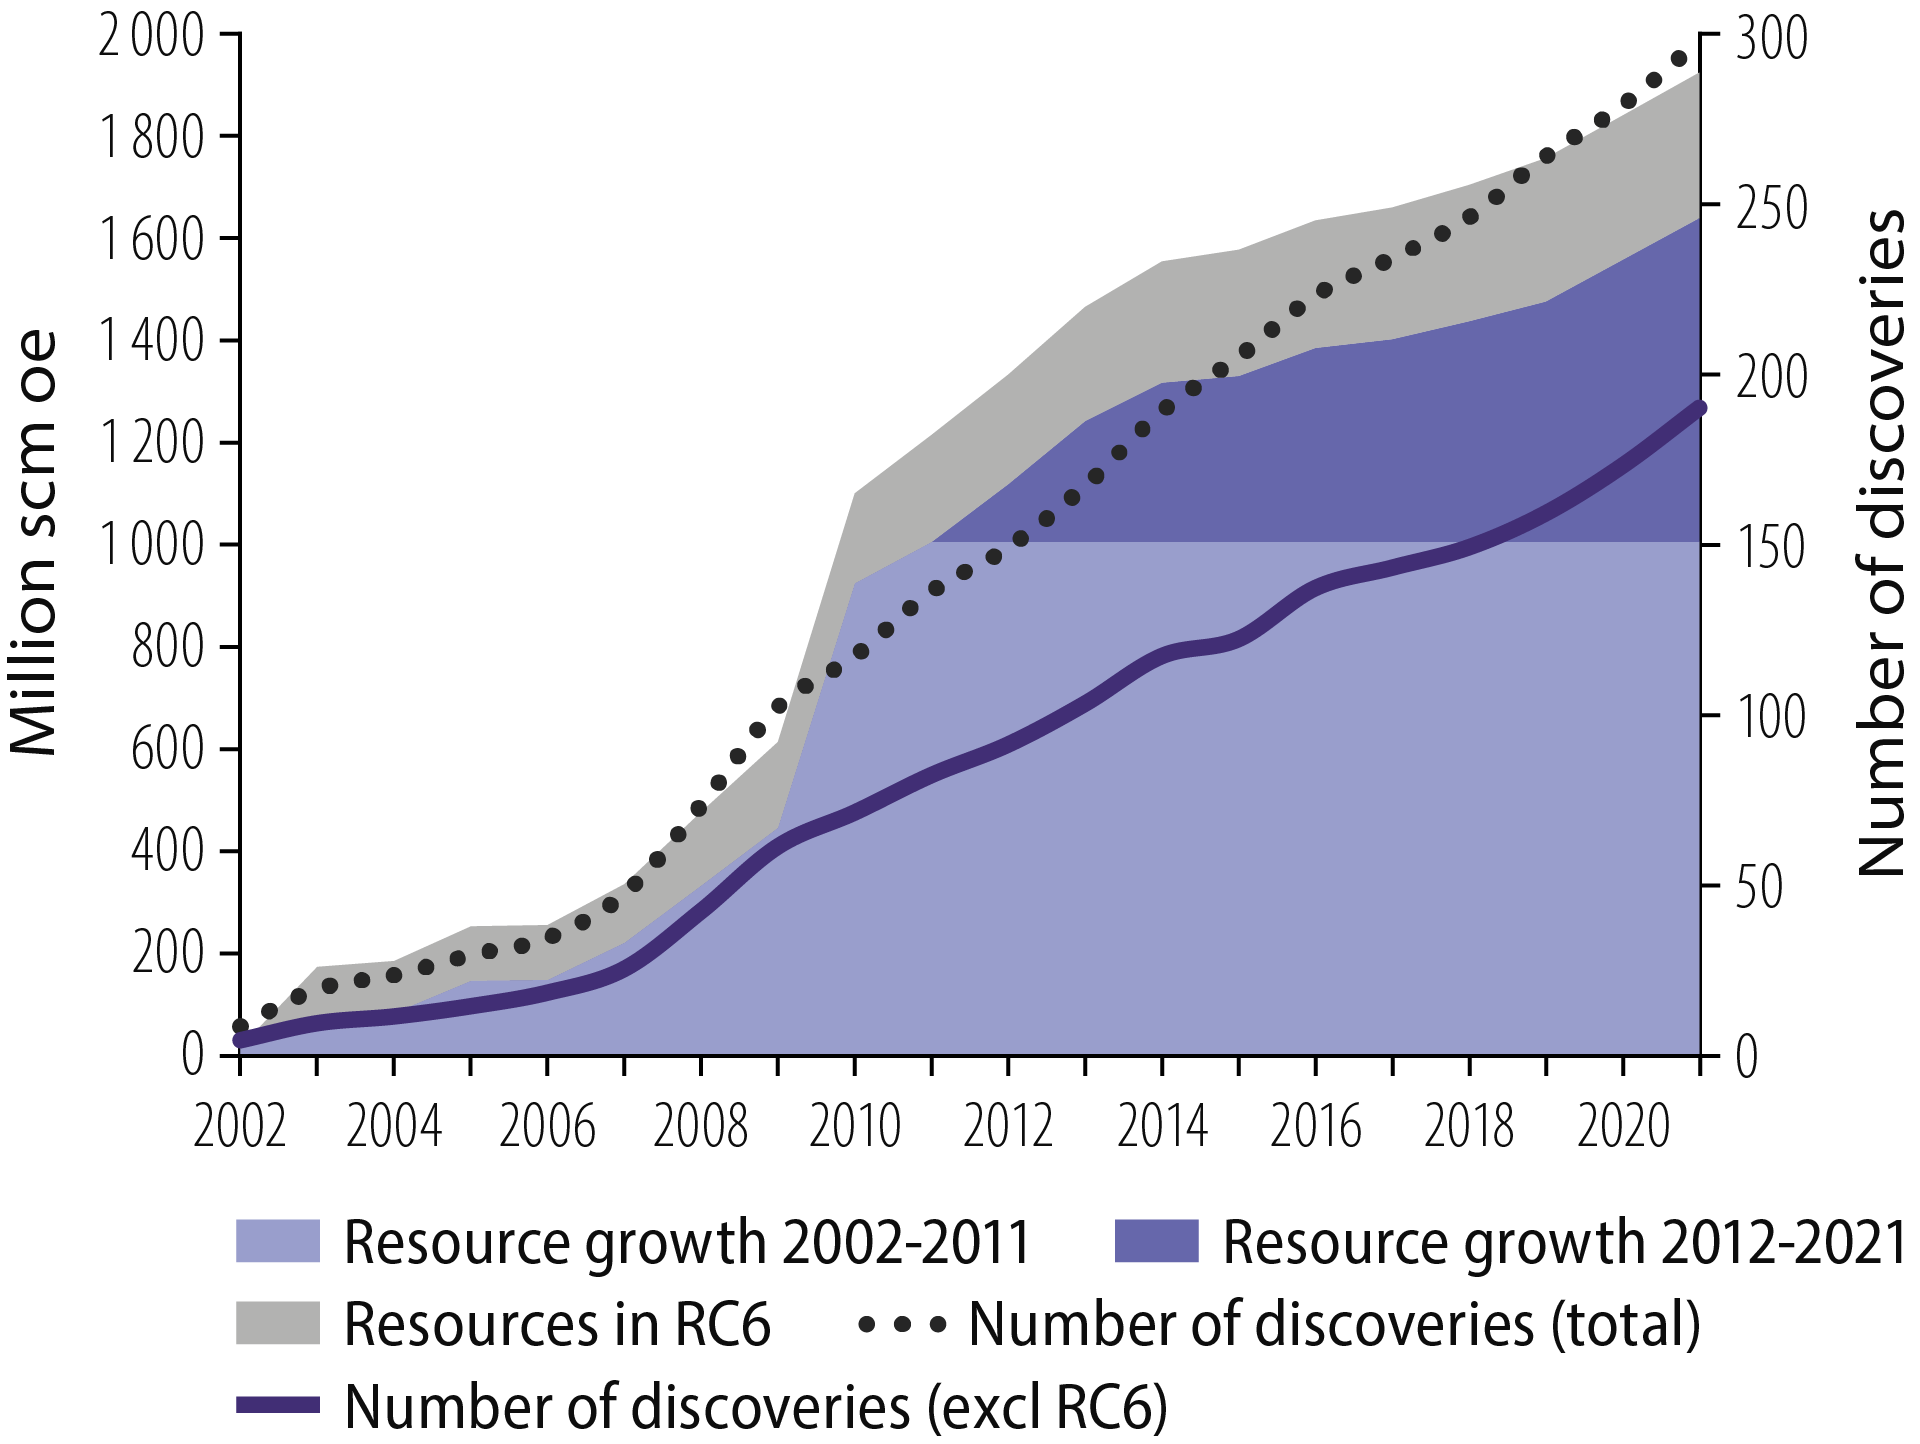
Figure 3.4 Discoveries and resource growth, 2002-21.
Figure 3.4 shows that resource growth was greatest in the first half of the period. About 60 per cent of the growth took place from 2002 to 2011, and 40 per cent from 2012 to 2021. The period was characterised by few and large discoveries in its first half and many small ones in the second decade.
Eight of the 10 largest discoveries in the period were made in the first decade. These include 16/1-8 Edvard Grieg (2007), 16/1-9 Ivar Aasen (2008) and 16/2-6 Johan Sverdrup (2010). The last of these was by far the biggest discovery in the analysis period and accounts alone for about 25 per cent of the resources covered by the analysis.
Value creation from exploration in the past 20 years
The overall NPV of exploration over the past 20 years is estimated to be about NOK 1 500 billion and NOK 2 100 billion with discount rates of seven and four per cent respectively. Overall net cash flow is estimated at more than NOK 3 000 billion (Figure 3.5).
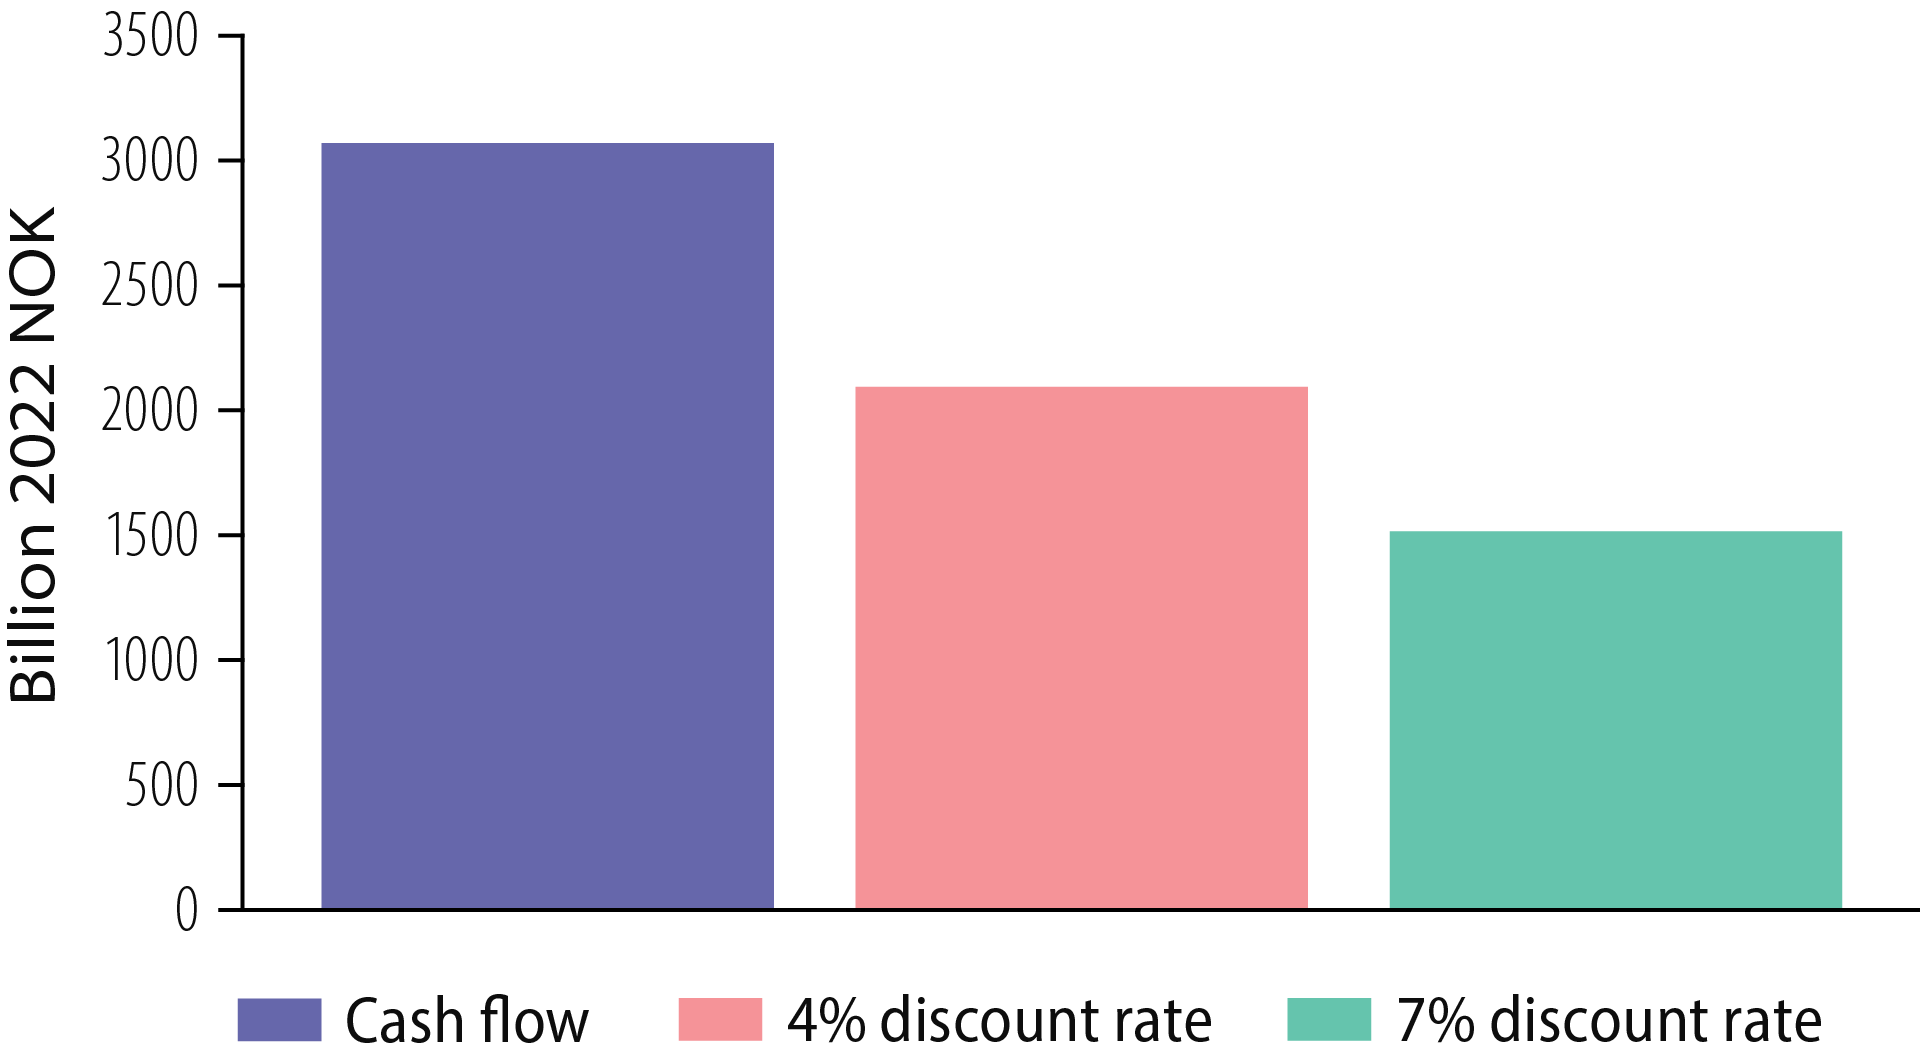
Figure 3.5 Profitability of exploration in the past 20 years.
High resource growth and a number of big discoveries in the first 10 years of the analysis period contributed higher value creation than in the second decade. Exploration costs were high during 2012-21, while resource growth was relatively low.
A number of small discoveries in this period led to many profitable developments. Although these provide considerably lower present value than the big discoveries in the previous period, they contribute to a positive return from exploration over the past 10 years.
Exploring for oil and gas over the past 20 years has provided enormous value for
society
Figure 3.6 shows that each krone invested in exploration on the NCS in the past two decades yielded a return of roughly NOK 2.40. Each krone invested in exploration over the past 10 years gave a return of about NOK 1.10. The good exploration results over the past five years yielded a return of roughly NOK 1.60. These results exceed a seven per cent return.
The NPD's calculations show that exploration activity has been profitable in all NCS areas. Some two-thirds of the overall revenues from discoveries made over the past 20 years come from the North Sea, while roughly a third is split more or less equally between the Norwegian and Barents Seas.
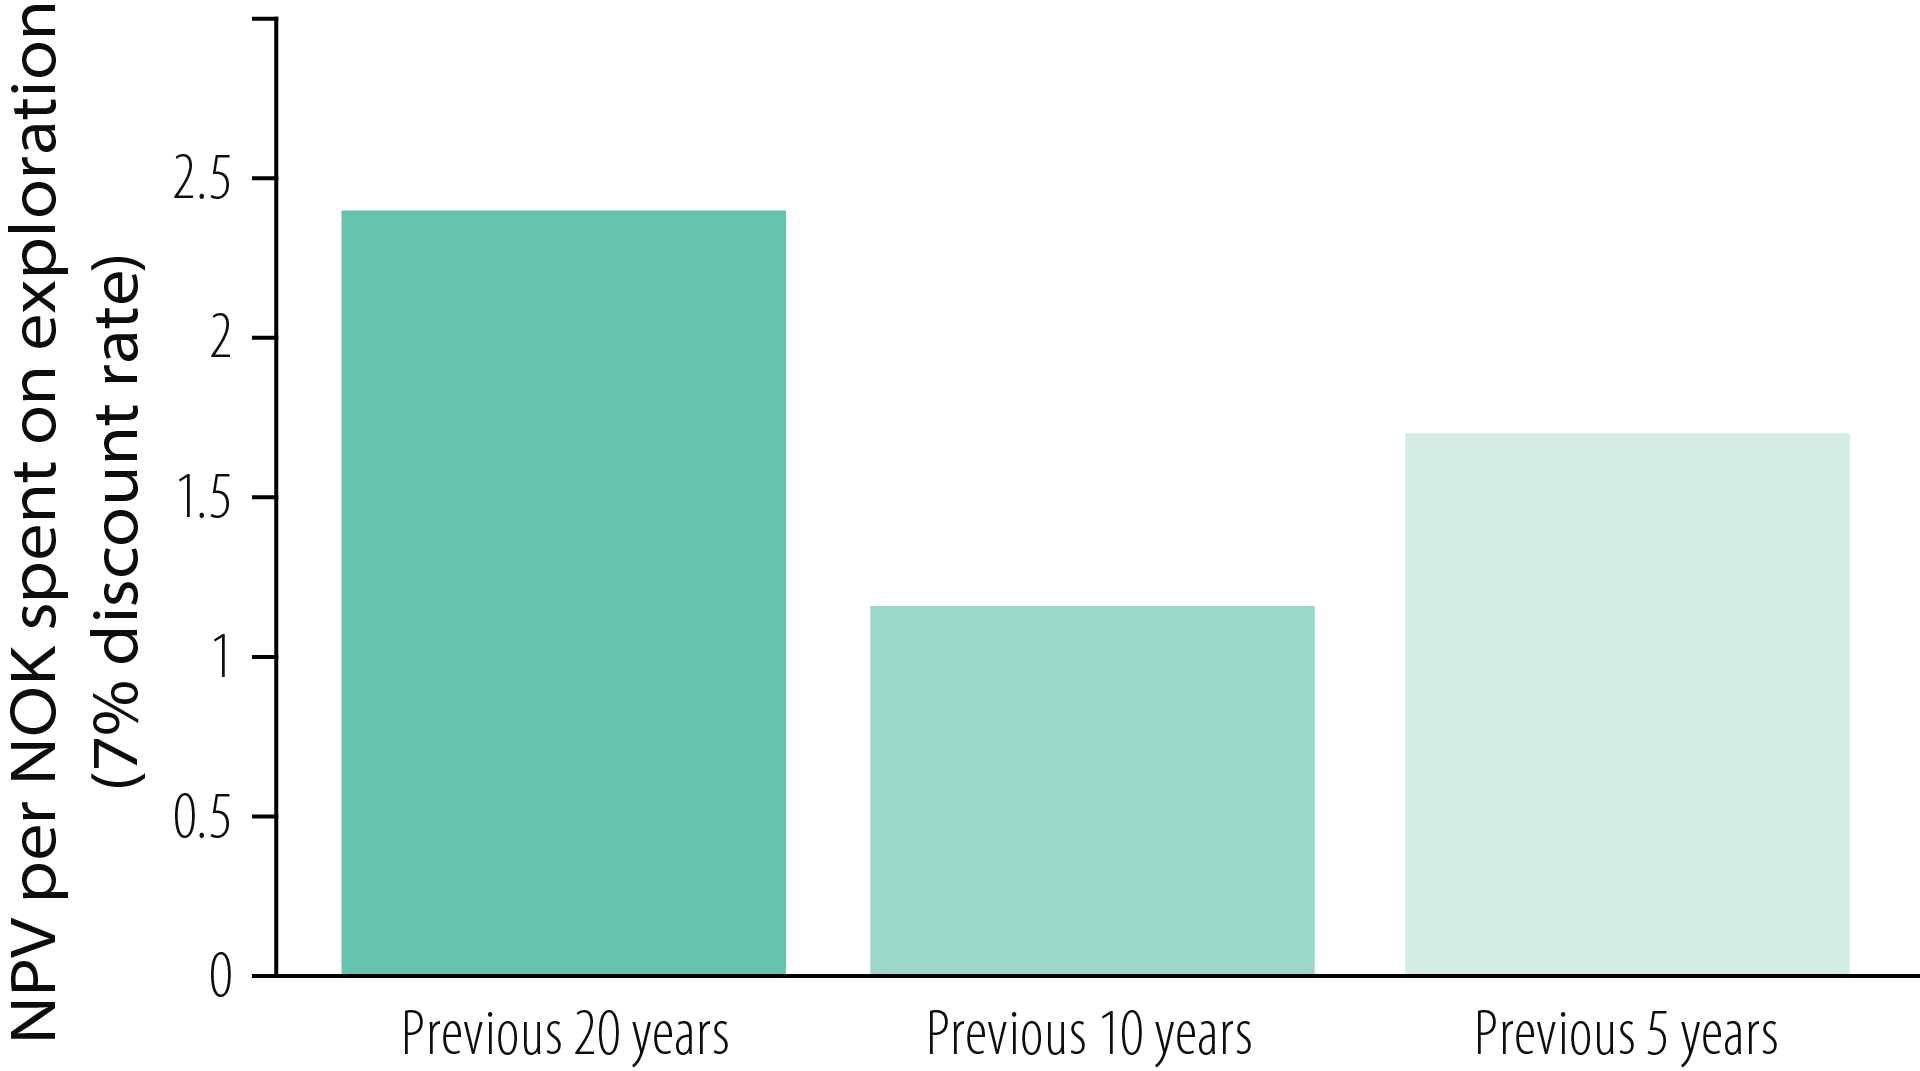
Figure 3.6 Profitability per exploration krone.
Unit costs
Unit costs are undiscounted and defined as total costs per unit of oe produced from the period. They differ between projects and depend on such factors as discovery size, type of phasing-in, reservoir quality and distance to infrastructure. Unit costs for discoveries over the past 20 years average about USD 25 per barrel (Figure 3.7). They are lowest in North Sea, at some USD 23 per barrel, and highest in the Barents Sea at around USD 31 per barrel. Unit costs in the Norwegian Sea average roughly USD 28 per barrel.
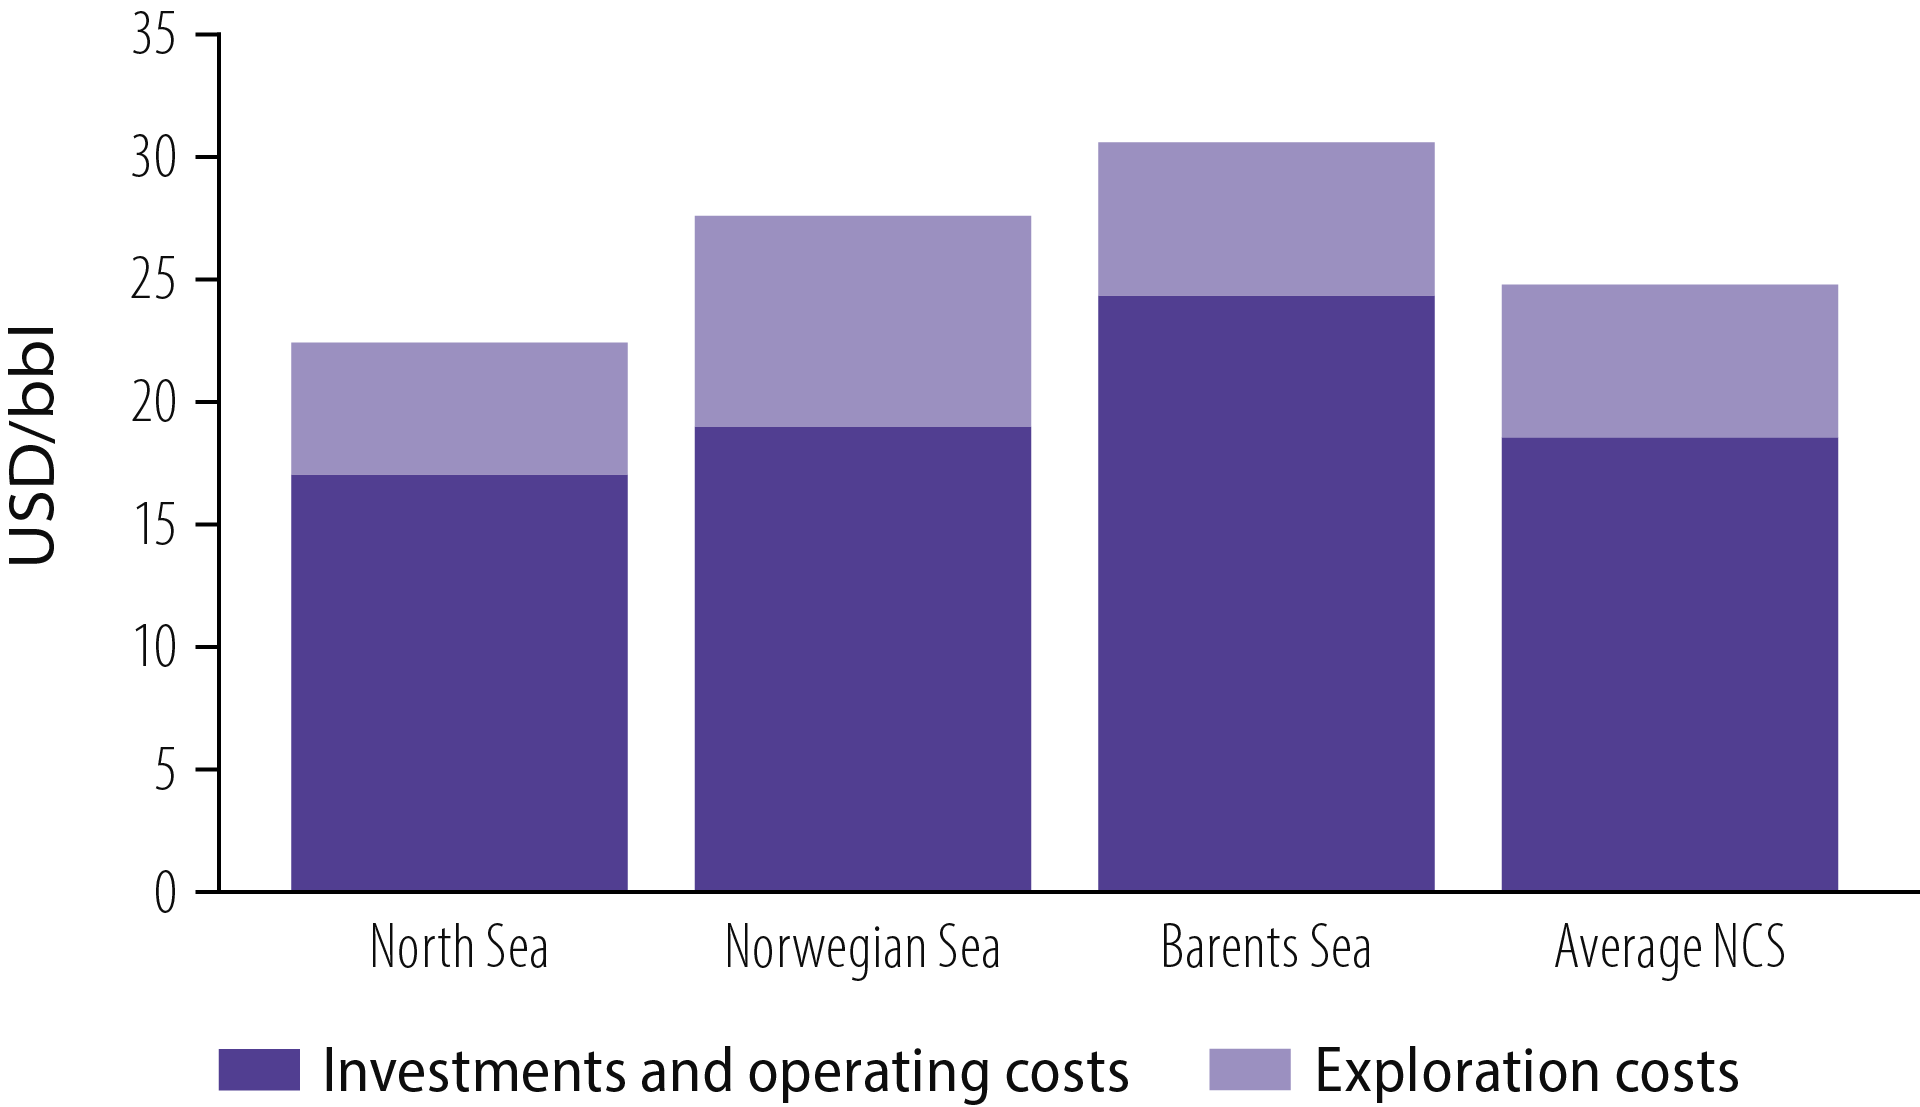
Figure 3.7 Unit costs for discoveries in 2002-21 by NCS area.
Figure 3.7 shows that investment and operating costs per unit produced are lower in the North and Norwegian Seas than in the Barents Sea. With big capital spending in the North and Norwegian Seas already fully recouped, new discoveries can be phased in with good profitability. At the same time, declining production from a number of fields in these areas could mean that unit costs rise. To maintain good profitability on the NCS in the future, it is extremely important that new resources are tied back to cost-effective infrastructure (chapter 3.2 Assets in the discovery portfolio).
Good profitability requires that new resources are tied back to cost-effective infrastructure
New infrastructure investment represents a large proportion of unit costs in the Barents Sea. That is as expected in a petroleum province being matured and in the development phase. At the same time, calculations show that exploration costs per unit produced do not exceed the average for the NCS (about USD 6 per barrel). To continue maturing the Barents Sea as a petroleum province, it will be important that the companies persist in exploring in frontier areas as well as close to existing discoveries.
Fact box – Value creation from discoveries of different sizes
Significance of exploration for future production Production and energy deliveries from the NCS are expected to decline rapidly over the next few years unless supplemented by new resources. Figure 3.9 shows that a large proportion of production over the next 10 years will derive from discoveries made in the past two decades. Almost 25 per cent of overall production from the NCS in 2022 comes from discoveries made after 2002. This will rise to about 40 per cent by 2030.
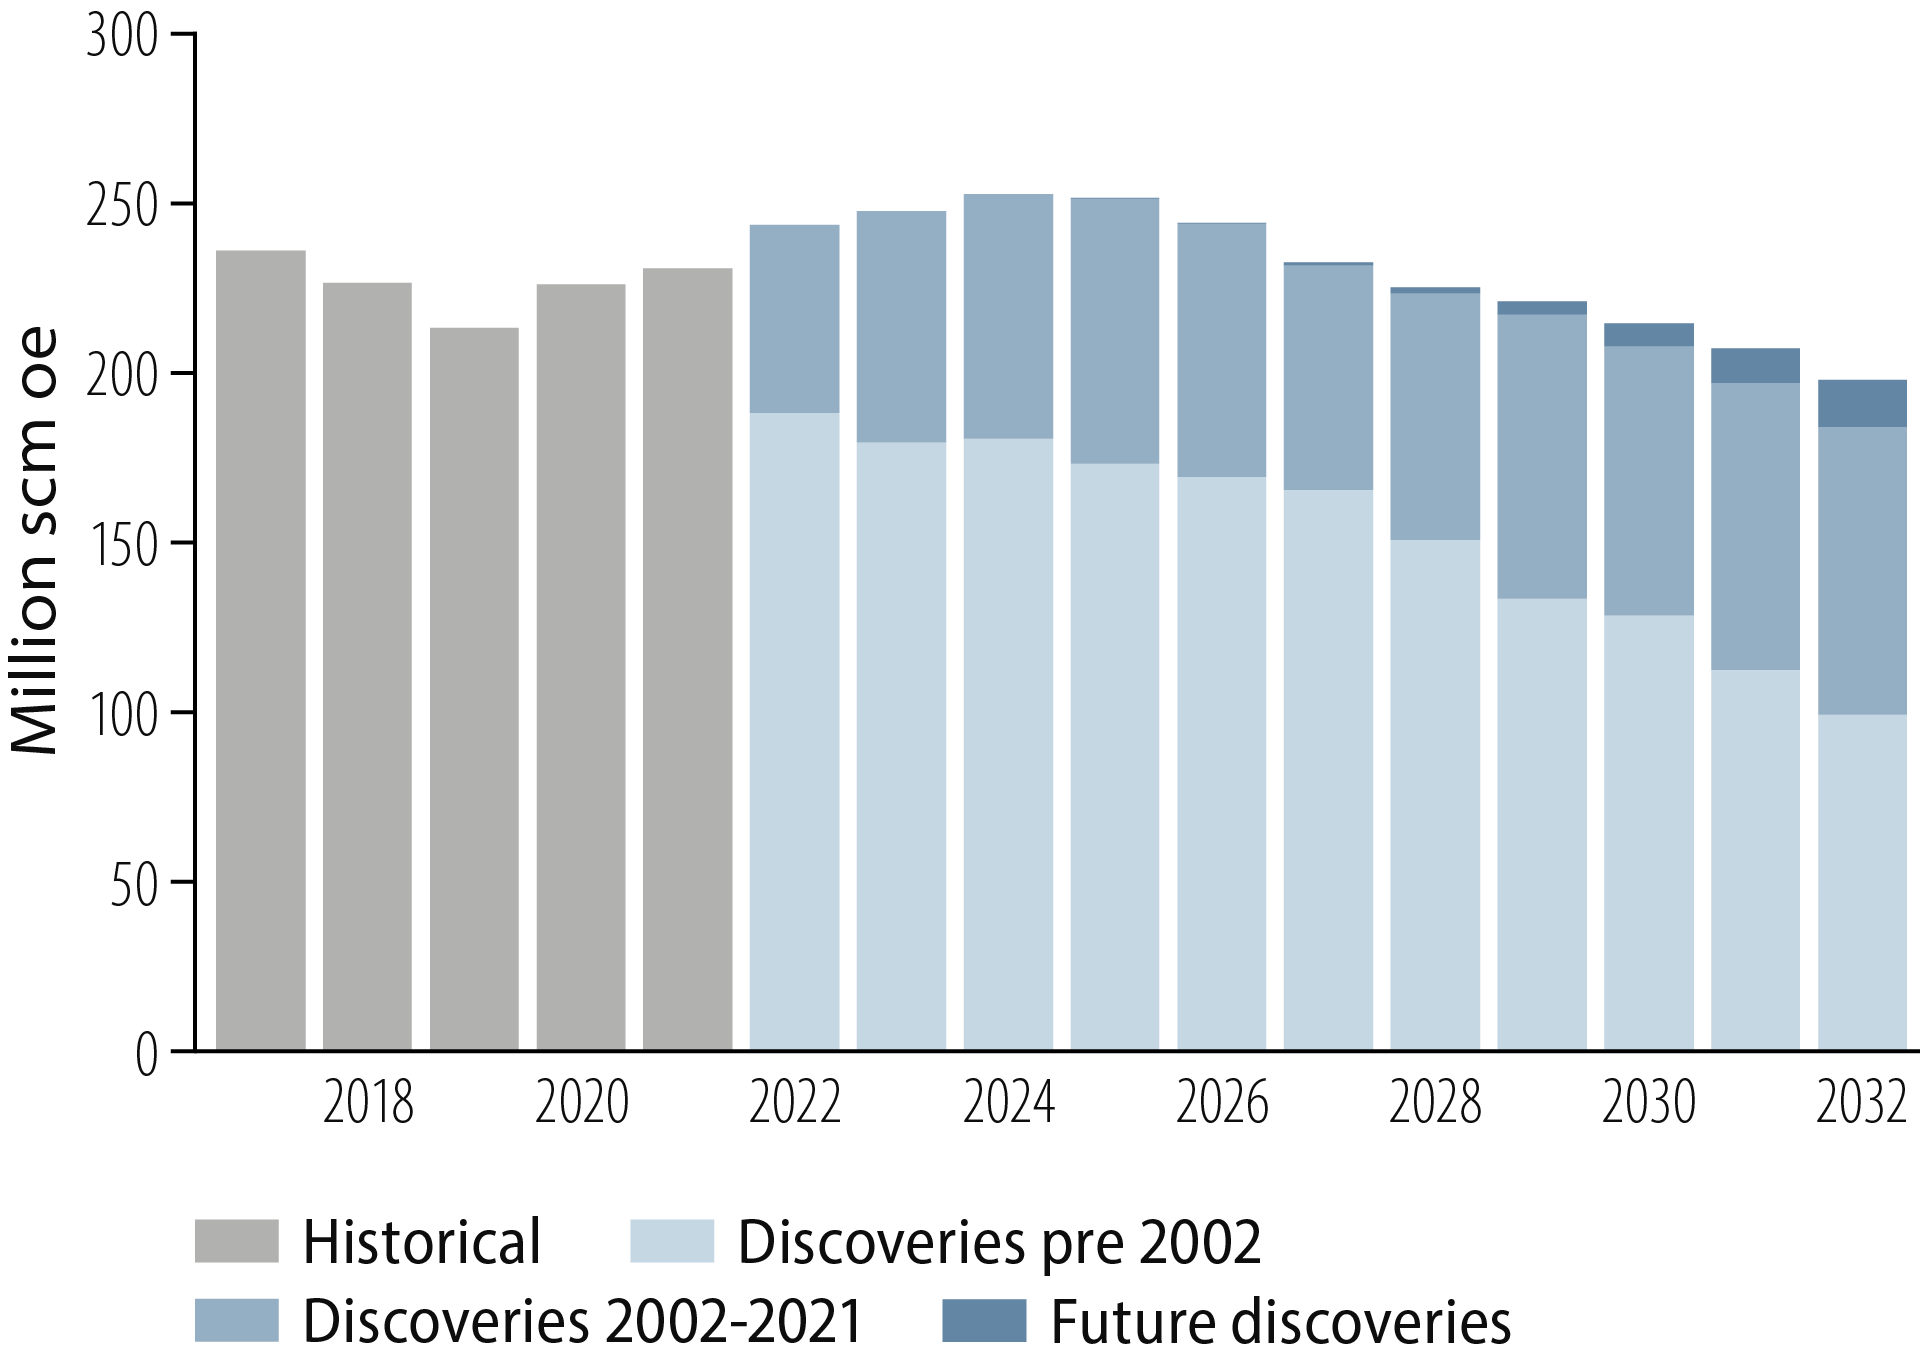
Figure 3.9 Historical and future oil and gas production.
Significantly more oil than gas was discovered on the NCS over the past 20 years. About 75 per cent of total revenues from discoveries made in 2002-21 derived from oil production, and the remainder from producing gas. Oil prices were significantly higher than for gas during the same period.
Figure 3.10 shows that more than half the oil produced on the NCS over the next 10 years will derive from discoveries made in the past two decades. Production from Johan Sverdrup accounts for a large proportion of this.
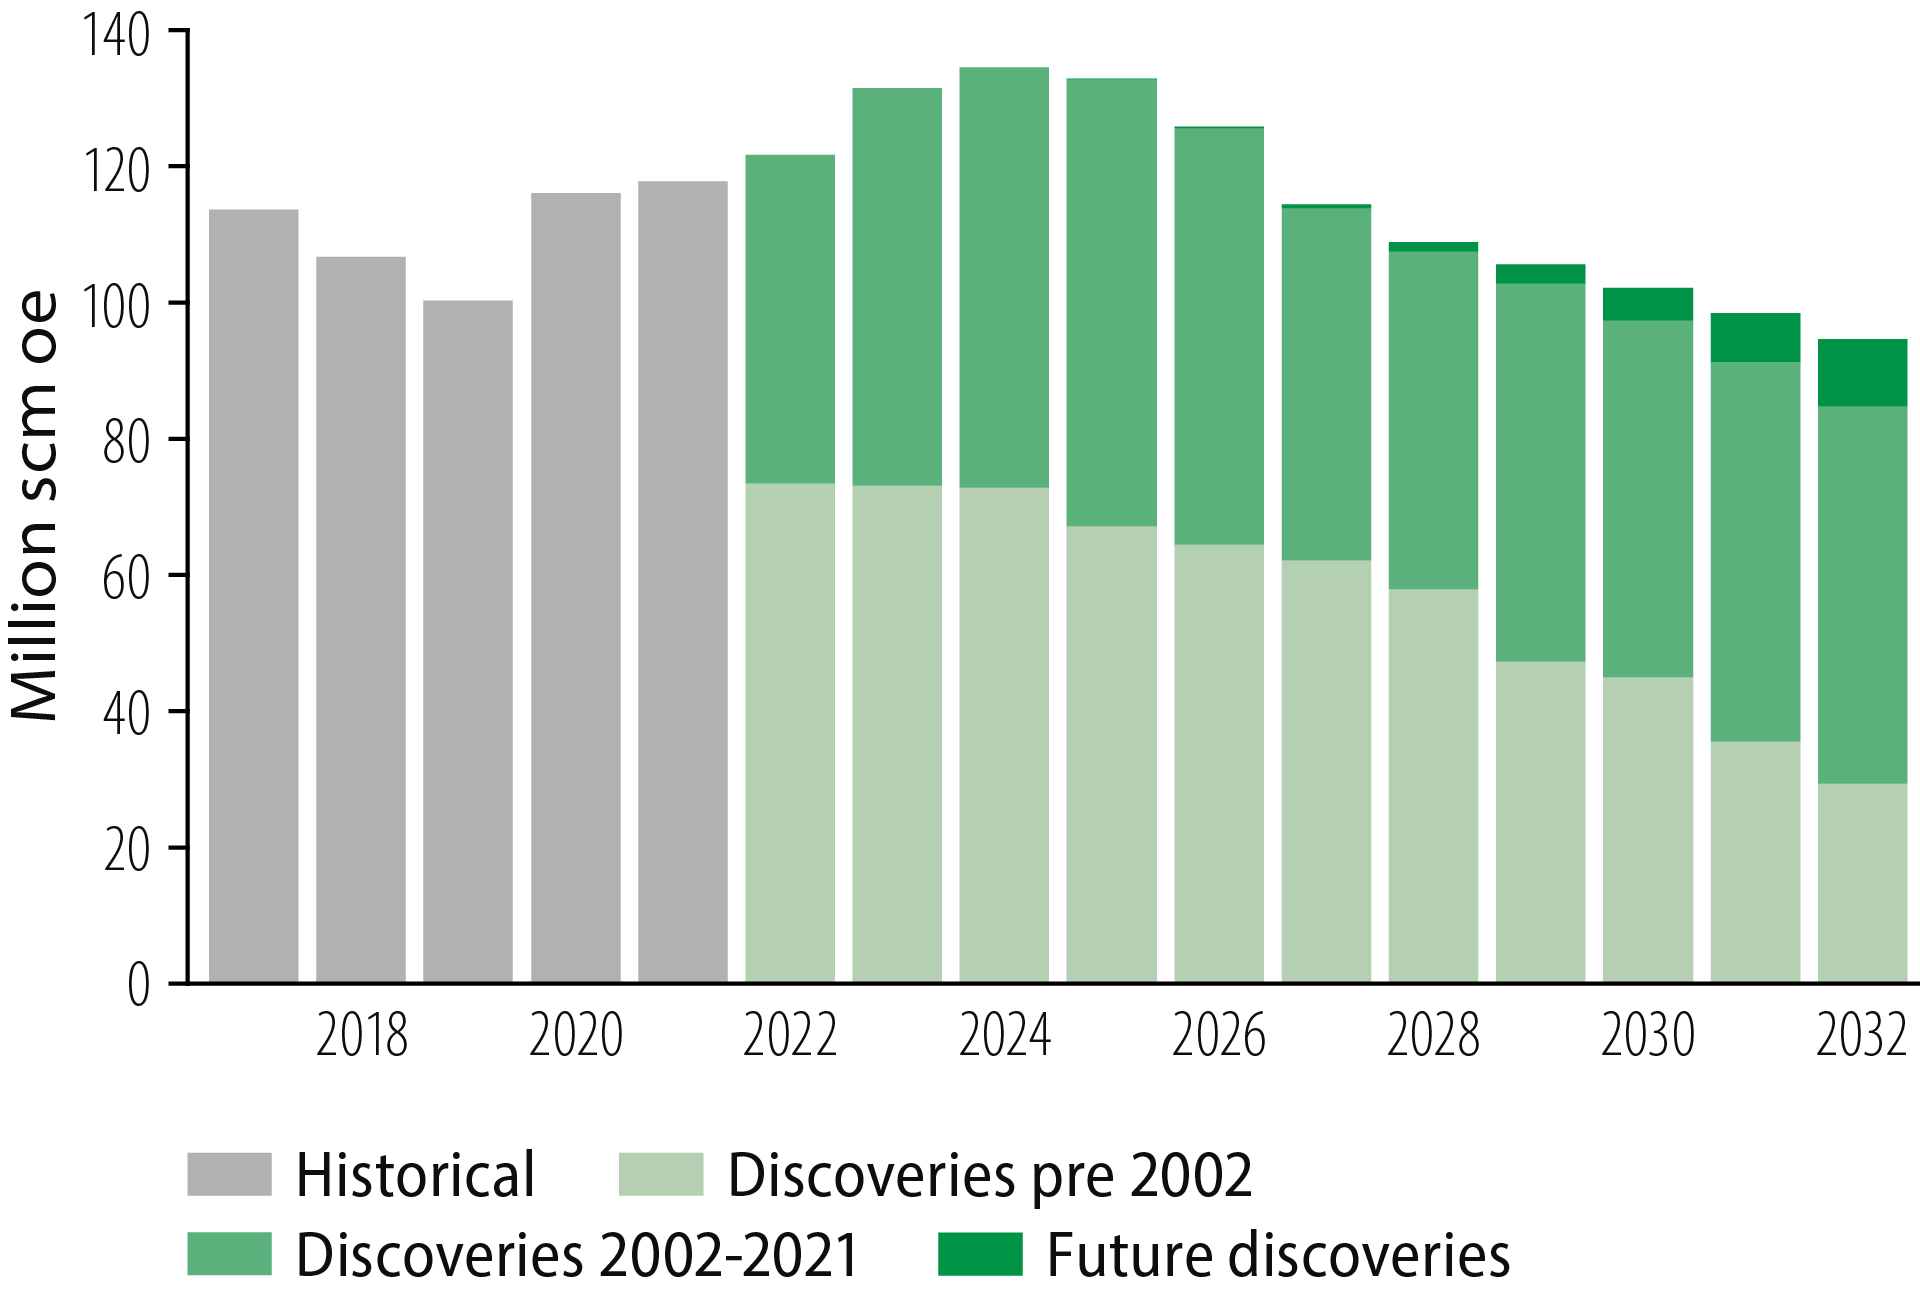
Figure 3.10 Historical and future oil production.
Figure 3.11 shows that less than 20 per cent of gas produced over the next 10 years will derive from discoveries made in the past two decades. In other words, future gas production will be based to a great extent on discoveries made more than 20 years ago. Troll accounts for a large proportion of this
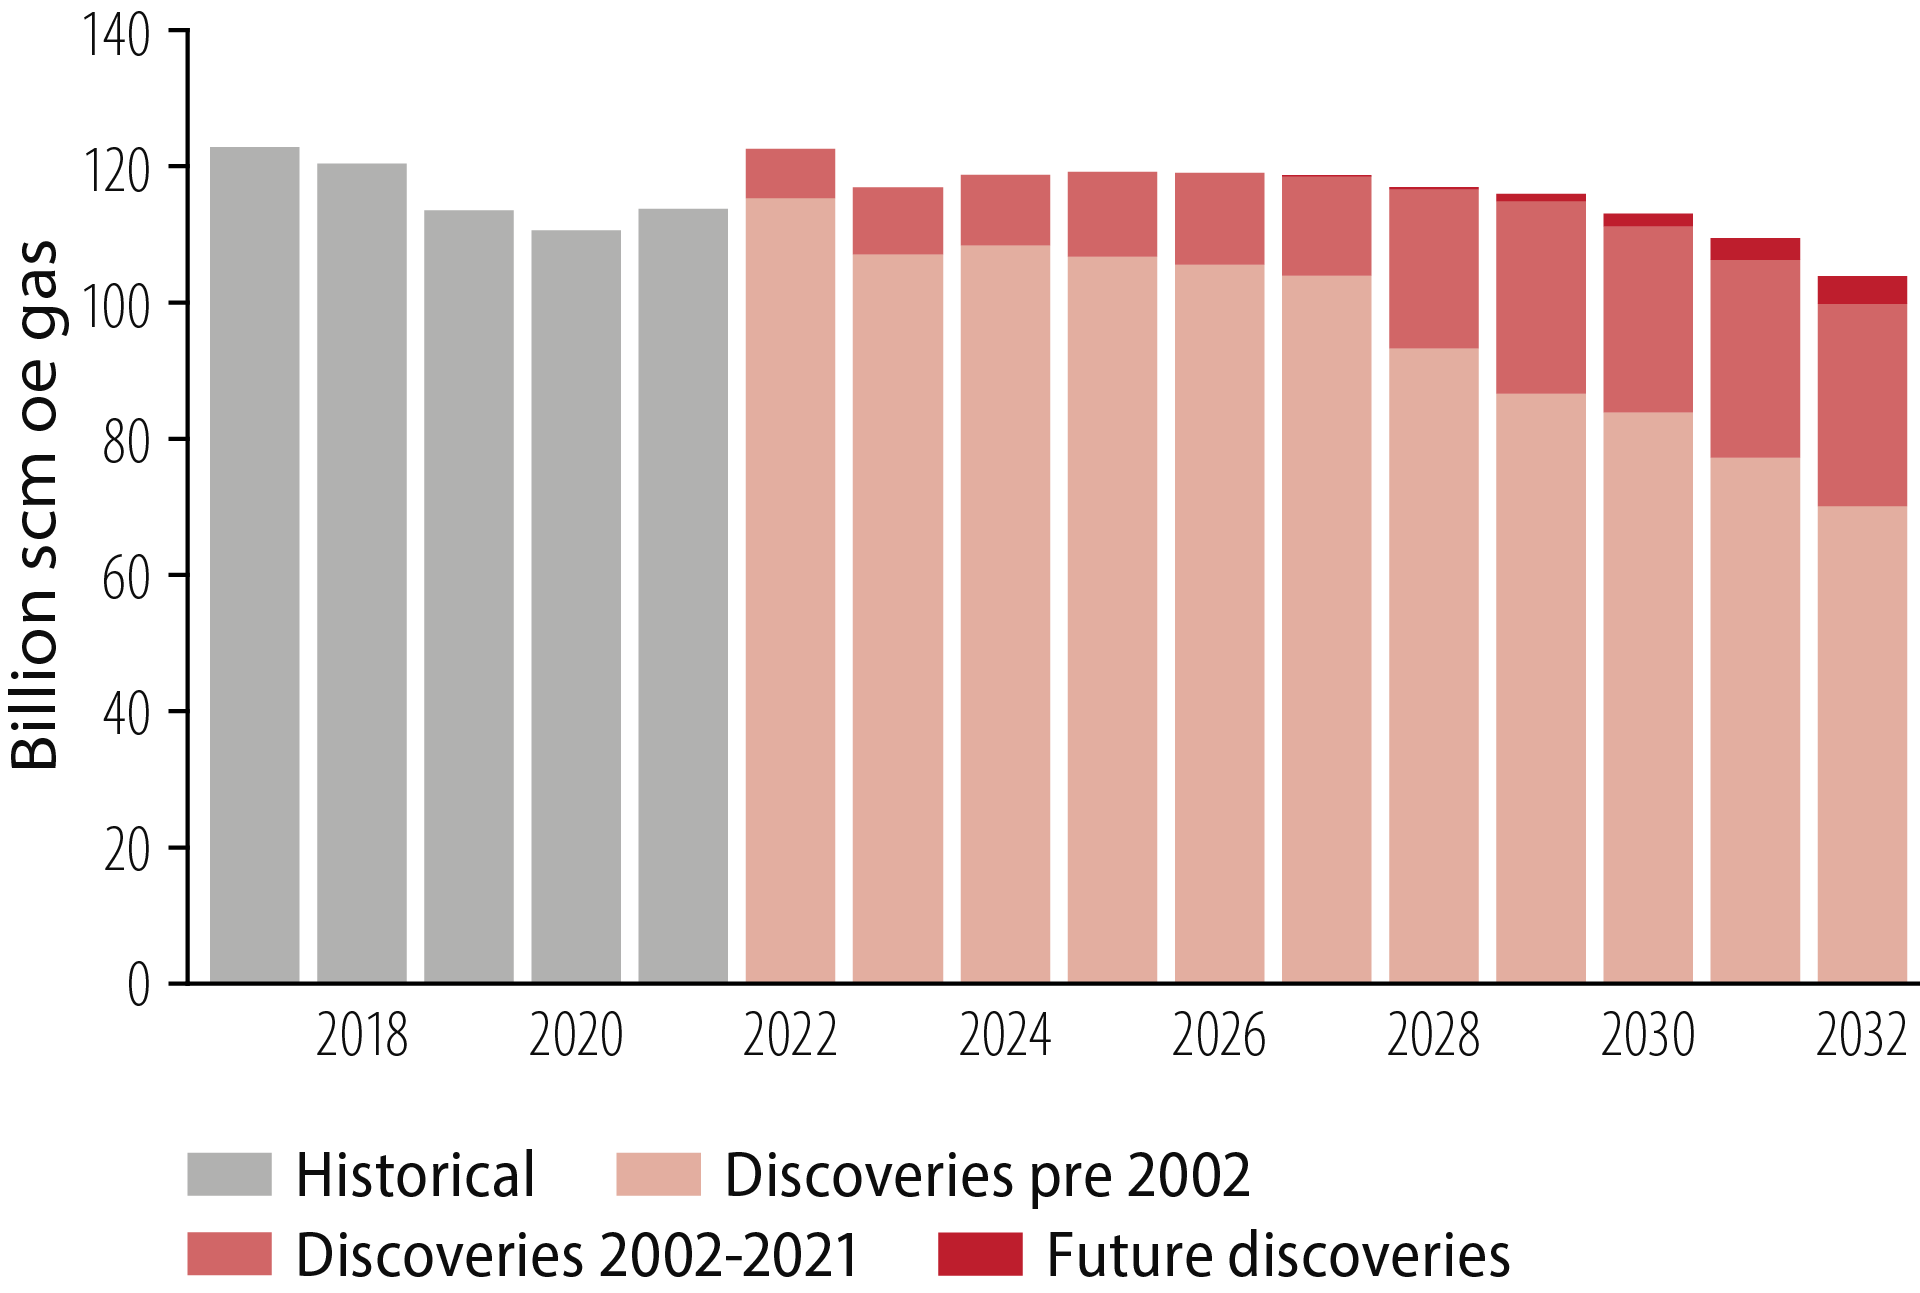
Figure 3.11 Historical and future gas production.
After 2030, production will fall substantially. Forecastsfor fields and discoveries reported by the companies show overall output in 2040 down by a third from today’s level without the addition of new resources (Figure 1.1). That would weaken the economics of fields on stream. Exploration will therefore be very important for the development of production and value creation after 2030.
3.2 Assets in the discovery portfolio
Timely exploration and development
Phasing into existing or future infrastructure can make even small discoveries profitable. That can help to extend the producing life of existing fields and infrastructure, which in turn incentivises more exploration close to fields. Opportunities for improved recovery and increased value creation from host fields are thereby enhanced.
Phasing discoveries in before unit costs become too high is important. That means further development of discoveries does not depend on spare capacity alone, but on this being combined with low unit costs (Figure 3.12).
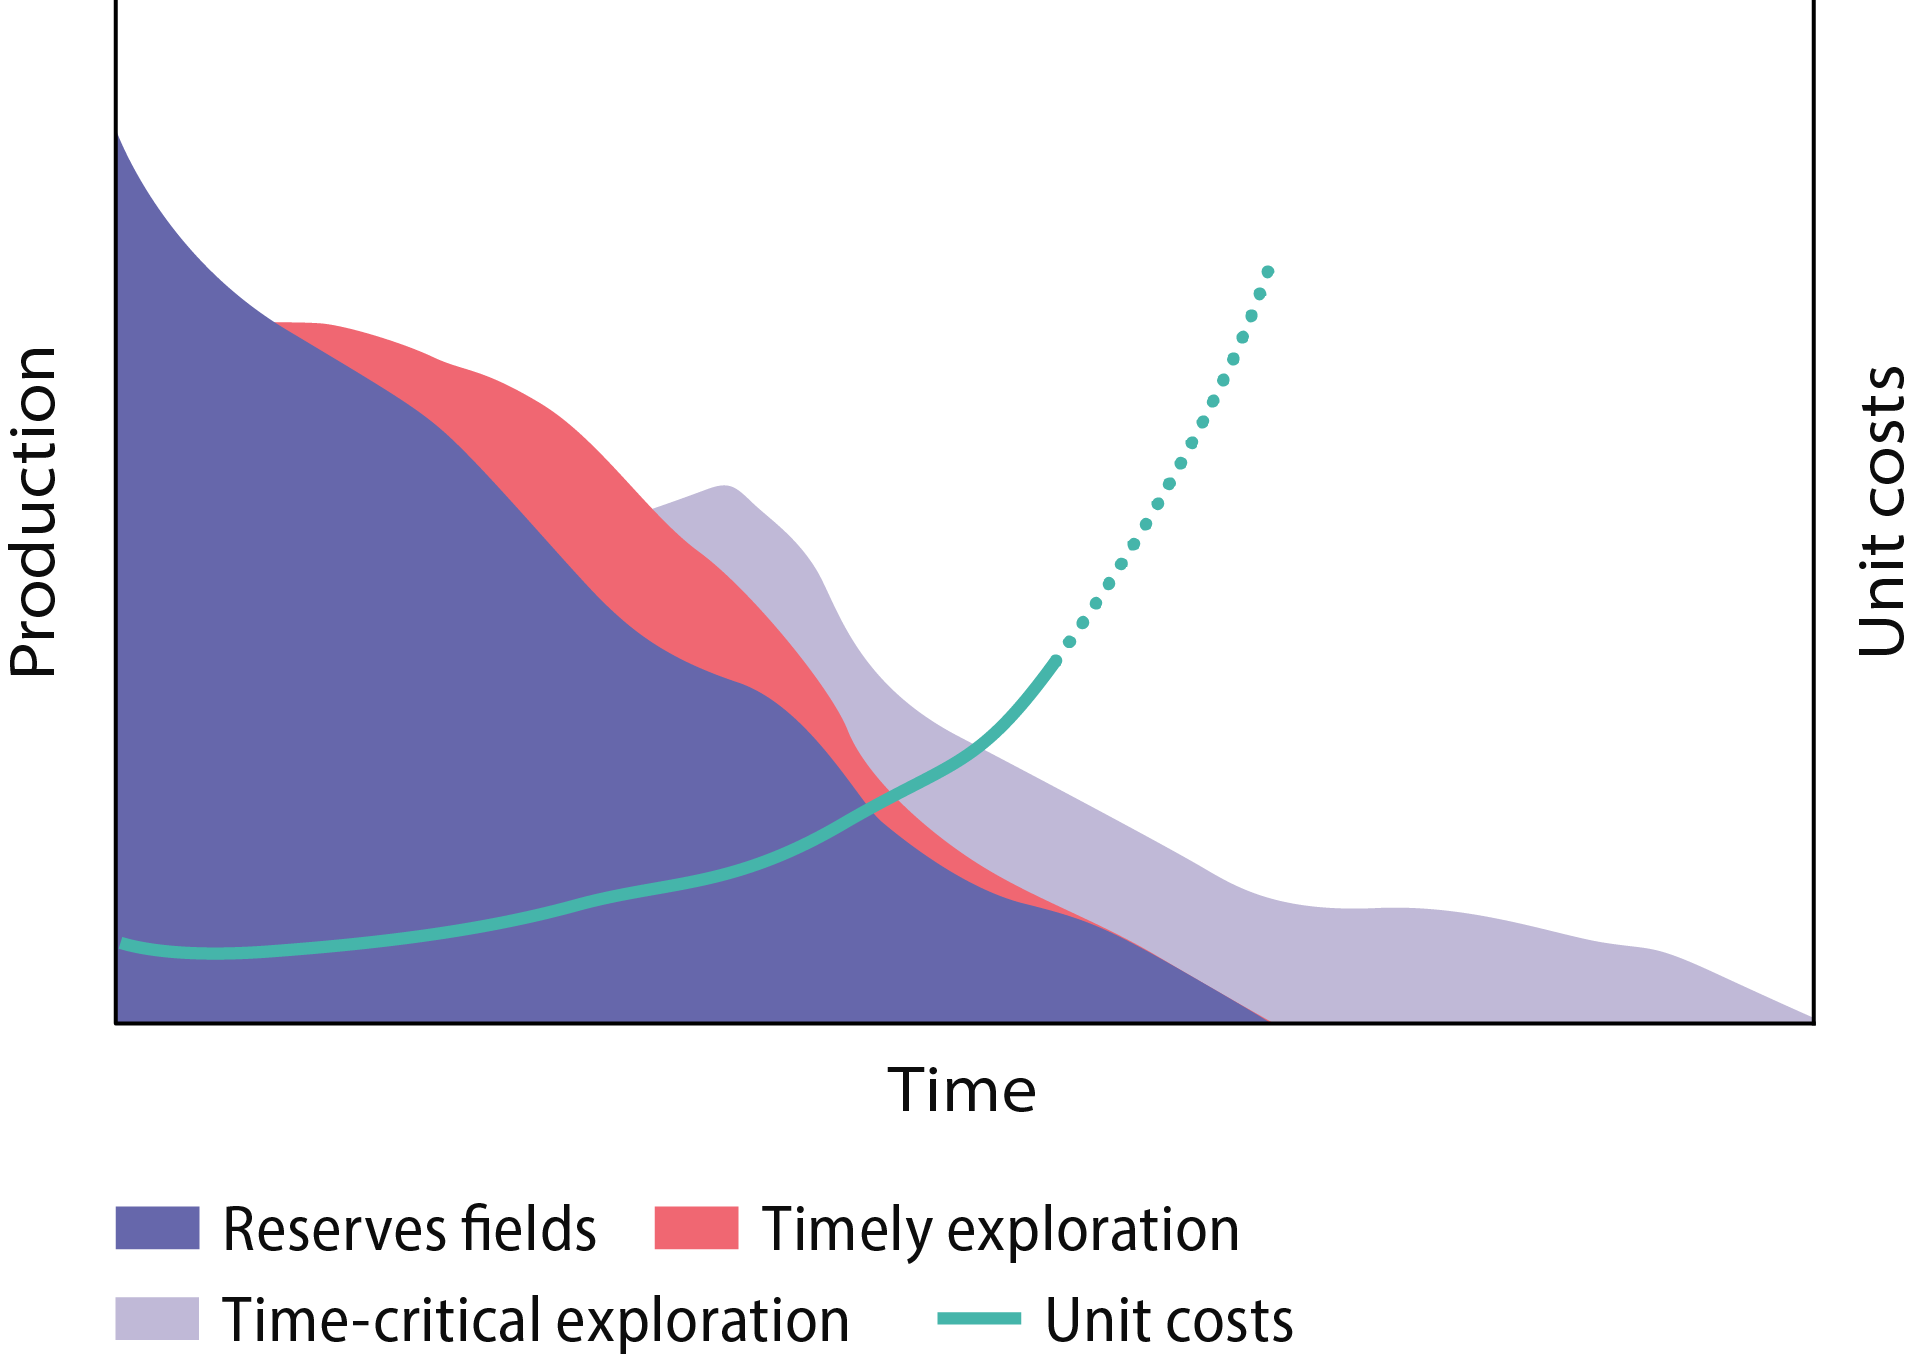
Figure 3.12 Timely and time-critical phasing-in.
Timely exploration and development are important for profitability
Figure 3.12 distinguishes between timely and time- critical resources. The first are resources phased in while unit costs on the host field are low. Time-critical resources are those phased in when unit costs on the host field are rising rapidly. In that case, resources are either lost or produced with low profitability.
Coordinated development
Exploiting economies of scale through coordinated development across production licences will become increasingly important as the NCS matures. Such area solutions can contribute to lower unit costs and effective exploration, so that as much as possible of the socioeconomically profitable resources can be recovered.
Coordination is crucial for profitable development of
small discoveries
The Petroleum Act (fact box The Petroleum Act) requires licensees to collaborate across production licences in order to ensure the maximum possible value creation.
Examples of possible coordinated developments are provided by the Halten East Unit in the area south of Åsgard and phasing-in the 25/5-9 (Trell) and 25/4-2 (Trine) discoveries in the Alvheim area (fact boxes Halten East Unit and Trell and Trine).
3.3 Assets in fields and improved recovery
Operating costs have declined substantially since oil prices fell in 2014 (Figure 3.14). The NPD does not expect overall operating costs to rise significantly towards 2026, even if more fields come on stream.
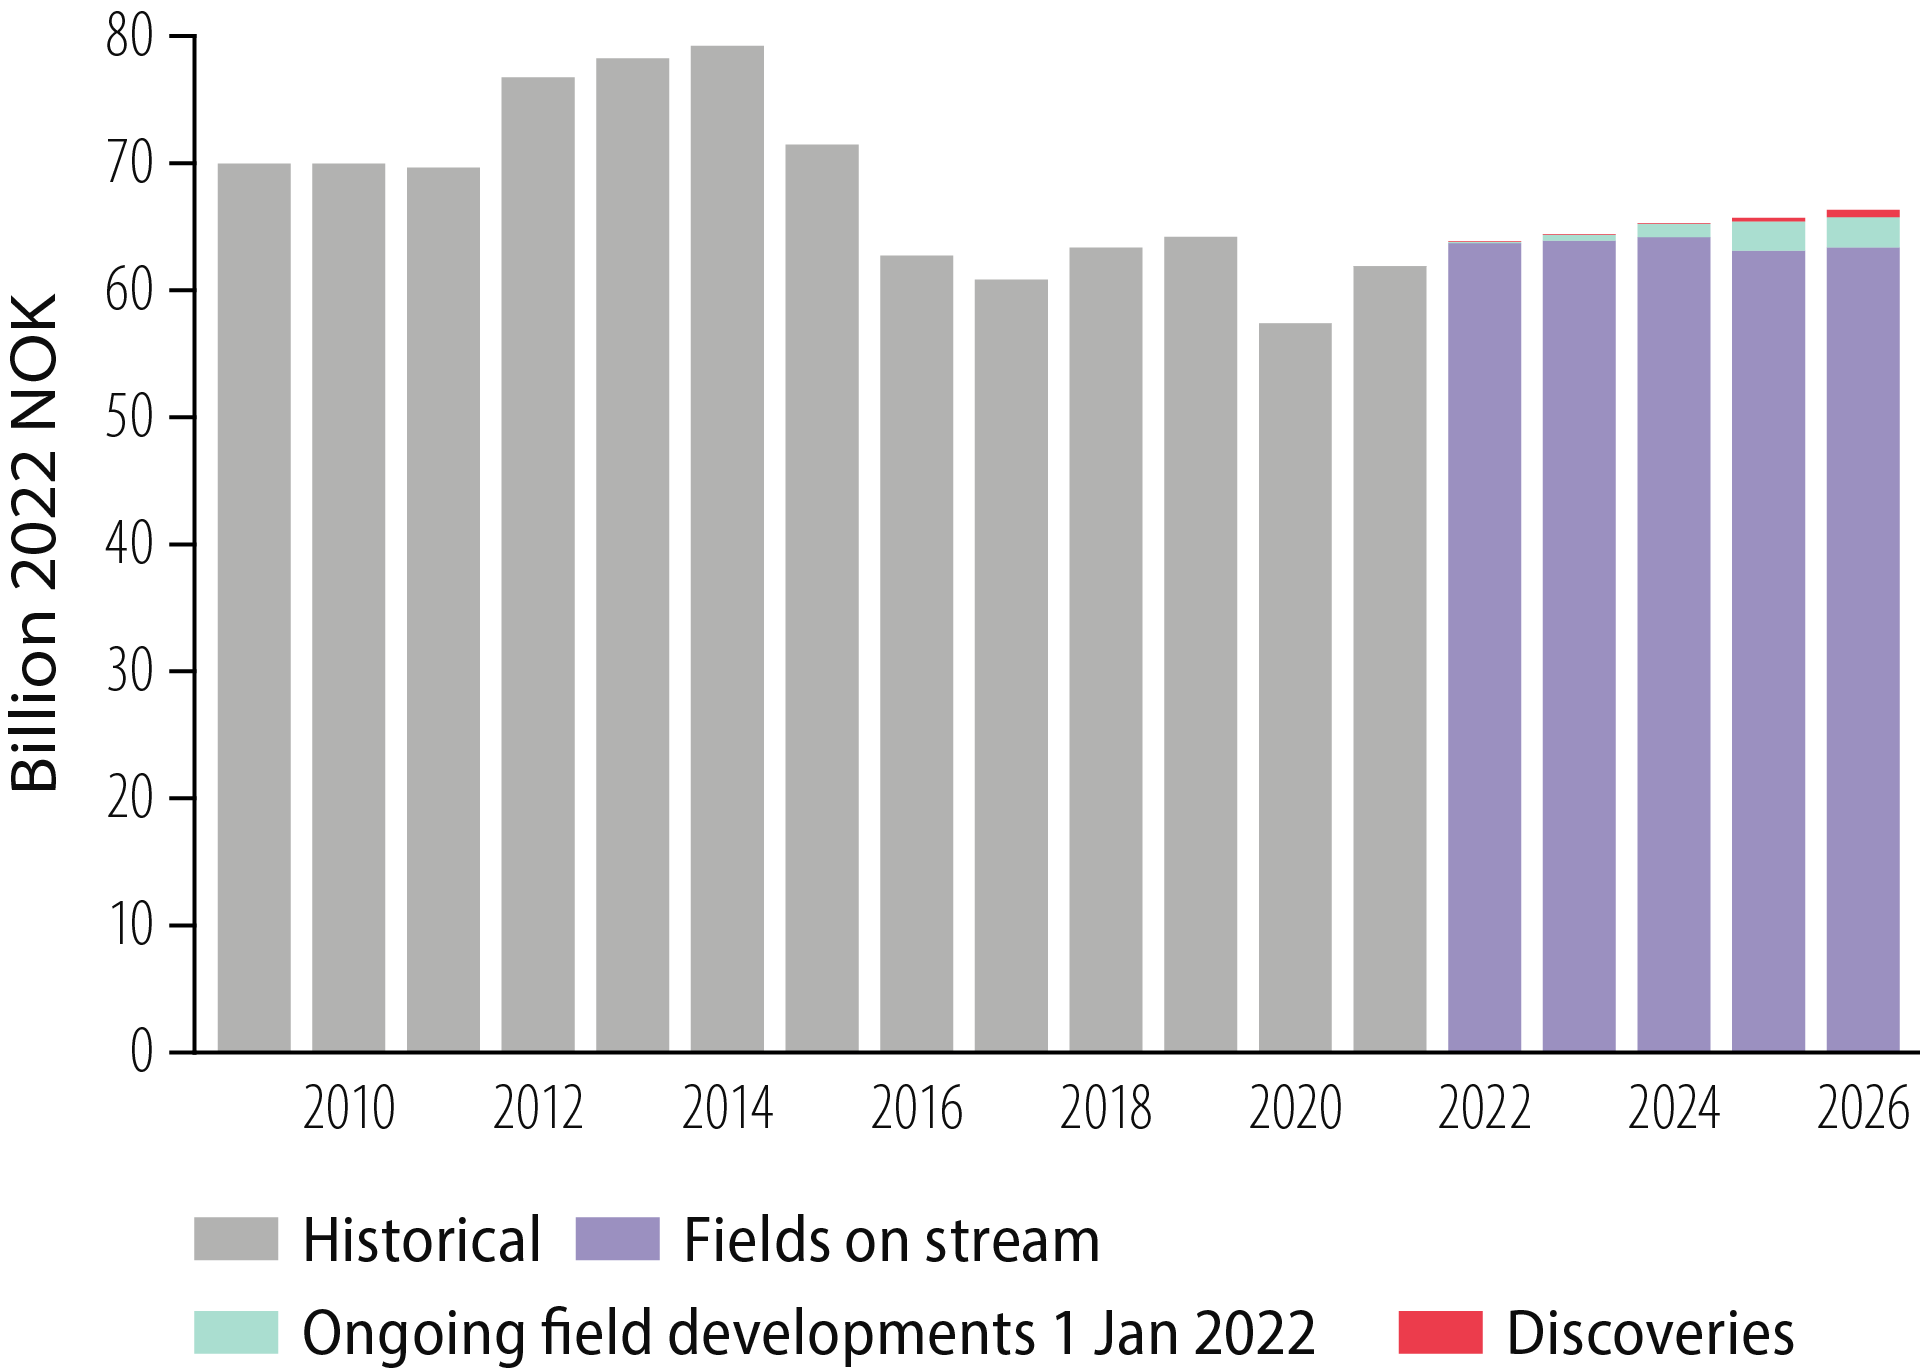
Figure 3.14 Historical operating costs and forecasts Updated at 13 January 2022.
That can help to keep unit costs down to a competitive level. In today’s circumstances, continuing production is profitable even with very low oil and gas prices (Figure 3.15).
Profitable production even with low oil and gas prices
However, unit costs will rise unless measures are adopted to prevent production declining quickly.
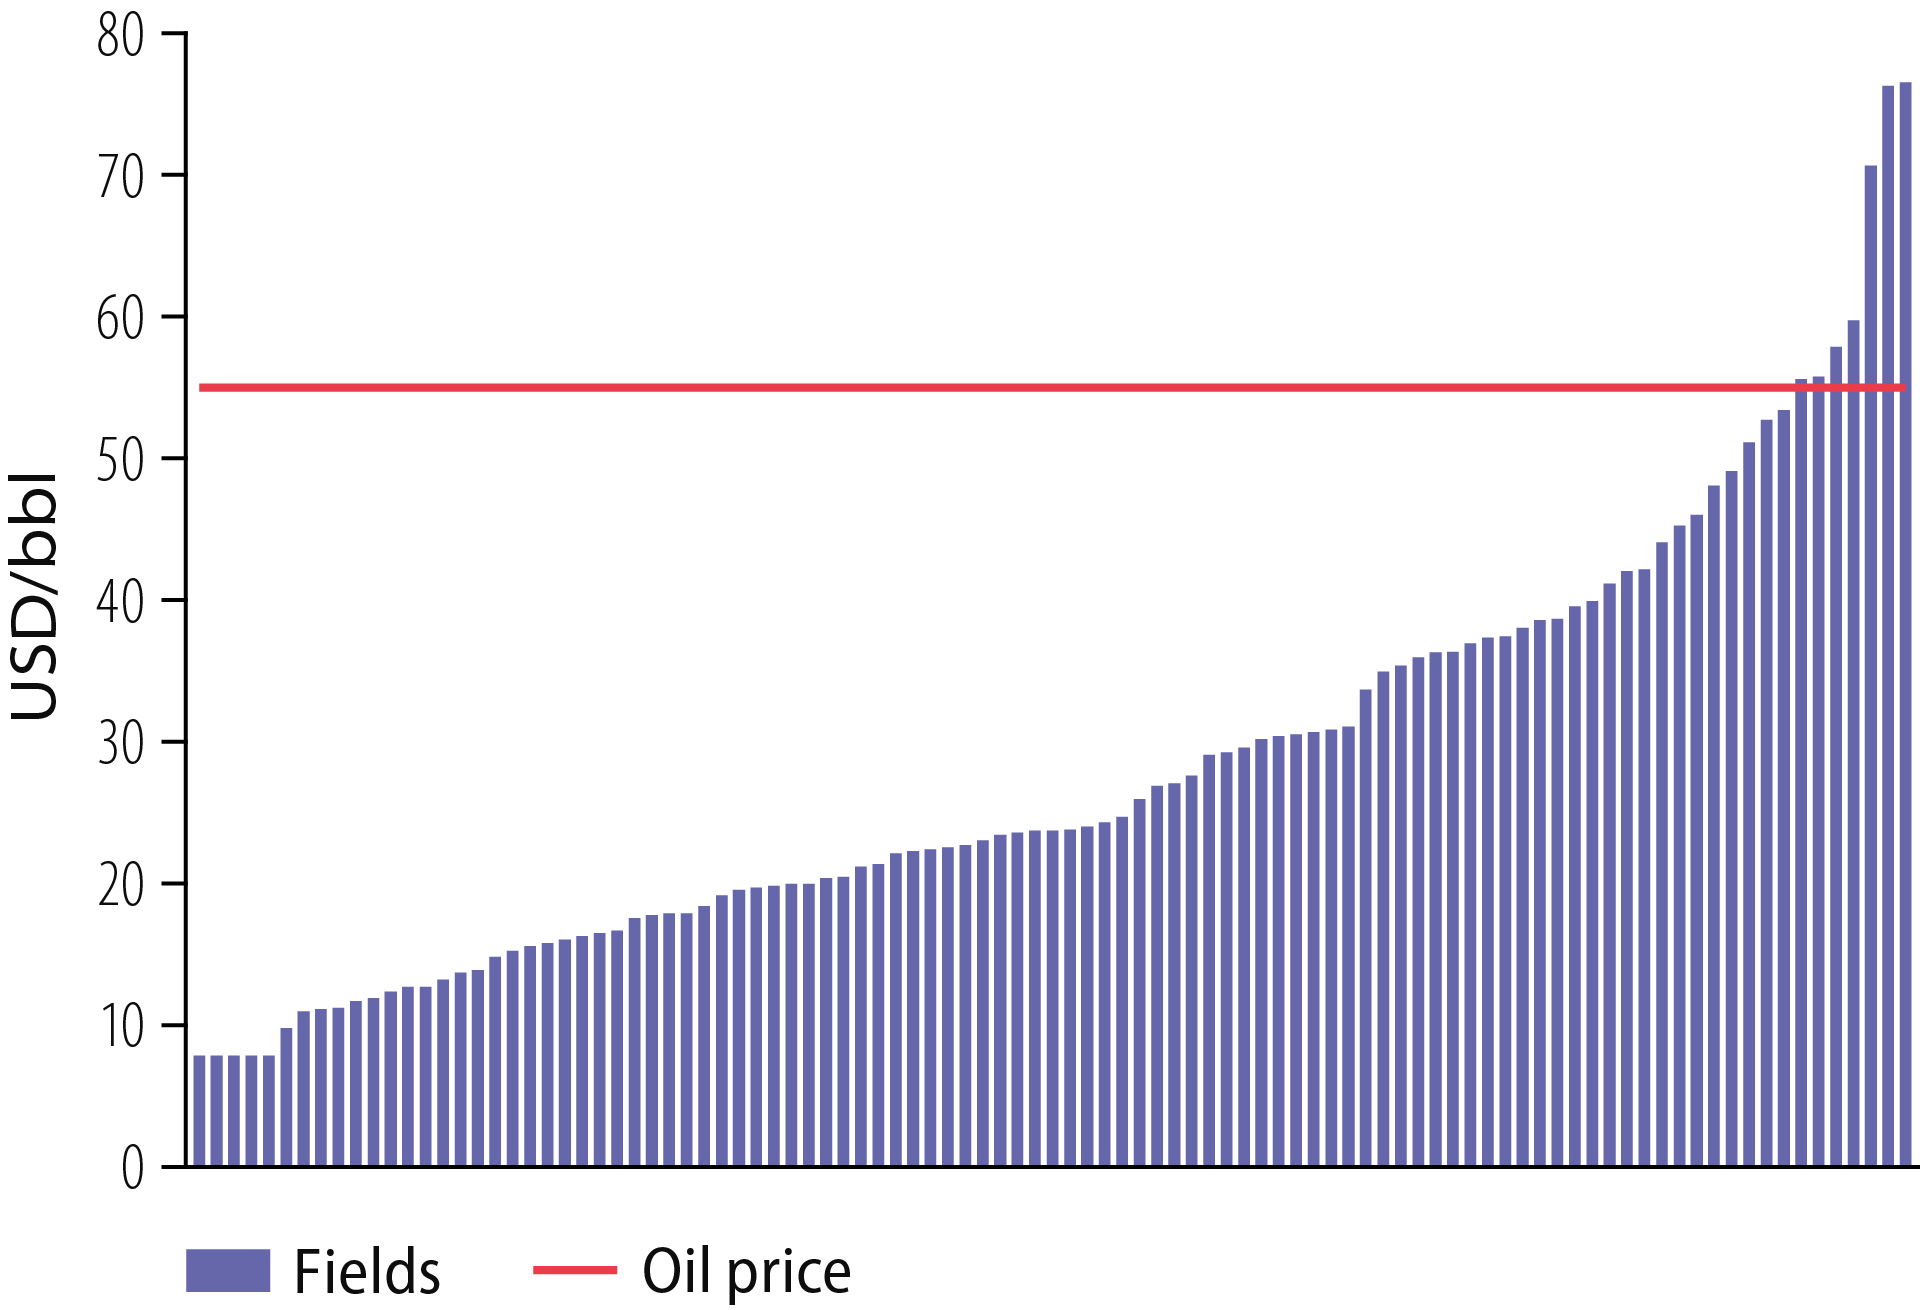
Figure 3.15 Competitive unit costs Unit costs (undiscounted) are based on forecasts for production and costs from 2023. They include operating costs (incl area fee, green taxes and transport costs) and investment in fields on stream.
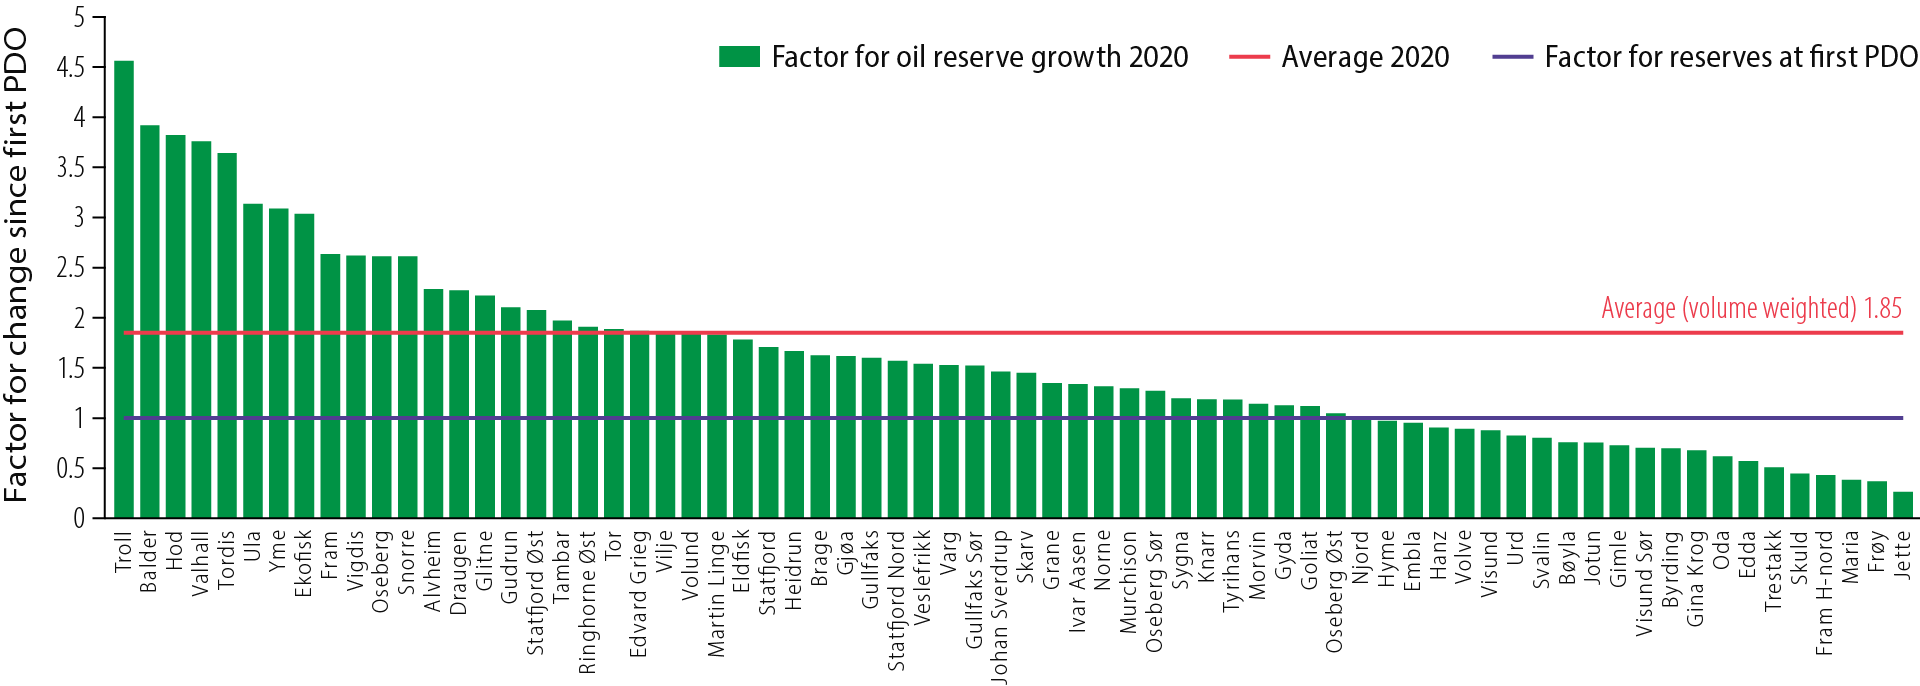
Figure 3.16 Present versus PDO resources.
History shows that most of the big fields on the NCS have produced more and for longer than was assumed when they were developed. Figure 3.16 compares current oil reserves in fields with the figure given in the original PDO. A field with the bar extending above the blue line has had its estimated reserves upgraded – in several cases, by more than double. Those below the line have seen their estimate reduced, and are by and large small fields.
Understanding of a reservoir’s properties improves throughout the production phase. That may contribute to big differences between the original PDO production forecast and actual output.
Flexible development solutions increase future value creation
This emphasises the importance of planning early for flexibility and upsides – such as providing sufficient well slots to permit future measures involving improved recovery or additional resources.
The oil companies submit annual reports of planned improved recovery projects in connection with the RNB, (chapter 2.4 Improved recovery). Company reporting has identified relatively few EOR measures. Such projects are therefore expected to make a small value contribution. This confirms that a big gap exists between the industry’s plans and the resource potential offered by the EOR methods identified by NPD studies.
A number of reasons exist for this gap. An important one is that the required rate of return set by the companies is higher than that applied in socioeconomic analyses (fact box Required rate of return). More socioeconomically profitable EOR projects could thereby be available than the companies wish to implement.
CO2 captured for storage (CCS) can be used to improve oil recovery (carbon capture, utilisation and storage – CCUS). This represents a competitive method for storing CO2, which might have a big potential when CCS value chains are established on the NCS (chapter 5 Energy transition opens new opportunities).
Fact box – Required rate of return
3.4 Managing gas for increased value creation
Russia’s invasion of Ukraine has affected the European gas market. The completed gas export pipeline from Russia to Germany remains unopened, Russia has made big cuts in spot sales to Europe, and the long-term gas sales contracts are partly being cancelled and partly under heavy pressure. Norway is in a unique position here, thanks to an extensive pipeline network for natural gas to the EU with low transport costs. That makes it competitive with LNG transport from other regions.
A joint declaration on energy collaboration from an EU-Norway meeting emphasises the special
Norwegian position and the need for deliveries of both oil and gas, including after 2030. "The EU supports Norway’s continued exploration and investments to bring oil and gas to the European market." [19]
Norwegian gas has acquired more value
Given substantial remaining gas resources, an efficient and reliable gas transport system to Europe, the expected trend for gas demand and declining gas production in the EU, the basis exists for maintaining Norwegian gas exports at a high level for a long time to come (Figure 3.17). At 31 December 2021, five fields accounted for almost 70 per cent of Norway’s gas reserves – with Troll alone providing about 45 per cent.
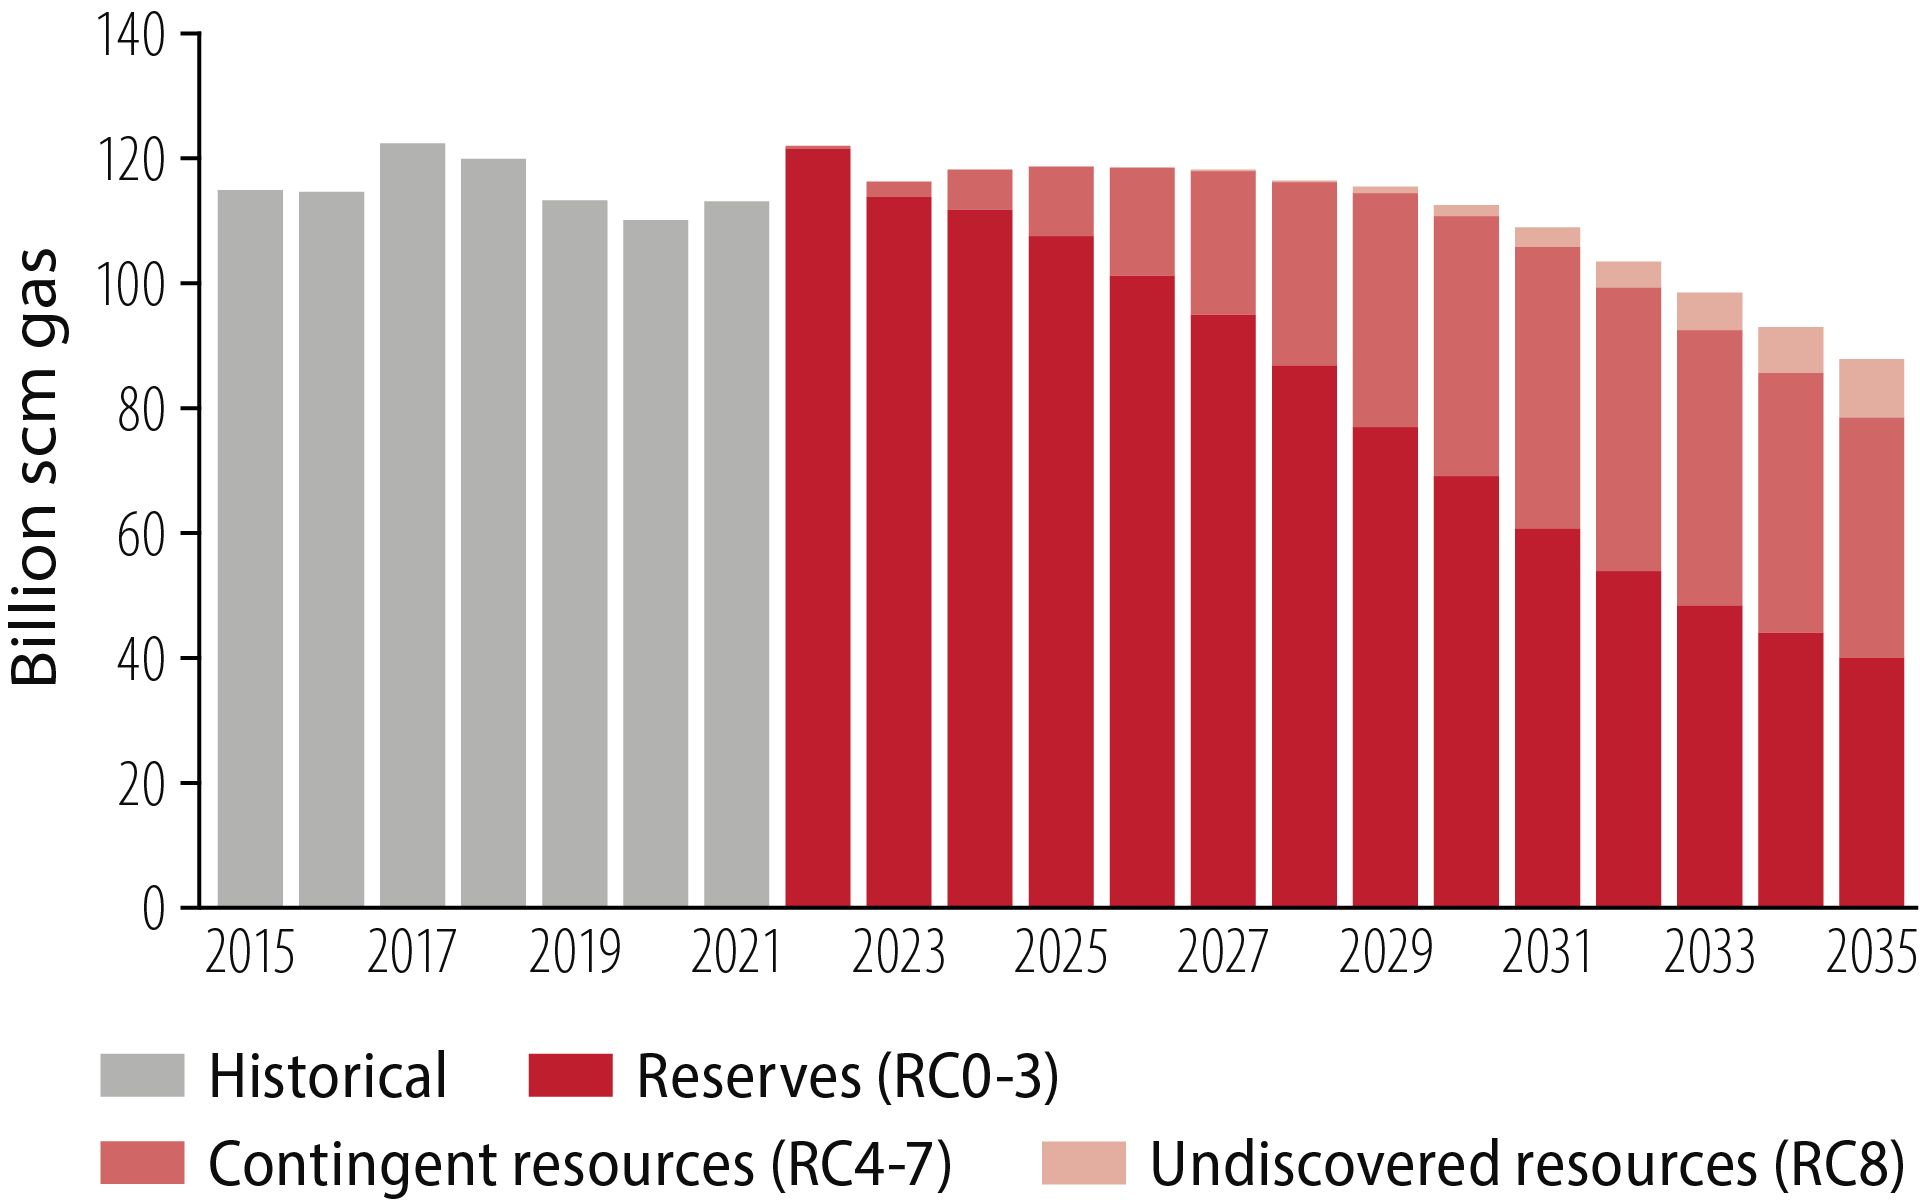
Figure 3.17 Gas sales from the NCS by resource class.
Gas exports have increased from several fields in recent years. An important reason is accelerated gas output from fields in a mature phase with small remaining oil resources. High gas prices in 2021-22 meant that exports from the larger fields have risen even more. Such acceleration yields substantial revenues but could also lead to the loss of oil resources (fact box Dilemma: gas injection to improve oil recovery – or accelerating the gas?).
Fact box – Dilemma: gas injection to improve oil recovery – or accelerating the gas?
Gas is exported from the Barents Sea today via the gas liquefaction plant at Melkøya off Hammerfest. Production from Snøhvit will occupy all capacity in this facility for a long time to come. Based on exploration activity so far in the opened areas of the Barents Sea, no individual field is able to support the establishment of new export capacity. The latter therefore depends to a great extent on coordinating resources. At the same time, a failure by the companies to explore for gas will make it harder to find enough resources to justify new infrastructure – either stand-alone or coordinated.
Studies conducted by the NPD and Gassco in 2020 showed that it will be socioeconomically profitable to increase gas export capacity from this part of the NCS. Later studies have confirmed this [2].
To secure sales opportunities for gas fields and for oil fields with associated gas, various companies are looking at the possibility of developing joint infrastructure for managing gas between Snøhvit, Johan Castberg og 7324/8-1 (Wisting). These fields and discoveries would thereby acquire sales opportunities. But revenues from the gas would come far in the future, once the Snøhvit resources have been produced. The solution outlined does not increase gas export capacity from the Barents Sea.
With support from Enova, industrial players are exploring opportunities to produce "blue" ammonia from natural gas combined with CO2 storage beneath the seabed. Plans for this Barents Blue project call for the ammonia to be transported to market by sea.
Other gas export options include increased LNG capacity and new pipelines. It will be important to develop solutions which take account of area and NCS perspectives and which incentivise increased exploration for and development of oil and gas.
3.5 Technology development and expertise
Technological advances have made big resources originally considered non-commercial available on the NCS. As the NCS matures, continued development of technology, expertise and knowledge will be no less important.
Within exploration, more and better data and greater understanding of the geology have made it possible to identify new plays. That has contributed to further discoveries. Figure 3.18 shows an increase in the technical success rate on the NCS over the past five years. It was on a par with the international average in 2021 [21]. The figure is based on 995 wildcats in 80 countries completed in 2017-21. The commercial success rate on the NCS has also increased in recent years, but is somewhat below the international average. Technological progress, improved surveying, more and better use of data, and greater understanding of the geology could contribute to reduced exploration risk and more discoveries.
Where development and operation are concerned, coming up with and implementing new and more cost-effective technology permit oil and gas to be produced from ever more technologically demanding fields. Slim hole drilling on Åsgard and Edvard Grieg is a good example (Figure 3.19).
Technologies for faster drilling speeds, optimising recovery strategies with the aid of new digital tools (fact box Digital solutions on Johan Sverdrup), EOR methods and next-generation developments with remotely controlled and low-manned operation will also play key roles in the future.
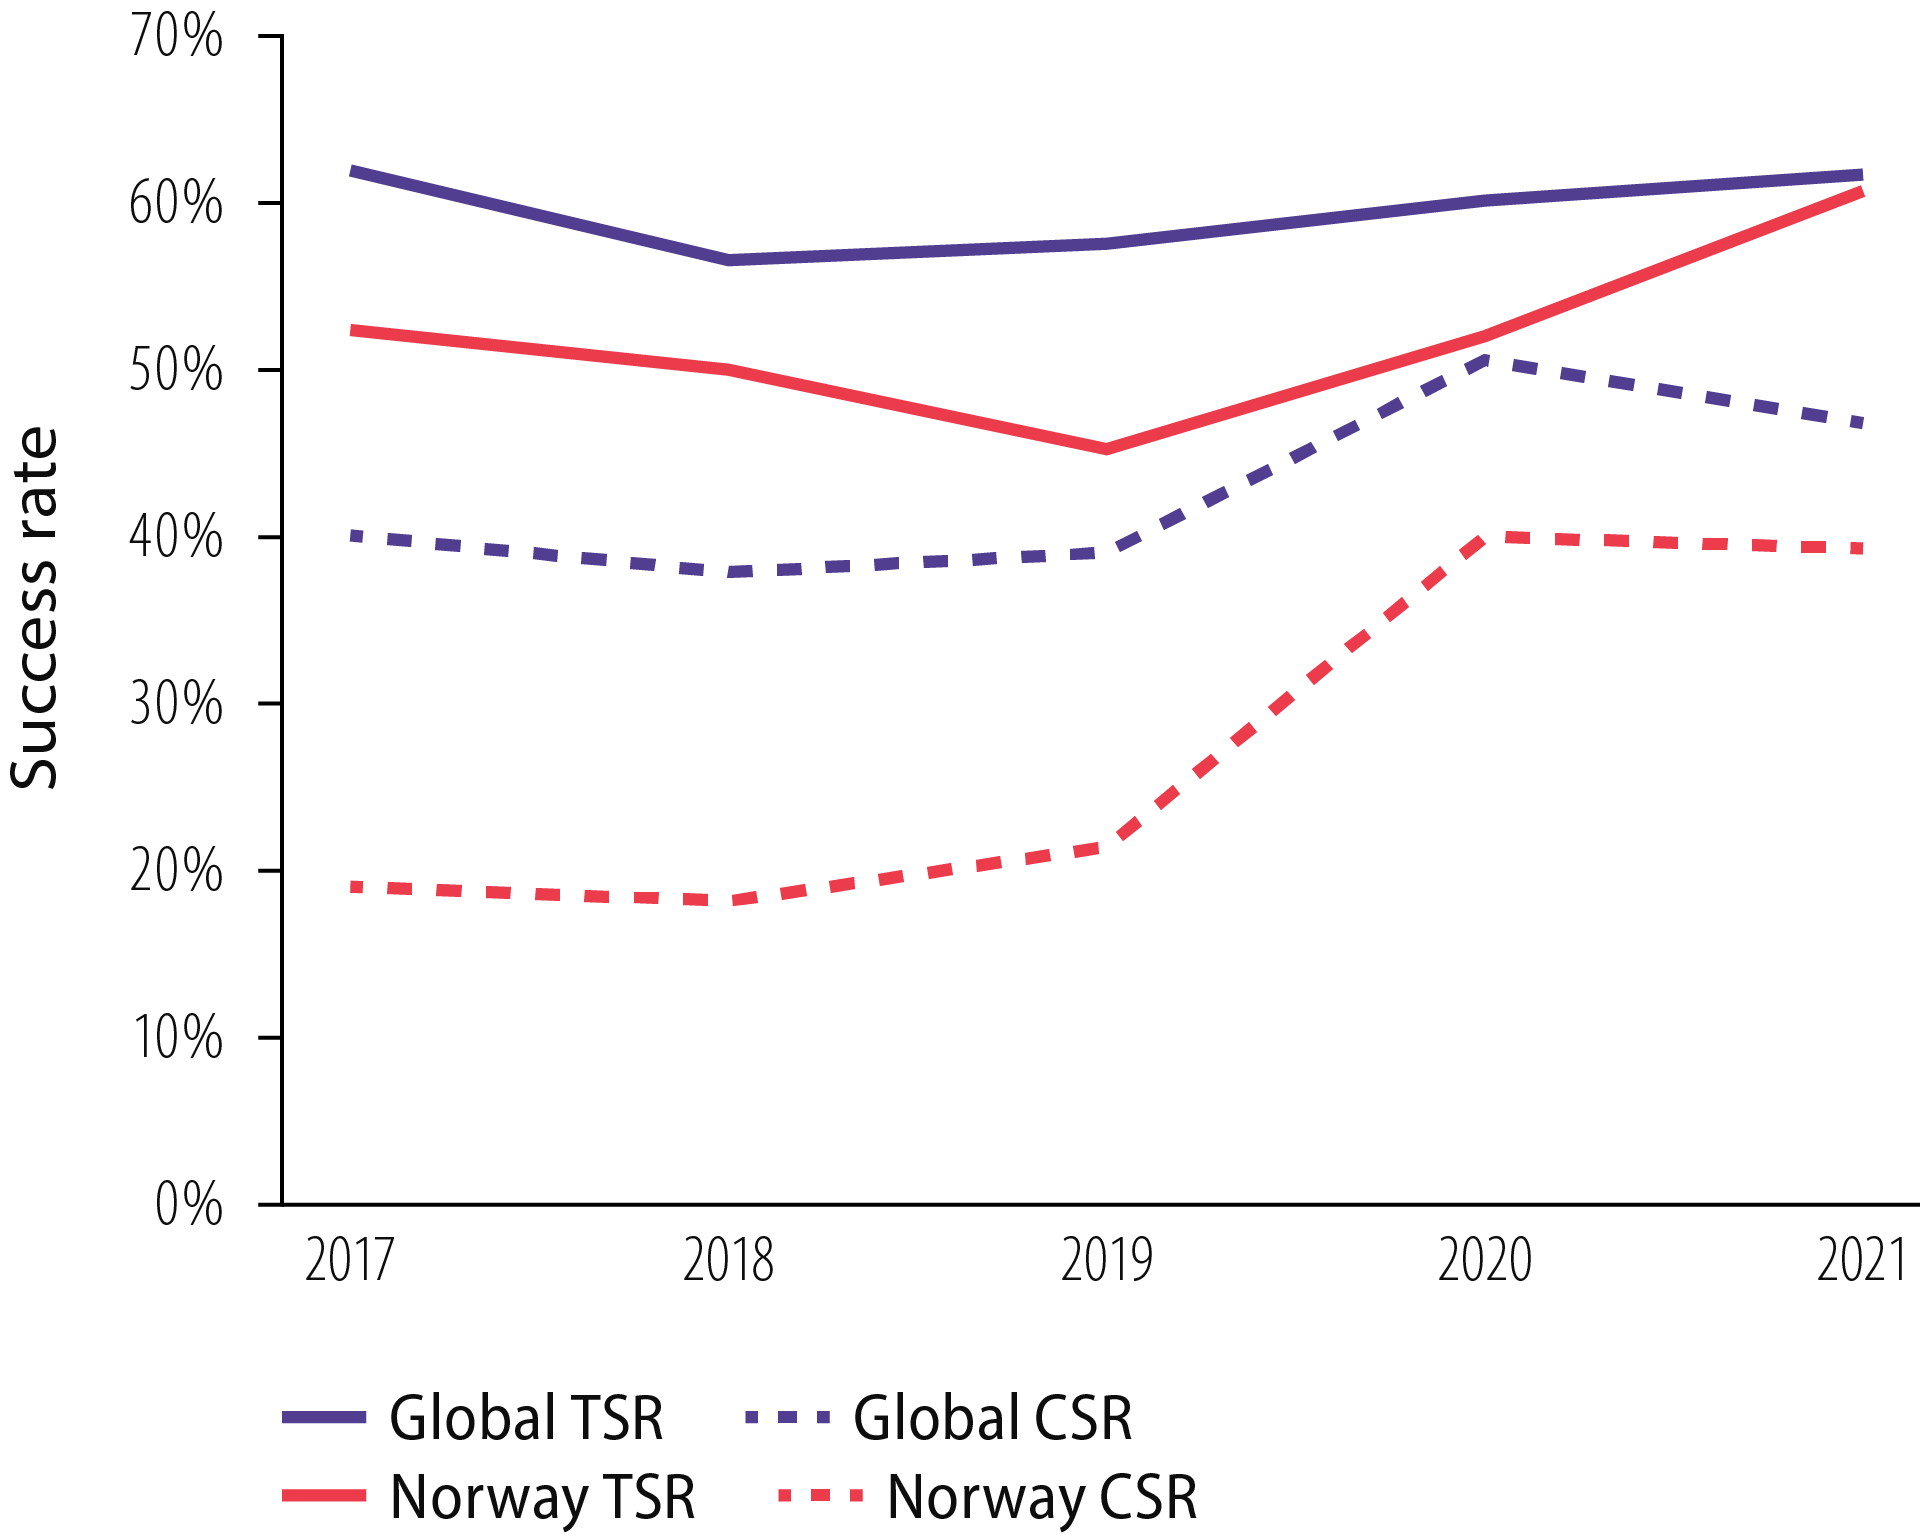
Figure 3.18 Development of technical (TSR) and commercial (CSR) success rates over the past five years Based on data from Westwood (2022)
Figure 3.19 Slim hole drilling
Early technology adoption and improvement are important for maintaining production and value creation on the NCS. Studies show that the industry devotes insufficient resources to research, technological progress and innovation in relation to what might be socioeconomically profitable [22]. In particular, the global petroleum industry is known for taking a conservative approach to adopting new technology [23]. The Norwegian authorities have therefore played an active role in this area. The NPD wants to ensure the players investigate and adopt new technology to an even greater extent in order to increase discoveries and development, and to reduce emissions.
Technology and expertise must be viewed in relation to each other. Innovative technology, particularly advanced digital solutions, calls for new expertise and skills. Making a commitment to technology yields results far beyond new technical solutions. A continuous concentration on building up and maintaining technology and expertise is therefore a key precondition for efficient and sustainable activity.
Norway’s petroleum industry is approaching the big "changing of the guard". A large proportion of its employees are set to retire during the coming decade, with the risk of losing experience and technical knowledge [24]. In order to maintain value creation, therefore, it will be important that the sector manages to attract new graduates. Another success factor is that the existing workforce adopts new technology and working methods.
Fact box – Dilemma: Digital solutions on Johan Sverdrup