
Preface
The Norwegian Offshore Directorate's primary objective is to contribute to the greatest possible values for society from the oil and gas activities through efficient and prudent resource management, where due consideration is given to health, the environment, safety, as well as other users of the ocean.
The Norwegian Petroleum Directorate has had responsibility of all of this for more than 50 years. Today’s world is vastly different from where we started out. When we changed our name to the Norwegian Offshore Directorate on 1 January 2024 it was, in part, a reflection of the new endeavours and challenges we have taken on, not least those related to CO2 storage and seabed minerals.
Let’s focus on the future. The vast resources we still have on the NCS will help supply the energy the world needs in the years to come. In fact, Norwegian oil and gas can be a key factor in addressing very real challenges, such as secure and stable energy for Europe. At the same time, interesting new concepts such as seabed minerals and CO2 storage could possibly be developed into profitable new industries, creating enormous value and bringing important contributions to the energy transition.
A long-term perspective is one of the essential building blocks in our resource management. This report illustrates opportunities, and outlines what’s needed to make sure our shared resources continue to generate value for the broader society. We need to be aware of the significant uncertainty linked to long-term value creation and ongoing development. These are broad considerations in every sense of the word – the geopolitical situation, climate policy in the EU and worldwide, developments in the oil and gas markets and in more concrete terms, evolving technology and overall costs.
Keeping all of this in mind, our long-term assessments need to reflect this uncertainty, while standing up to scrutiny in a rapidly changing world.
Our guiding objective is to promote good choices as we stake out a course to create more value in the future. We hope this report can facilitate better dialogue, increase understanding of both challenges and opportunities on the NCS, and can thereby unlock the best path forward. Working together, for the benefit of all.

Kjersti Dahle
Director technology, analyses and coexistence
It is with great sadness that we note the passing of two of our colleagues over the past year, Dag Helliksen and Kirsti Veggeland. We want to honour their legacy by dedicating this report to them.
Summary
However, realisation of these resources requires an ambitious path that will need careful consideration and hard work. Forecasts point to an expected decline in overall production on the NCS after 2025. Smart exploration and robust investments will be needed to curb this decline. If investments falter, the stage will be set for a rapid dismantling of our petroleum sector.
Extraction of seabed minerals, CO2 storage and offshore wind could become profitable new industries; assuming they prove themselves cost-effective, and that they can stand up to competition with alternatives. These new industries are also well-suited to reinforce and benefit from already established value chains and the many lessons already learnt.
Oil and gas going forward to 2050
The Norwegian Offshore Directorate seeks to provide data and analyses to support decision making for developing the NCS. The preparation and development of alternative scenarios for total oil and gas production up to 2050 is a key part of these efforts. All three scenarios presented here do indeed indicate production decline, but with very different trajectories.
What this production decline entails will ultimately come down to a number of factors including how much exploration is undertaken and how quickly, as well as the pace of technological progress and development. It’s worth noting that this generally accepted production decline is in line with the objectives of the Paris Agreement.
In the basic scenario multiple discoveries are made and brought on stream, accompanied by investments aimed at increasing recovery from existing fields. Despite this, resource growth will not be sufficient to offset the overall gradual decline, due to diminishing production from the major, mature fields.
In contrast, the high scenario will mean vigorous exploration, many discoveries, rapid technological development and eager investors willing to take a chance on the NCS, bolster production and thus help mitigate shrinking government revenues up to 2050.
Finally, a look at the low scenario reveals sluggish exploration activity and investment, thus leading to rapid dismantling of the petroleum sector and the inevitable significant drop in revenue for the government.
Substantial resources still in the ground
The NCS still contains large undiscovered oil and gas resources. To secure our objective to maximise the value of the resources on the shelf, the resources first need to be found. Finding these resources will mean more exploration, both in more frontier areas and close to the extensive infrastructure already in place.
There are interesting opportunities when it comes to undiscovered resources, both in familiar and less-explored areas. More extensive and detailed information, better data coverage, new work methods and pioneering technology open the door for fresh approaches in exploration, which could result in more profitable discoveries in the time ahead.
The ability to consistently incorporate new learning and the will to seek new knowledge and develop new technology are also important contributors that can enable us to unlock the values in challenging reservoirs, and also in smaller discoveries. And development of advanced methods to improve recovery from existing fields represent a very significant upside potential.
Profitable exploration
There is no question that exploration is a profitable activity. The Norwegian Offshore Directorate conducted an analysis of exploration activity over the past 20 years which confirmed that exploration for oil and gas on the NCS helps deliver incredible value for the broader community.
In concrete terms, we’re talking about more than 2000 billion Norwegian kroner (net present value). In fact, discoveries have generated value amounting to more than three times the costs devoted to exploration during this period.
Discoveries that have resulted in actual production have already offset total costs for all exploration investments in this period. The current track record shows a respectable 50 of 190 discoveries achieving development and production. That leaves around three-quarters of the discovered resources still waiting. The investments already made will continue to generate revenue as more discoveries come on stream.
Another takeaway from the analysis is that, while larger discoveries contribute most to value creation, a combination of many small discoveries can also deliver very substantial value across the board.
Robust activity
A large number of PDOs (plans for development and operation) were submitted to the Ministry of Energy in 2022, all of which secured approval during the course of 2023. The spike in PDO submissions can mainly be attributed to the temporary changes in petroleum taxation introduced in 2020.
These changes have helped facilitate more developments, paving the way for a swifter path from planning to production. The Directorate’s analysis confirms that this has had a substantial positive impact on value creation.
Increased gas export capacity from the Barents Sea
The Norwegian Offshore Directorate’s projections indicate that nearly two-thirds of all undiscovered resources are in the Barents Sea. The challenge here is that, without a firmer commitment to increase gas export capacity, these gas resources and values could remain locked in the subsurface for quite some time.
Designing and building more extensive infrastructure in and around this area is a prerequisite for developing oil and gas resources already proven. An increase in gas export capacity would also mean incentives for further gas exploration. There are a number of existing opportunities in the Barents Sea worthy of more detailed study.
Foundation for long-term production
What are Norway’s advantages? Vast remaining resources, well-developed infrastructure, low operating costs and stable, practical overall framework conditions. This tried and tested model suggests that Norway has what it takes to continue in its role as a competitive producer and exporter of oil and gas for the foreseeable future.
But there’s more. Huge volumes of CO2 resulting from power generation and industrial activity in Norway and Europe can be stored in the subsurface on the NCS. This presents a range of opportunities which are generating substantial interest and activity.
The Norwegian Offshore Directorate has also mapped significant mineral resources on the seabed which could contribute to the global supply of critical minerals. The first licensing round is expected to open in 2024. Time will tell whether this could prove to be an important new industry that can create value for Norway as a whole.
Background
In this chapter:
- Uncertain global landscape
- The world needs oil and gas
- The Norwegian continental shelf is competitive
- Need for considerable investments moving forward
- New industries on the shelf
The Norwegian continental shelf (NCS) has supplied Europe with oil and natural gas for more than 50 years. The efforts invested on the NCS have brought secure and stable energy to Europe, while simultaneously providing Norway with vast revenues. Norway is currently the largest producer of oil and gas in Europe.
Uncertain global landscape
The global population, as well as business and industry, need energy to function and to reach the UN's Sustainable Development Goals(1). Uninterrupted access to sufficient energy at acceptable prices is a prerequisite for sustainable economic progress and social welfare development. Procuring enough energy for a growing global population poses however a significant challenge.
With the exception of brief periods during economic crises, global energy consumption has increased year-on-year. Particularly rapid energy consumption spikes have been observed in important regions of the global economy during periods of high economic growth. Whereas developing countries are especially vulnerable in terms of underlying energy needs. Their growing populations need energy to meet basic needs and achieve their desire for a better life and higher standard of living.
Significant and rapid emission cuts, in line with the goals of the Paris Agreement, will require an energy transition involving extensive changes in global energy supply. Among other things, this includes energy efficiency measures, more development of renewable energy alongside new low-emission solutions such as carbon capture and storage (CCS). The energy and climate challenges the world is facing will need a range of simultaneous solutions.
Coal, oil and gas dominate the current, complex global energy system. This dependence leads to substantial greenhouse gas emissions, which have serious and irreversible consequences.
These energy sources have consistently accounted for around 80 per cent of the overall energy supply. More prevalent use of new energy sources has made significant additional contributions to existing sources, a factor which has been crucial in addressing rising energy needs. Furthermore, there is still extensive use of traditional biomass, with the associated challenges this brings for many low-income countries.
It will be challenging to implement the necessary transition of global energy systems quickly and the pace is uncertain. An energy system that is consistent with the goals of the Paris Agreement will however be entirely different from the system in place today. Renewable energy will be an important part of the solution, but as of today, it is difficult to predict which combination of technologies and solutions will prevail and succeed. Particularly when other societal considerations are also taken into account. The uncertainty surrounding future developments has therefore a direct impact on the need for the different energy sources.
Both commercial and political reasons have led various business sectors in the West to limit their investments in fossil energy, which to a lesser extent, are also being seen in other parts of the world. Many western countries have introduced measures to improve their energy security in the wake of Russia's invasion of Ukraine. At the same time, several major oil companies have tweaked their business strategies to reflect a more balanced split between oil and gas activities on one side and renewable energy on the other.
While European gas prices so far in 2024 remain far lower than the record prices in 2022 and the last half of 2021, prices are still high in a historical and global perspective. In Europe, the lapse of Russian gas deliveries has led to a significant increase in imports of liquefied natural gas (LNG). LNG represents a link, both physically and in terms of price, between the gas markets in Asia, Europe and the US.
The global balance and competition in the LNG market is one of the most important drivers behind the evolution of European gas prices. Developing countries that import LNG are most vulnerable to the impact of high gas prices, but even in Europe, this is a challenging price level for households, businesses and energy-intensive industry.
The world needs oil and gas
Oil and gas accounted for about 55 per cent of total global primary energy consumption in 2023(2). According to the International Energy Agency (IEA) and other analyst communities, there will still be a need for oil and gas in 2050, see figure 3.1.
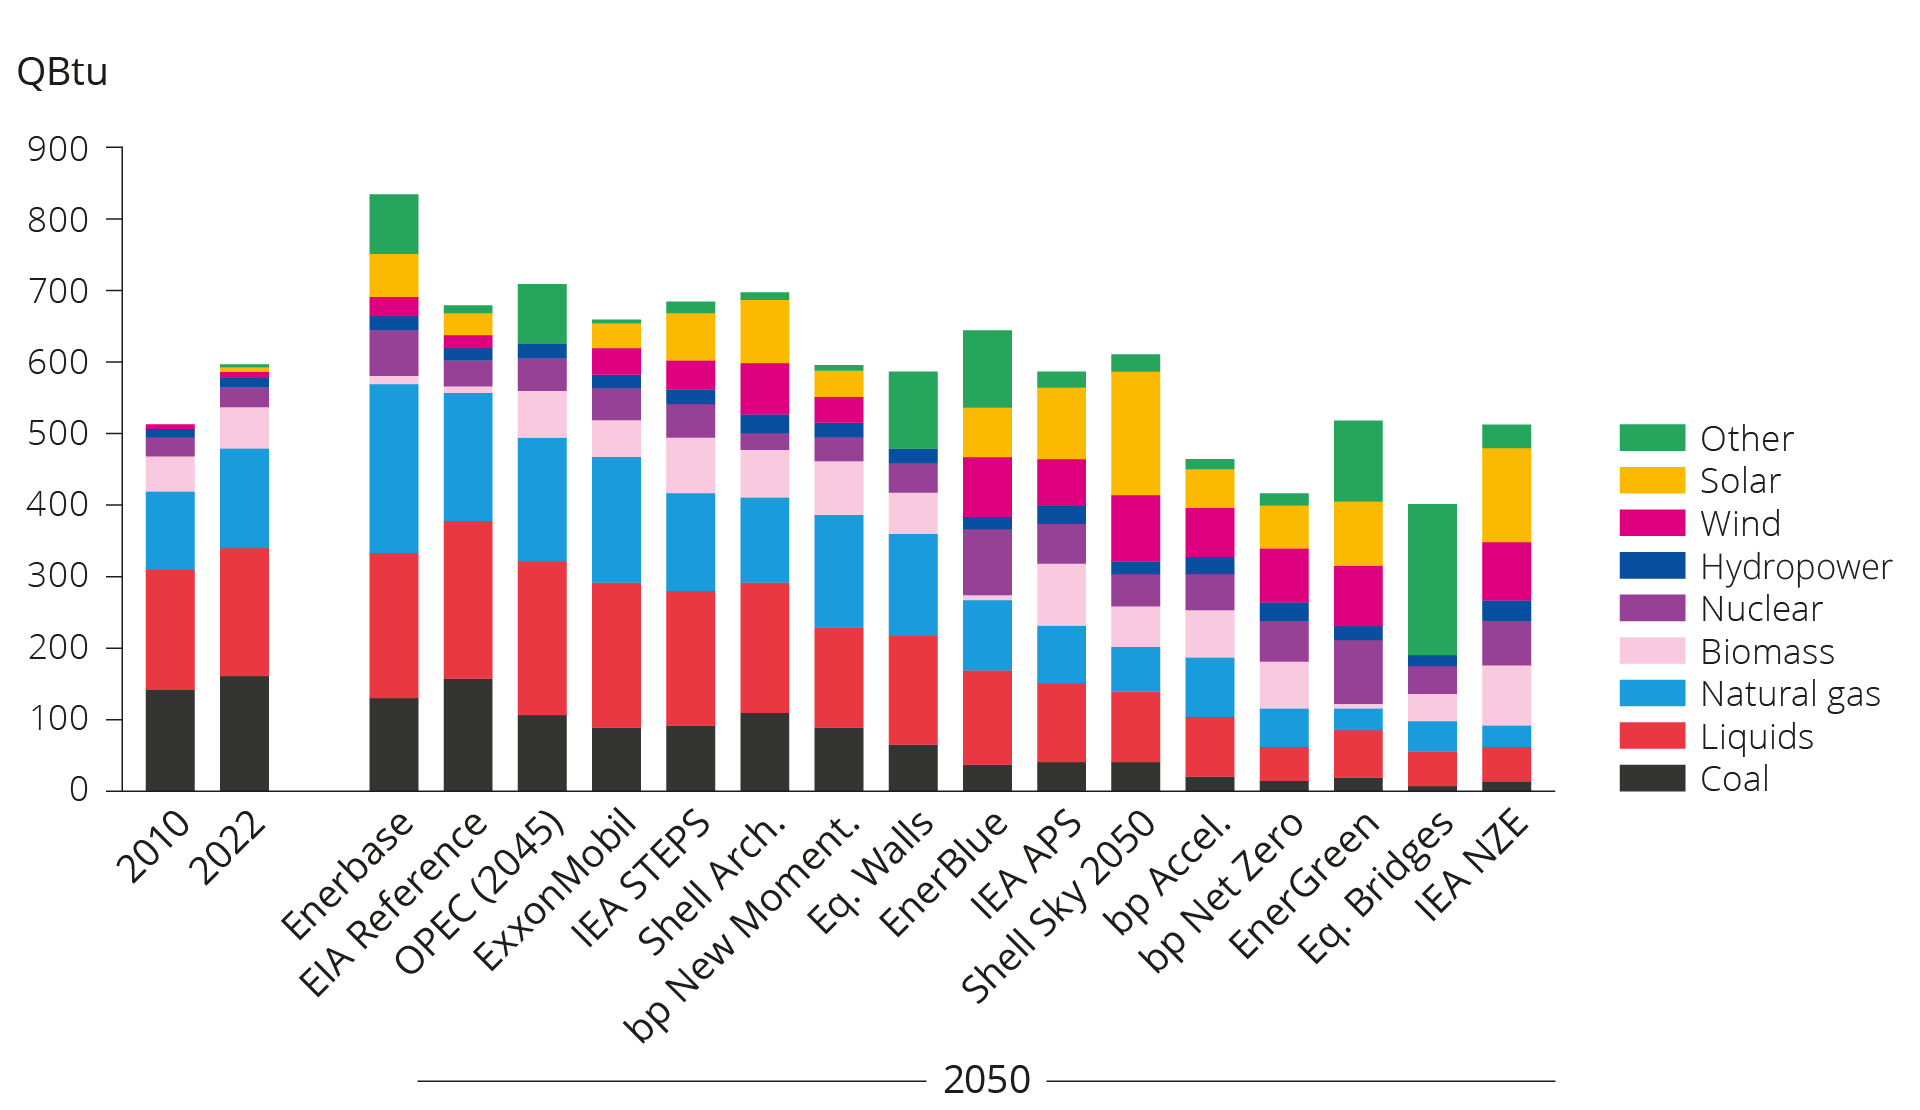
Figure 3.1 Global primary energy demand in 2050, different energy forecasts and scenarios. Source: Resources for the Future, 2024; British thermal units – Btu.
This figure was prepared by the US-based independent research foundation Resources for the Future (RFF)(3). Each year, RFF compares various selected long-term energy forecasts and scenarios in an effort to identify primary trends in global energy consumption and production. In most scenarios, global demand for primary energy will either grow modestly or decline toward 2050. This will be the case despite the substantial expected increase in global population. The main reason for this is a global economy that is becoming more energy efficient.
Six of the scenarios show increased demand for oil/liquids leading up to 2050, while demand for natural gas rises in eight, which is half of the scenarios. Consumption will remain high after 2050, despite a decline in demand for fossil energy. This will be the case even in normative scenarios where global warming is limited to 1.5 degrees Celsius.
As production from current oil and gas fields is subject to natural decline, considerable investments in new capacity will be needed in order to meet future demand. In relative terms however, the industry(4) expends less capital on new investments than on dividend and share buybacks, see figure 3.2.
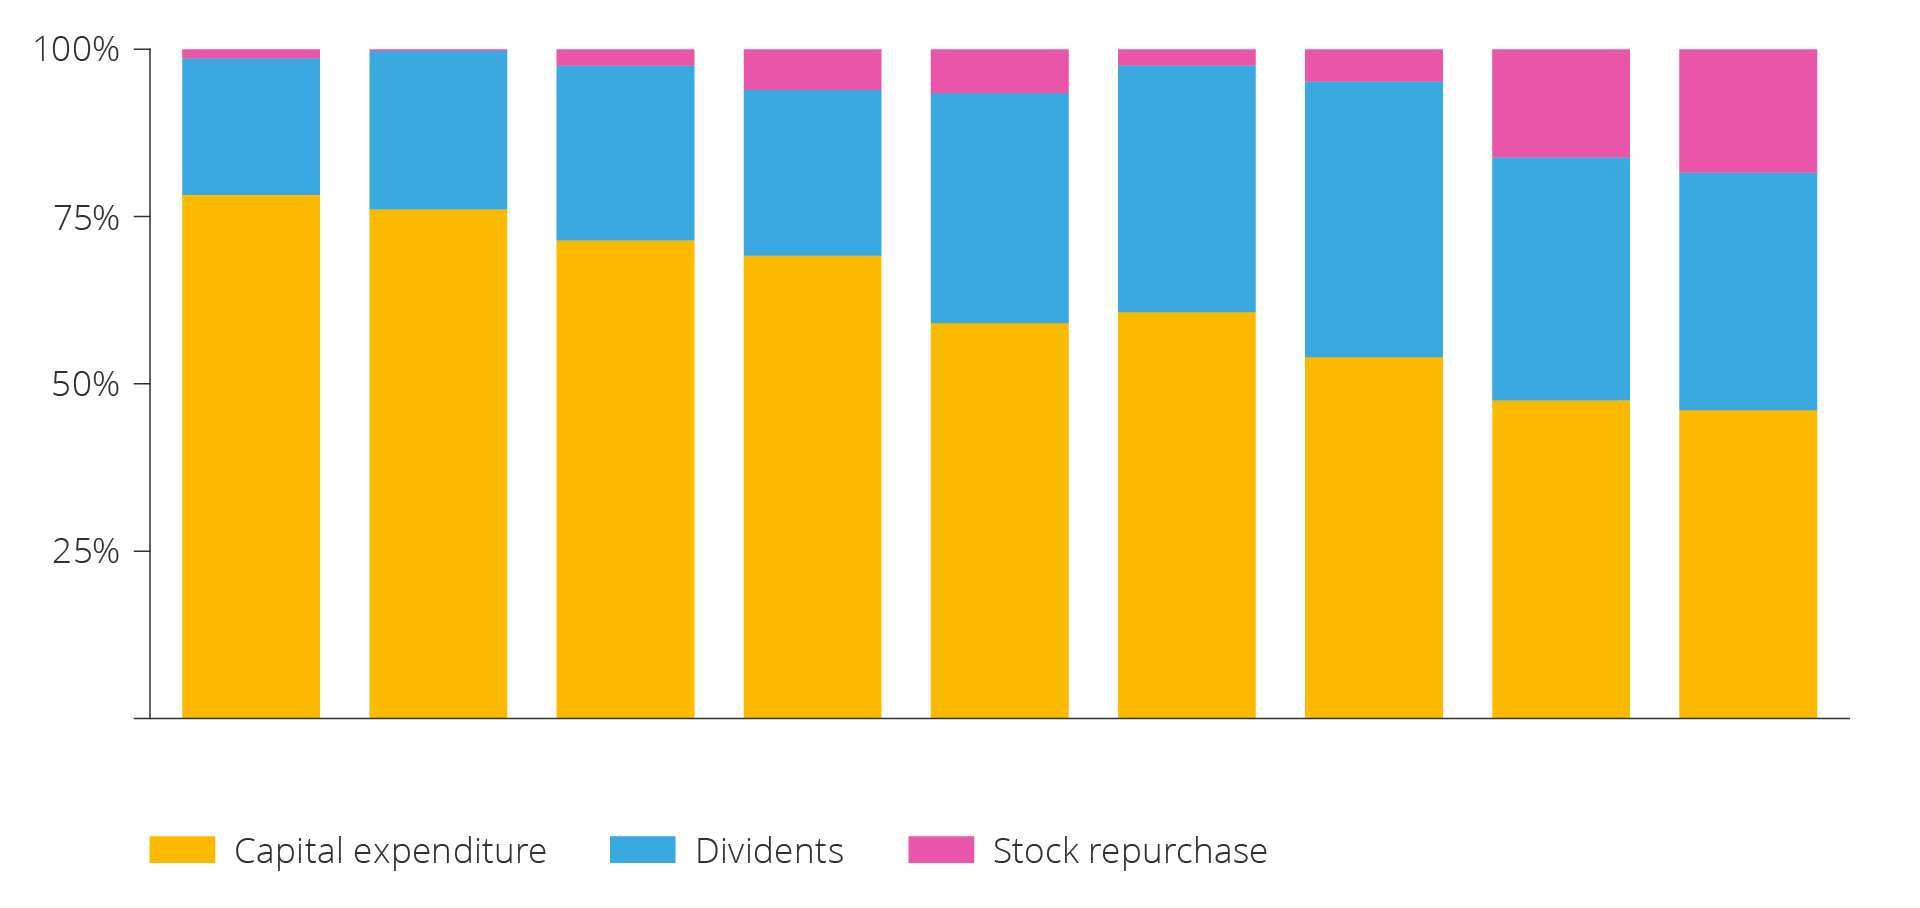
Figure 3.2 Expenditure on investments in exploration and recovery, dividend and share buybacks for the 30 largest oil and gas companies, 2015–2023 (Source: IEA 2024).
Companies will likely lean towards investing capital in oil and gas resources they find most profitable, which generally means oil and gas resources with low costs and low emissions per produced unit. These are often called 'advantaged' resources(5). The companies are therefore expected to seek out such advantaged resources, rather than investing in existing discoveries and fields challenged by high costs and emissions. Heavy oil and shale oil are examples of more challenged resources.
A study conducted by Wood Mackenzie(6) shows that there are few advantaged oil and gas resources available globally to meet future demand. Yet, these resources are plentiful on the NCS.
The Norwegian continental shelf is competitive
Nearly all oil and gas produced on the NCS is exported to Europe. This helps ensure a safe and stable energy supply for Europe.
The removal of Russian gas following the invasion of Ukraine laid bare the importance of stable gas deliveries from Norway to the rest of Europe. In 2022, Norway increased its gas exports by about 8 per cent or 9 billion scm (standard cubic metres). Deliveries from Norwegian fields have helped cover a higher share of Europe’s gas needs than before. The volume supplied by Norway now corresponds to about 30 per cent of the EU’s and UK's total gas consumption.
Without deliveries of these Norwegian resources, Europe would have a greater need to purchase LNG on the global market. This in return, would lead to a tighter global market, and would also have a greater impact on developing countries in Asia that need to import gas. Without deliveries from Norway, European gas and energy prices could be even higher.
Access to energy have increasingly become part of national security policies. Norwegian presence in the high north and Norway’s protection of critical societal functions such as gas infrastructure, will likely only become more important moving forward.
In spite of somewhat higher exploration and development costs compared with other petroleum provinces, the NCS is well-positioned to remain a competitive producer and exporter of oil and gas.
The relatively higher costs are caused in part by the fact that activities take place far out at sea and under challenging weather conditions. Substantial remaining resources, well-developed infrastructure, low operating expenses and stable framework conditions make the NCS an attractive investment opportunity, see figure 3.3(7).
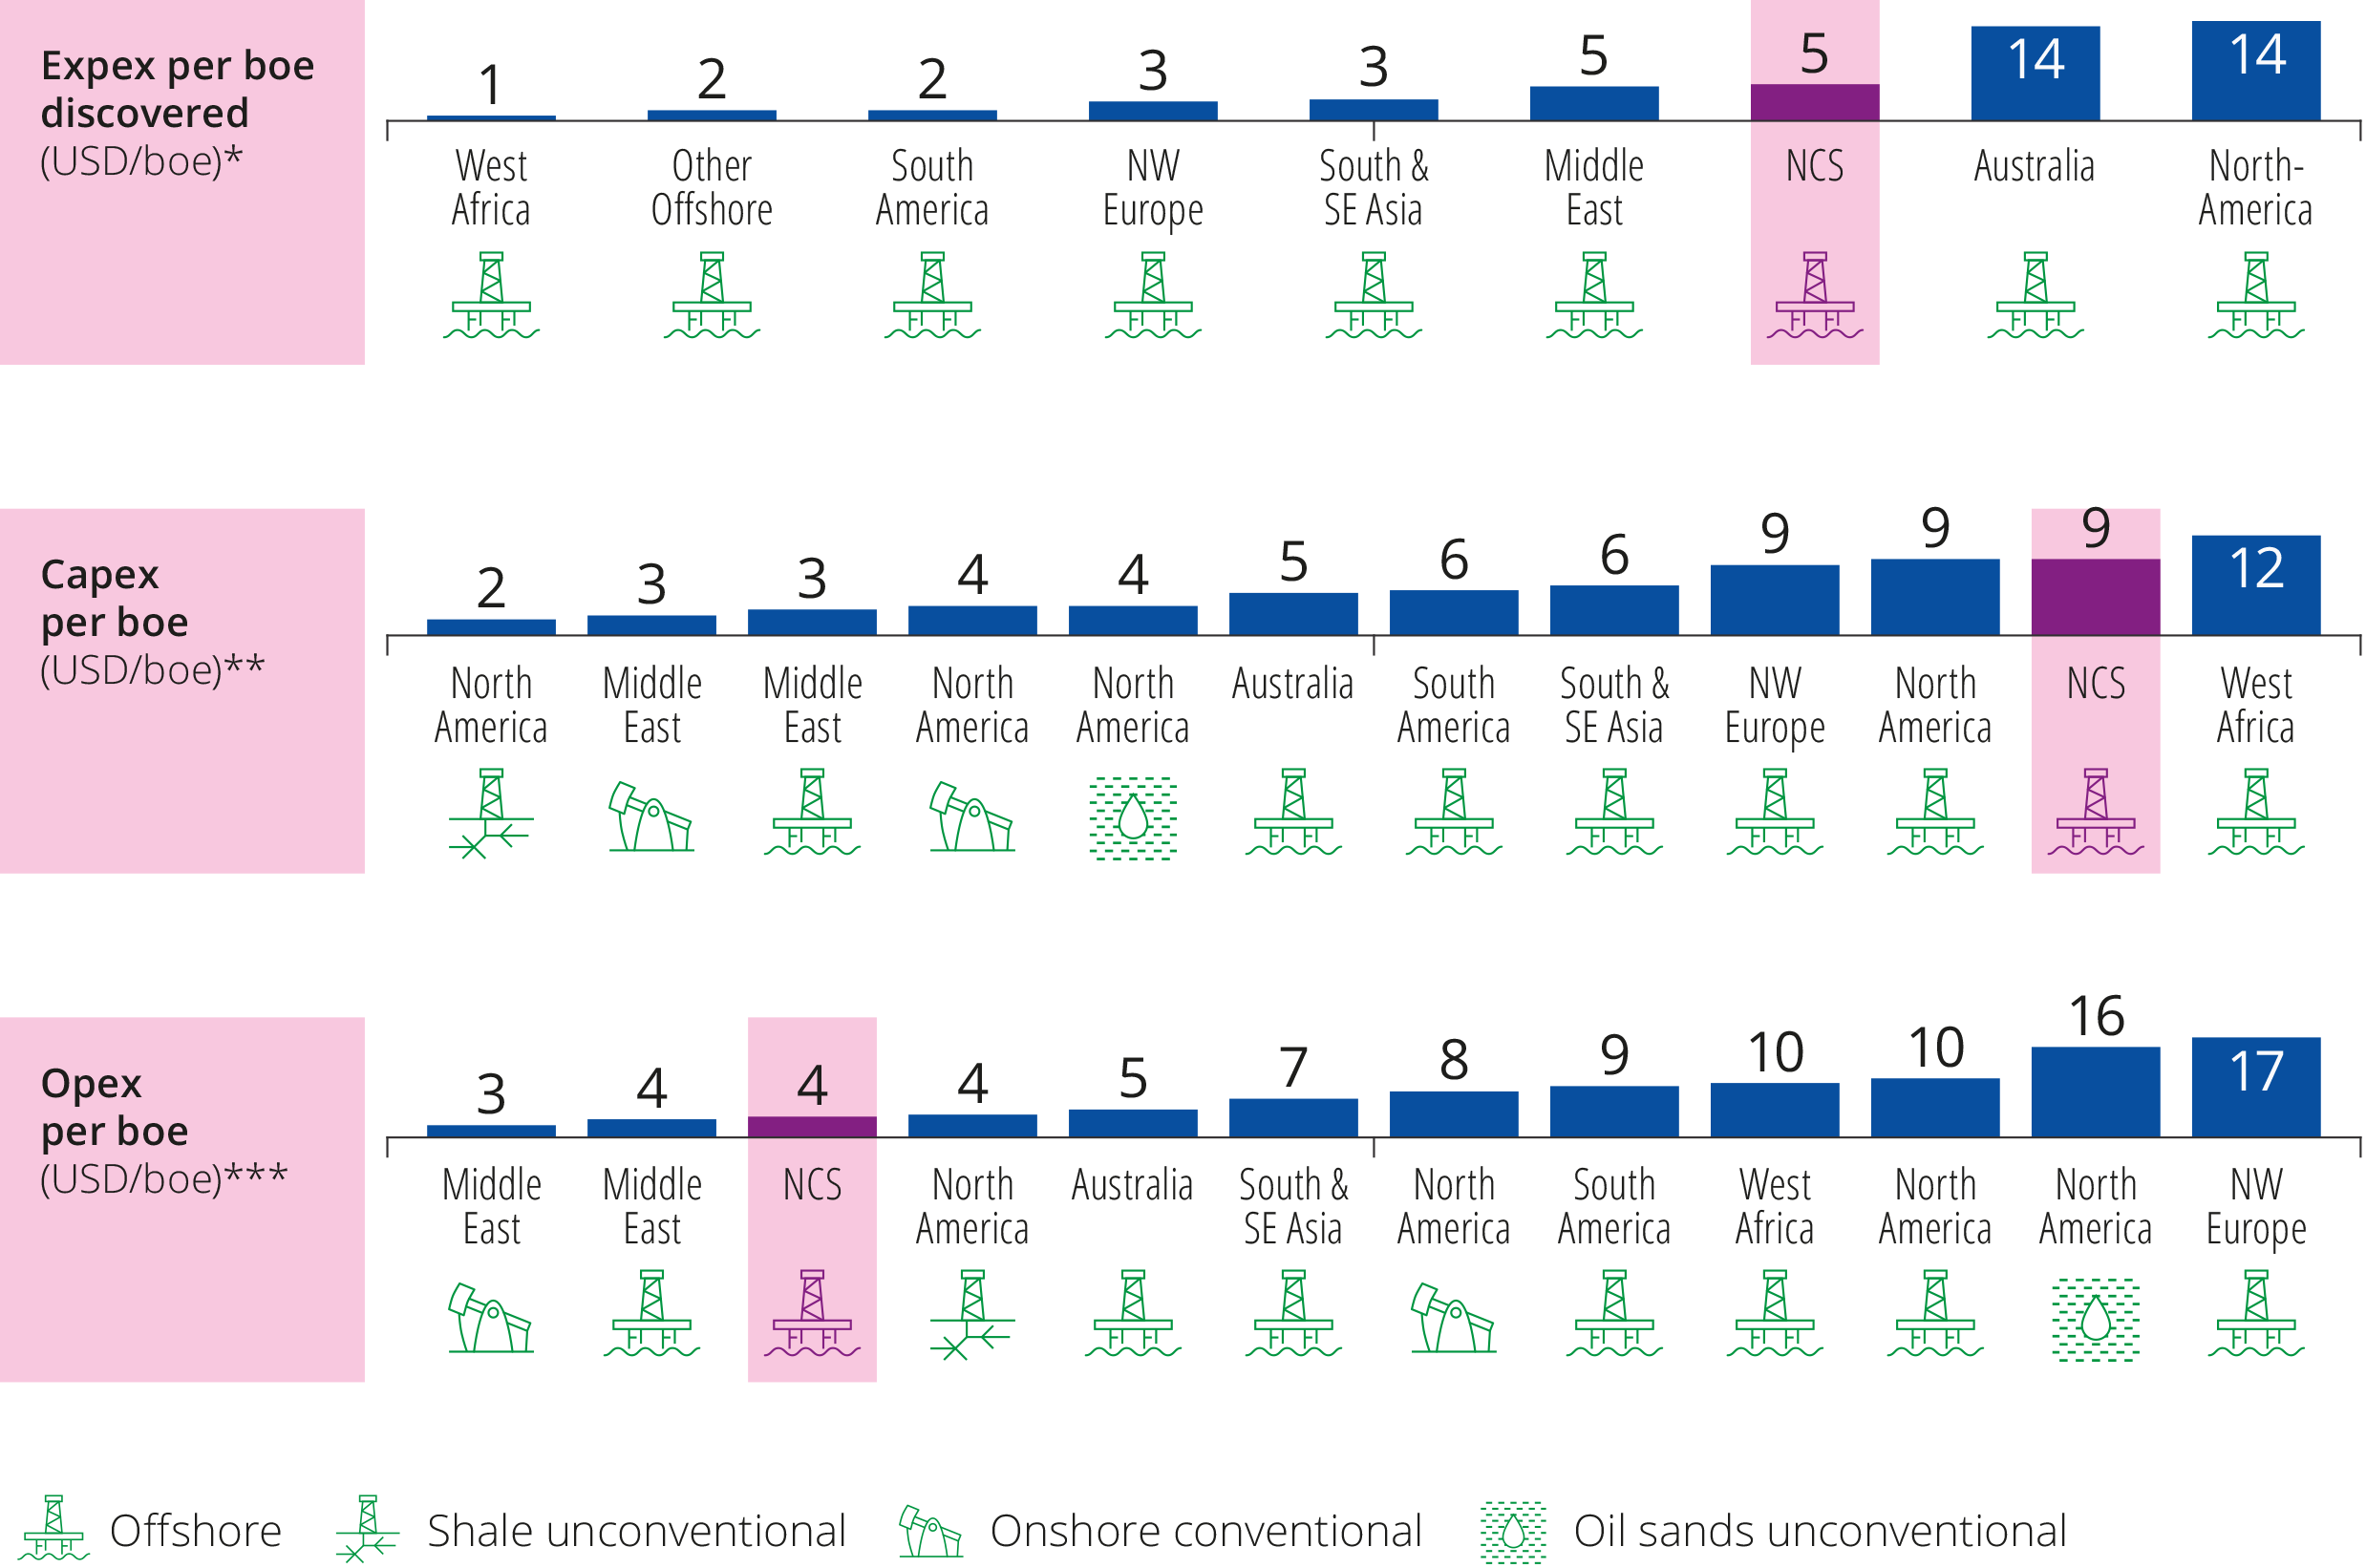
Figure 3.3 Unit costs for exploration, development and operations on the Norwegian shelf compared with other petroleum provinces in 2021.
*Exploration expenses per barrel; offshore only. Only includes commercial discoveries where public information is available. Average of 2019 and 2020.
**Greenfield capital expenditures related to sanctioned oil and gas fields in current year. Volume-weighted average of 2019 and 2020.
***Operating expenses do not include transport costs and tax. Only includes opex associated with the production of hydrocarbons in addition to sales, general and administrative expenses (Source: OG21 2021).
The NCS has very low greenhouse gas emissions per produced unit compared with other petroleum provinces, see figure 3.4(8).
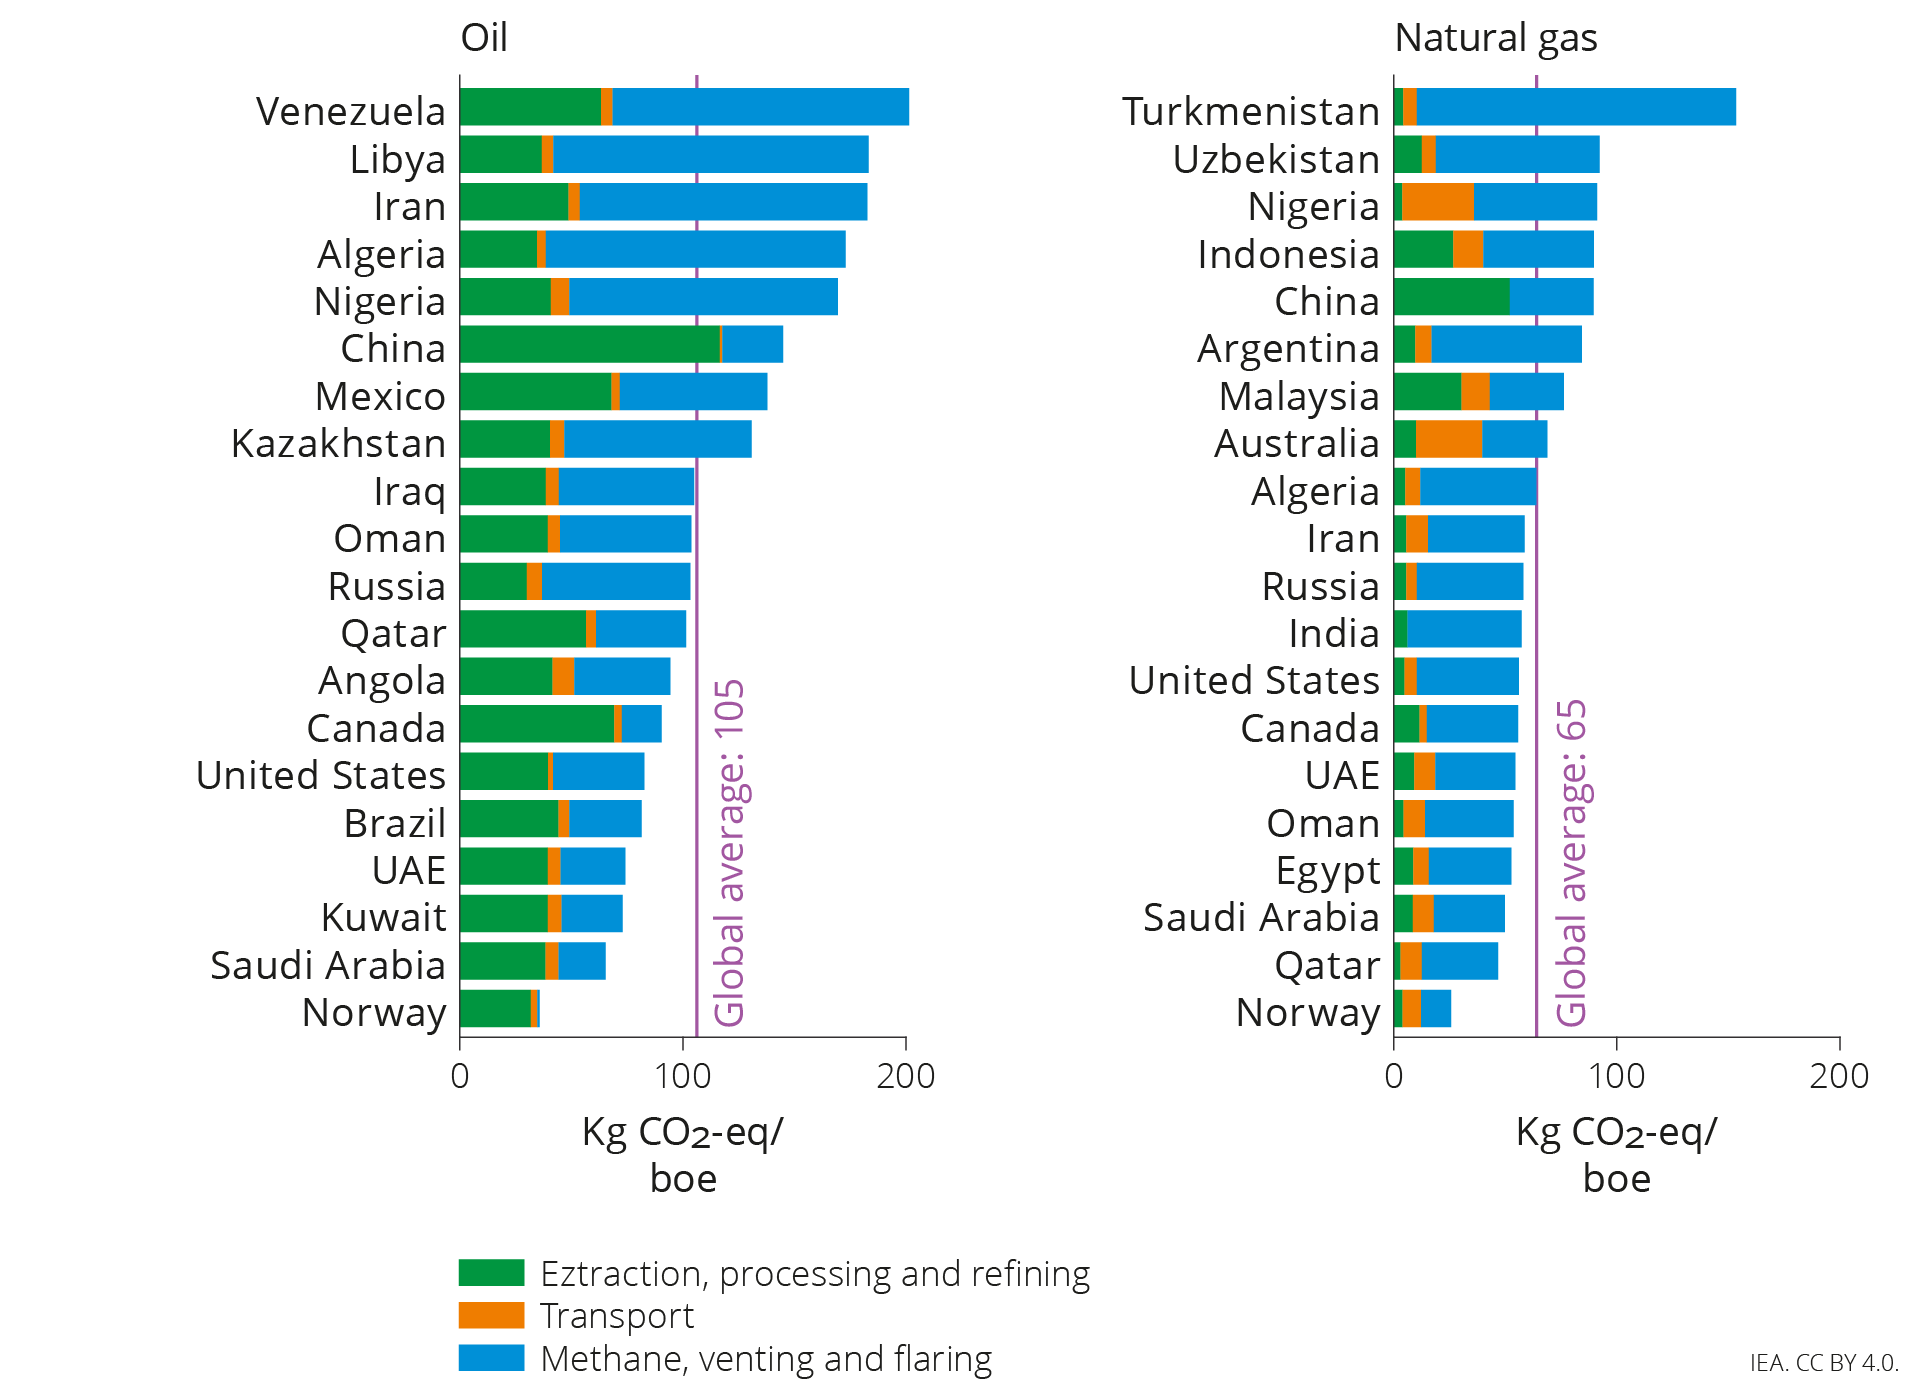
Figure 3.4 Comparison of average emission intensity in kg CO2 equivalent/bbls of oil equivalent in 2022 for the largest oil and gas producers (Source: IEA 2023b).
Need for considerable investments moving forward
Petroleum investments increased sharply in 2023 after declining for three years straight, see figure 3.5. Investments in field developments were the main contributor to the increase, while the rise in exploration was more moderate.
The increase in 2023 must be viewed in context with high petroleum prices and the temporary changes in the petroleum tax rules that were implemented in connection with the oil price plunge in the spring of 2020. This ensured that plans for development and operation (PDOs) for as many as 13 new field developments were submitted in 2022. Several investment decisions were also made for further development of operating fields and improved recovery on existing fields.
The high number of field developments will contribute to stable activity levels moving forward. In a longer perspective, the decline in remaining resources is eventually expected to lead to lower investments in oil and gas production.
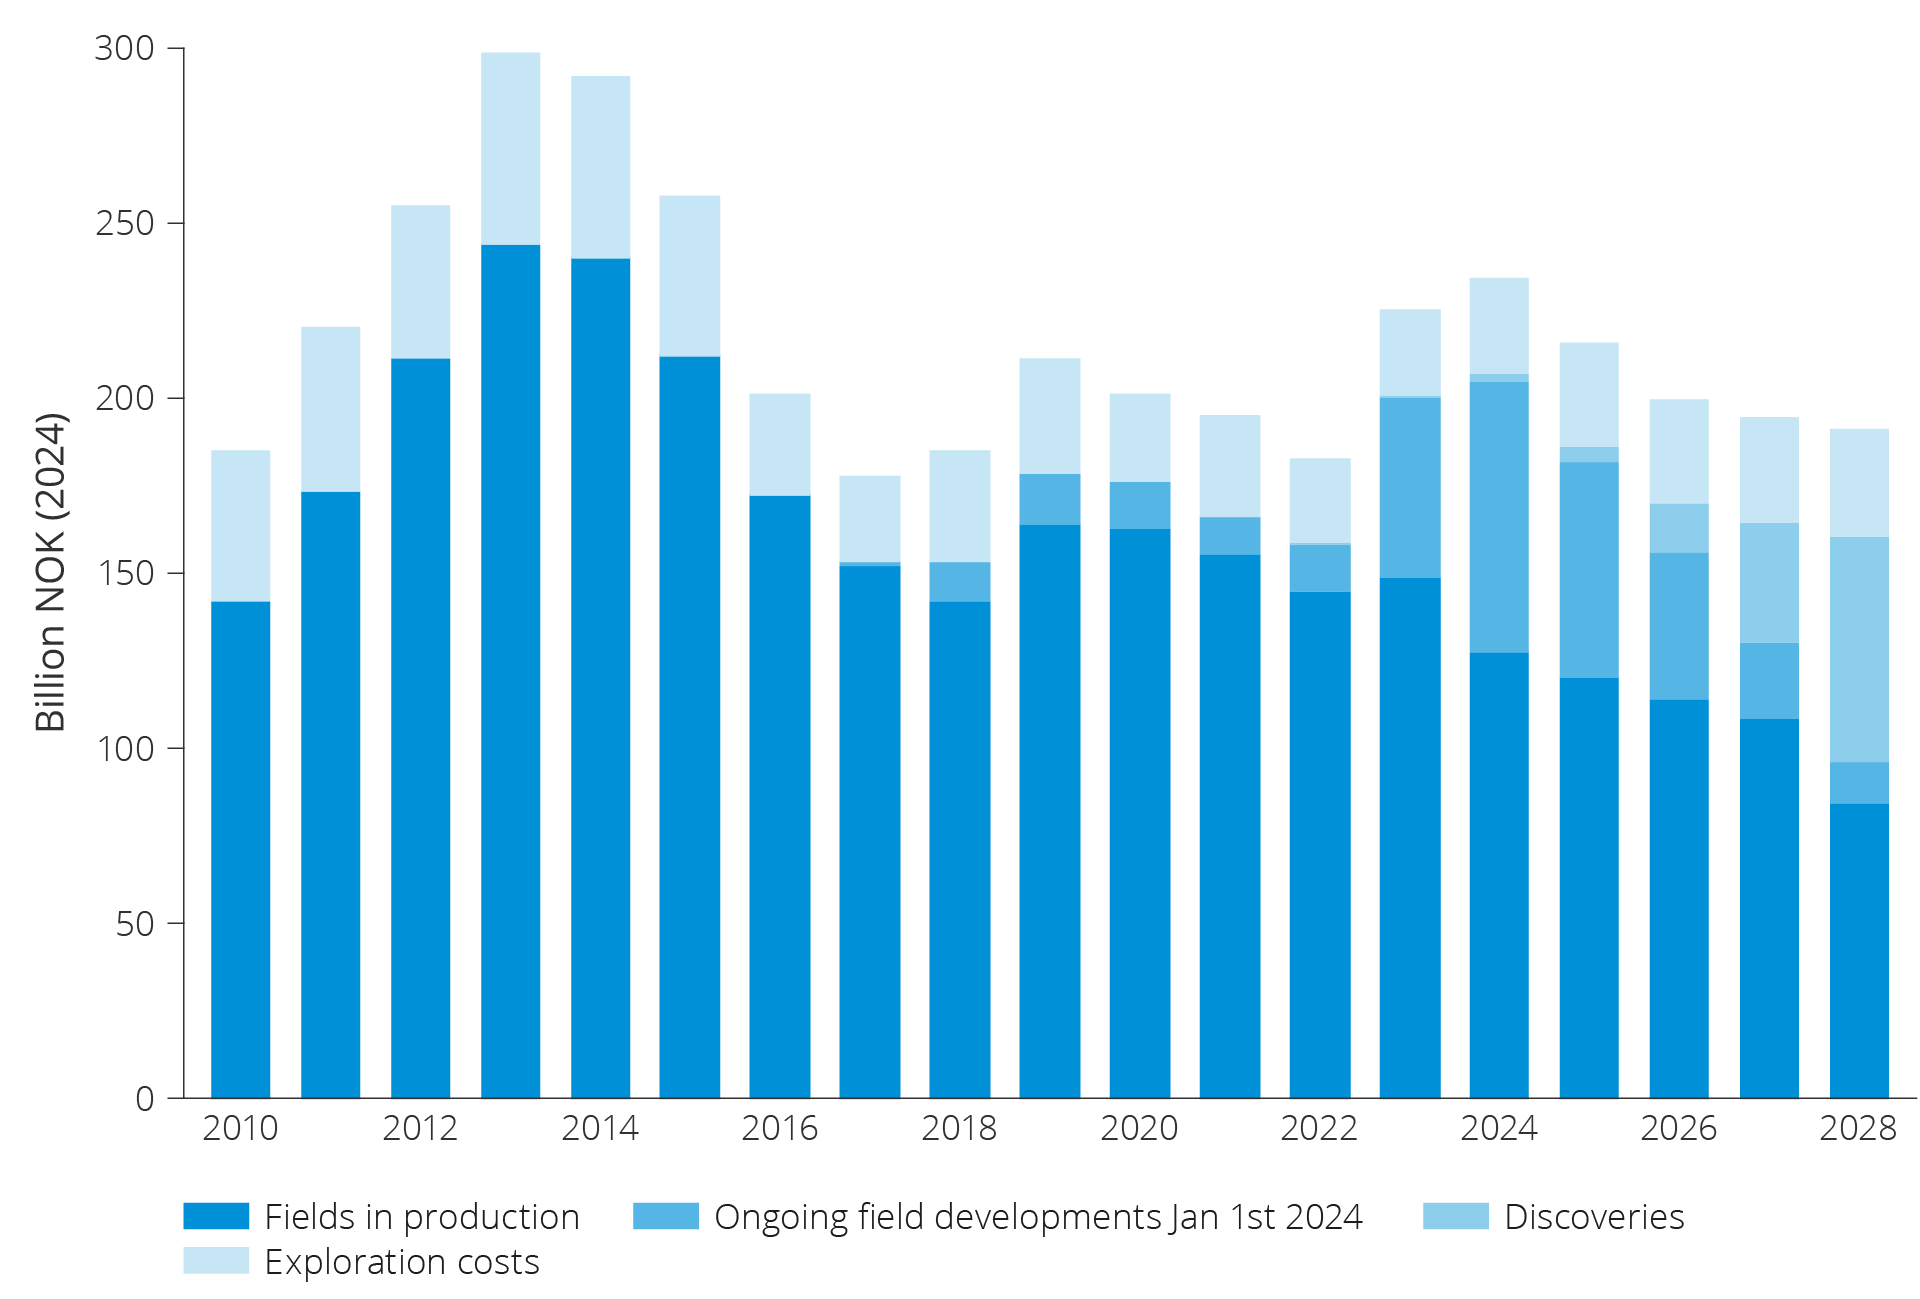
Figure 3.5 Historical petroleum investments and projections for future petroleum investments on the NCS.
Petroleum production on the NCS increased slightly in 2023 in relation to 2022, but has been on plateau more or less since 2021. It is below its highest level in 2010. At the same time, gas production declined somewhat from record-high levels in 2022. The production of petroleum has increased each year starting in 2020 (Figure 3.6) and is expected to increase further in 2024 and 2025. The Norwegian Offshore Directorate projects that the level in 2025 will be the highest since 2006.
Production from existing fields will presumably decline after 2025, and production and exports from the NCS will gradually start to fall if no action is taken.

Figure 3.6 Production history and forecasts by resource class (Resource Accounts as of 31 December 2023(7) RNB 2024).
In order to slow the decline in production, the companies will need to make more and larger discoveries and complete additional projects for improved recovery. The Norwegian Offshore Directorate's assessments indicate that In 2033, about one-half of total production will be from projects that have not been approved as of June 2024 (see resource classification below).
Resource classification
The Norwegian Offshore Directorate's resource classification system is used for petroleum reserves and resources on the NCS (figure). This system is structured in such a way that the authorities receive the most uniform possible reporting from licensees as input to the Directorate's annual updating of the resource accounts.
"Resources" is a collective term for all oil and gas that can be recovered. They are classified in the Norwegian Offshore Directorate's resource classification system according to their level of maturity, with regard to how far they have come in the planning process from discovery to production.
Developed in 1996, the classification system was revised in 2001 and 2016. Changes in 2016 primarily involved language improvements, including new designations for certain resource classes. The classification relates to the total recoverable quantities of petroleum.
The system is divided into three classes: reserves, contingent resources and undiscovered resources. All recoverable petroleum quantities are called resources, and reserves are a special category of these. Reserves are the petroleum quantities covered by a production decision. Contingent resources cover both recoverable quantities which have been discovered but are not yet subject to a production decision, and projects to improve recovery from the fields.
The classification utilises the letters "F" (first) and "A" (additional) respectively to distinguish between the development of discoveries and deposits, and measures to improve recovery from a deposit. Undiscovered resources are petroleum quantities which could be proven through exploration and recovered. The quantities produced, sold and delivered form aggregate historical production(8).
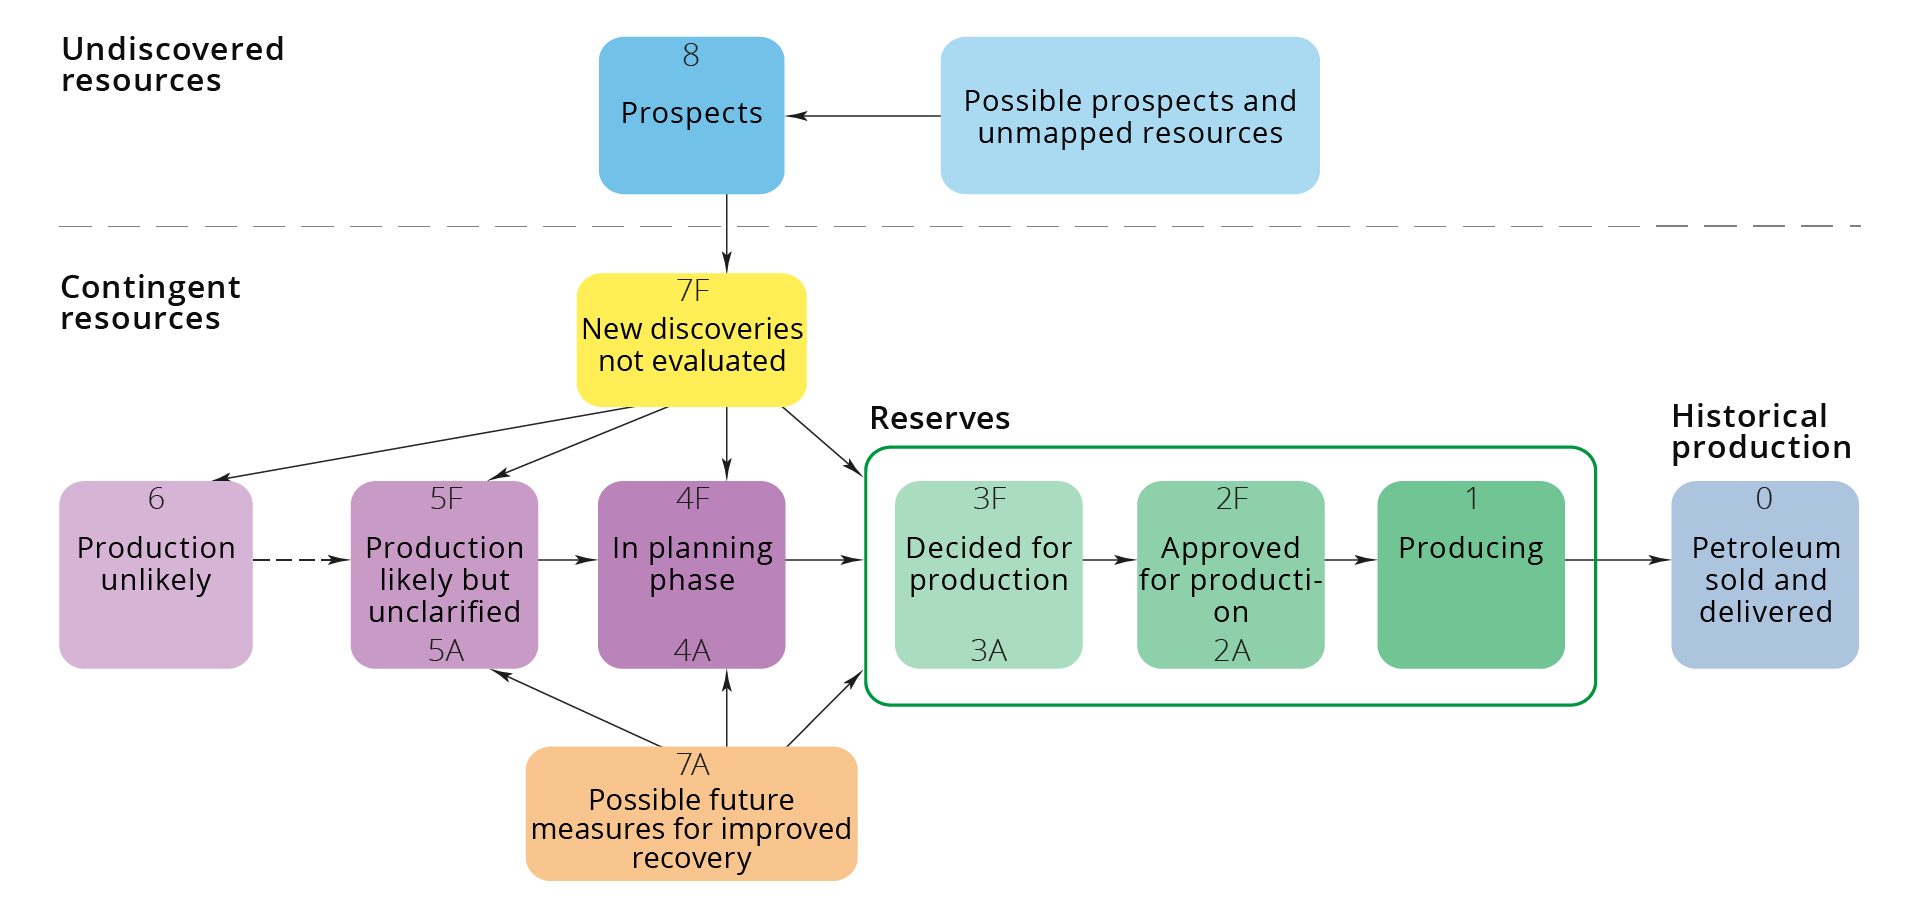
Figure The Norwegian Offshore Directorate's resource classification system 2016.
New industries on the shelf
The need to reduce CO2 emissions means that multiple facilities will be needed to capture and store CO2 (CCS). CCS involves capturing CO2 from power generation and industry and transporting and storing it safely in geological formations deep underground. There are several suitable formations on the NCS.
The energy transition will also lead to an increased need for renewable energy, which is dependent on multiple minerals and metals. Some of which can be found on the NCS.
Seabed mineral extraction, CO2 storage and offshore wind may turn out to be profitable new industries on the NCS, presuming they are cost-effective and can compete with the alternatives. The costs can likely be reduced by leveraging synergies with the established value chains. At the same time, the established value chains can be strengthened through decarbonisation.
DownloadThree potential scenarios
In this chapter:
- The petroleum sector is very important for Norwegian value creation
- Remaining resources lay the groundwork for high value creation
- Exploration and technology development increase the reserve base
- Three scenarios leading up to 2050
- Base scenario
- Low scenario
- High scenario
- Consequences for future production and value creation
The petroleum sector is Norway’s largest industry measured by value creation, government revenues, investments and export value. It has vast ripple effects on the mainland. Overall, this means that the industry is very important for the Norwegian economy and has been since the adventure started more than 50 years ago.
The petroleum sector is very important for Norwegian value creation
When Ekofisk was discovered in 1969, Norway’s GDP per capita (corrected for differences in price level and measured in shared currency) was just below the OECD average. Since then, value creation in the Norwegian economy has increased faster than in most other OECD countries, see figure 4.1.
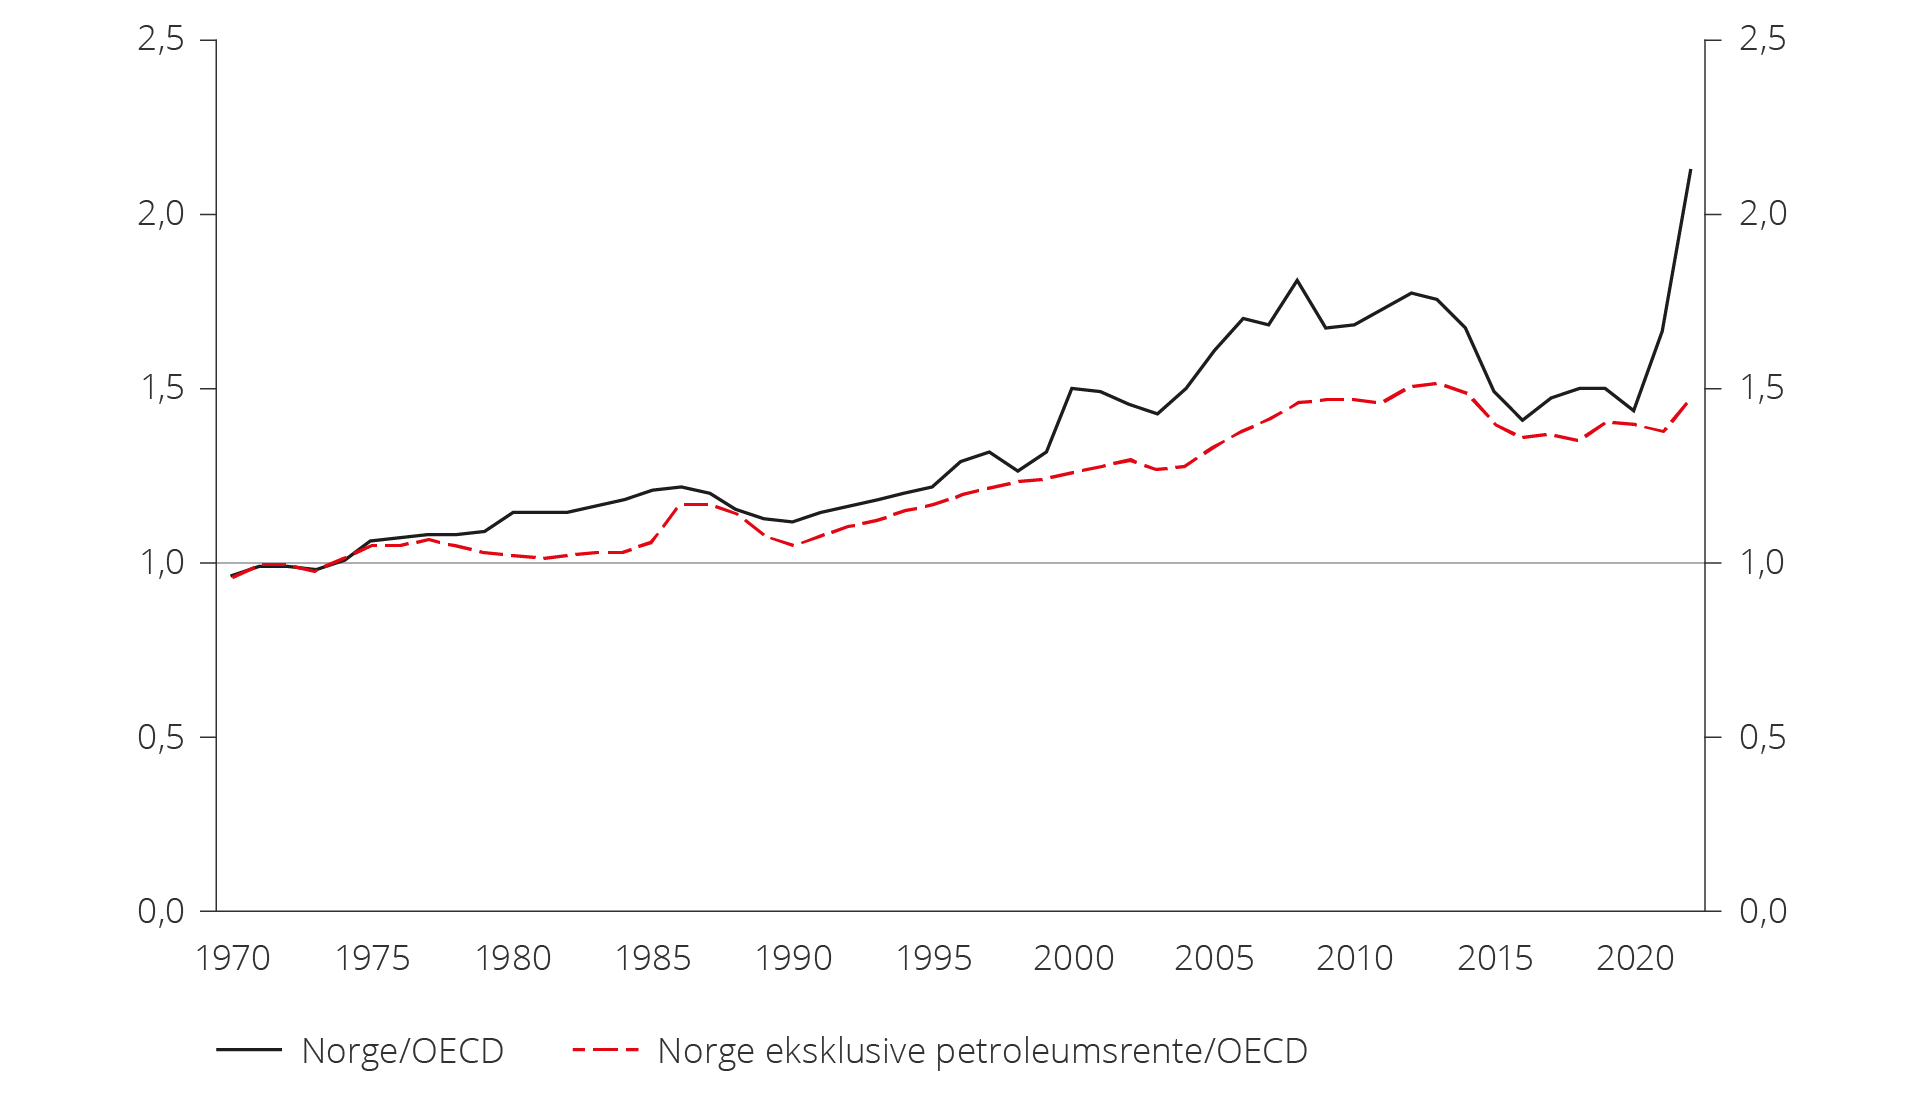
Figure 4.1 GDP per capita in Norway from 1970 to 2022 relative to the average of OECD countries during the same period (Source: NOU 2023:30).
Over the last five years, production of crude oil and natural gas, including pipeline transport, accounts for 22 per cent of GDP, see figure 4.2.
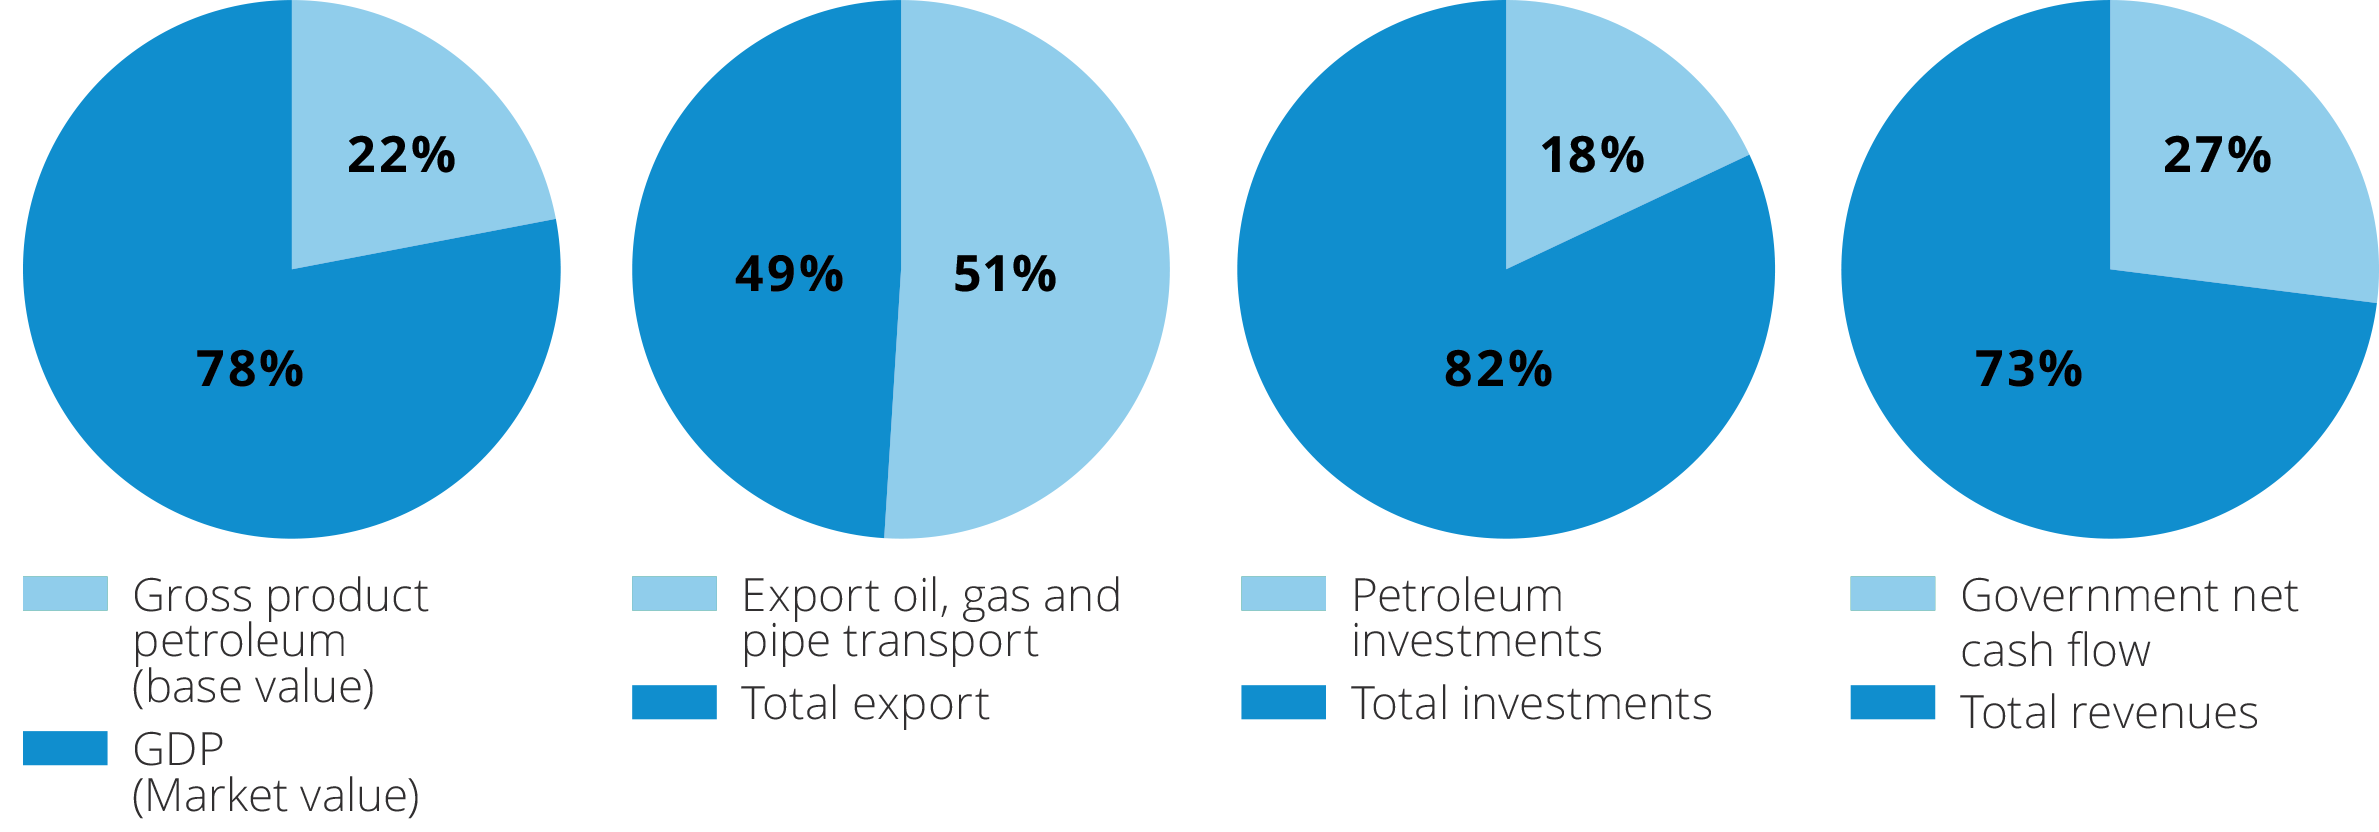
Figure 4.2 The petroleum sector's share of the Norwegian economy during the 2019–2023 period (Source: Statistics Norway and the Ministry of Finance).
During the same period, the value of exports of oil, gas and pipeline transport was 51 per cent of total exports. Furthermore, the petroleum activities account for 18 per cent of investments in capital stock and 27 per cent of government revenues.
Remaining resources are the foundation of high value creation
Remaining petroleum resources can be the foundation of significant production and value creation for several decades to come. The distribution of remaining resource volumes into resource classes along with the volume sold and delivered as per 31 December 2023 is shown in figure 4.3.
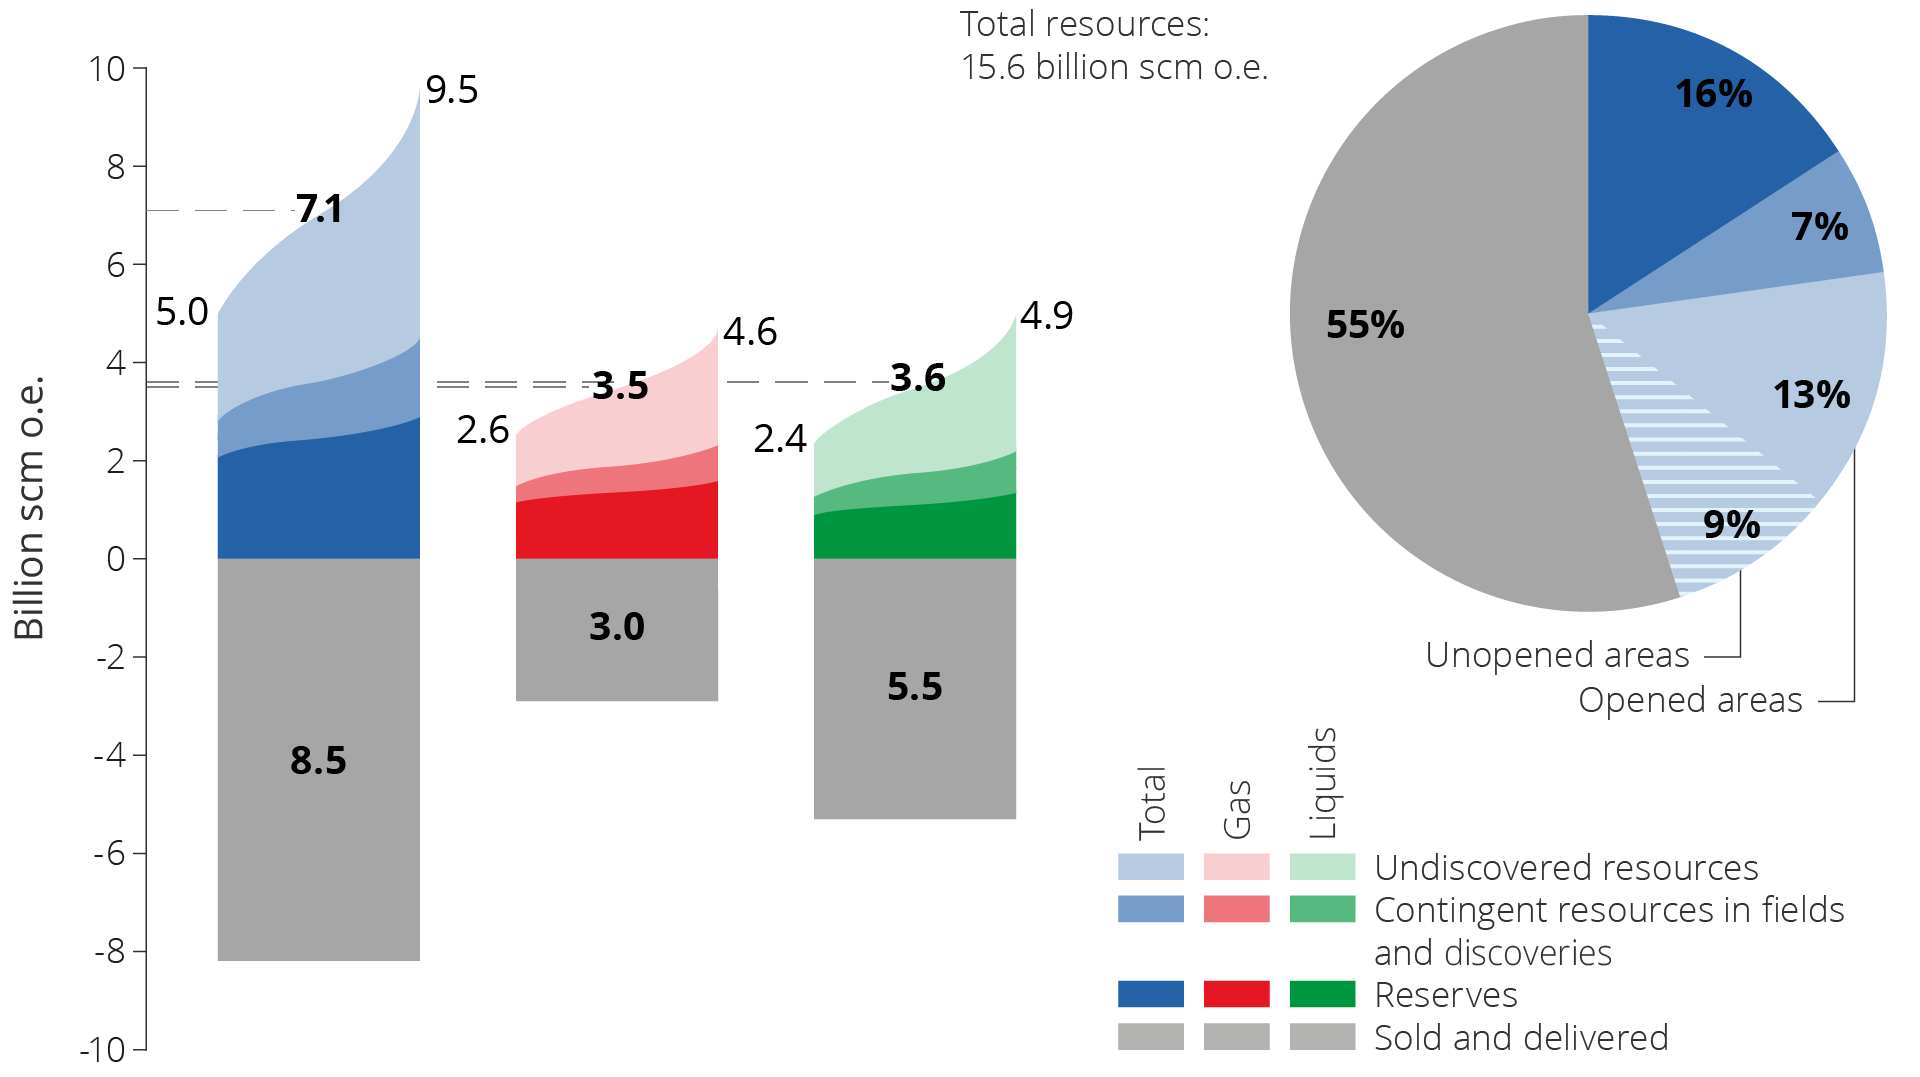
Figure 4.3 Petroleum resources and uncertainty in the estimates as per 31 December 2023.
The Resource accounts for 2023(11) estimate the overall expected resource volumes (including what has been sold and delivered) on the NCS at 15.6 billion standard cubic metres of oil equivalent (Sm3 of o.e.). The resources are distributed between 9.1 billion Sm3 of liquids (oil, condensate and NGL) and 6.5 billion Sm3 of gas.
Uncertainty in the resource estimates is illustrated with a low and a high estimate in the figure. The distribution is shown for both liquids and gas. The uncertainty in the volume estimates is greatest for the undiscovered resources and declines with increasing access to geological information. As a result of this, the uncertainty is greatest in areas that have not been opened for petroleum activities, which this report refers to as "unopened areas".
Uncertainty in resource estimates
Uncertainty expresses the range of possible resource outcomes or results. It is most frequently described with the aid of low and high estimates.
For example, the Norwegian Offshore Directorate estimates the undiscovered resources on the NCS to be between 1.9 - 5.7 billion scm oe. This uncertainty is calculated using a statistical method known as Monte Carlo simulations. The high and low estimates are described utilising statistical concepts.
Where undiscovered resources are concerned, the Norwegian Offshore Directorate uses P95 for the low estimate. This means that, given the assumptions applied in the analysis, the probability of a result equal to or larger than the 95 value is 95 per cent. P05 is used for the high estimate, which means a five per cent probability that the result will be equal to or larger than the P05 value.
The expected value is the average value. This is generally defined as the arithmetic mean of all the outcomes in the statistical distribution. Widely used, it has the property that the expected value for various distributions can be summed to give a sum of distributions. The expected value is normally somewhat higher than the P50 value.
Exploration and technology development increase the reserve base
Developments in exploration activity, successful exploration and how quickly technology development and implementation take place in the sector are all crucial for production and value development on the shelf. High exploration activity and rapid technological innovation can yield an entirely different production development than low exploration activity and slower technology development.
These factors are driven by underlying global and regional issues. Geopolitical developments, climate policy and the development of renewable energy have consequences for the energy markets and future oil and gas prices. This affects profitability and activity on the NCS.
As in other petroleum provinces, the NCS has historically seen a positive connection between oil price developments and the number of wildcat wells the following year, see figure 4.4.
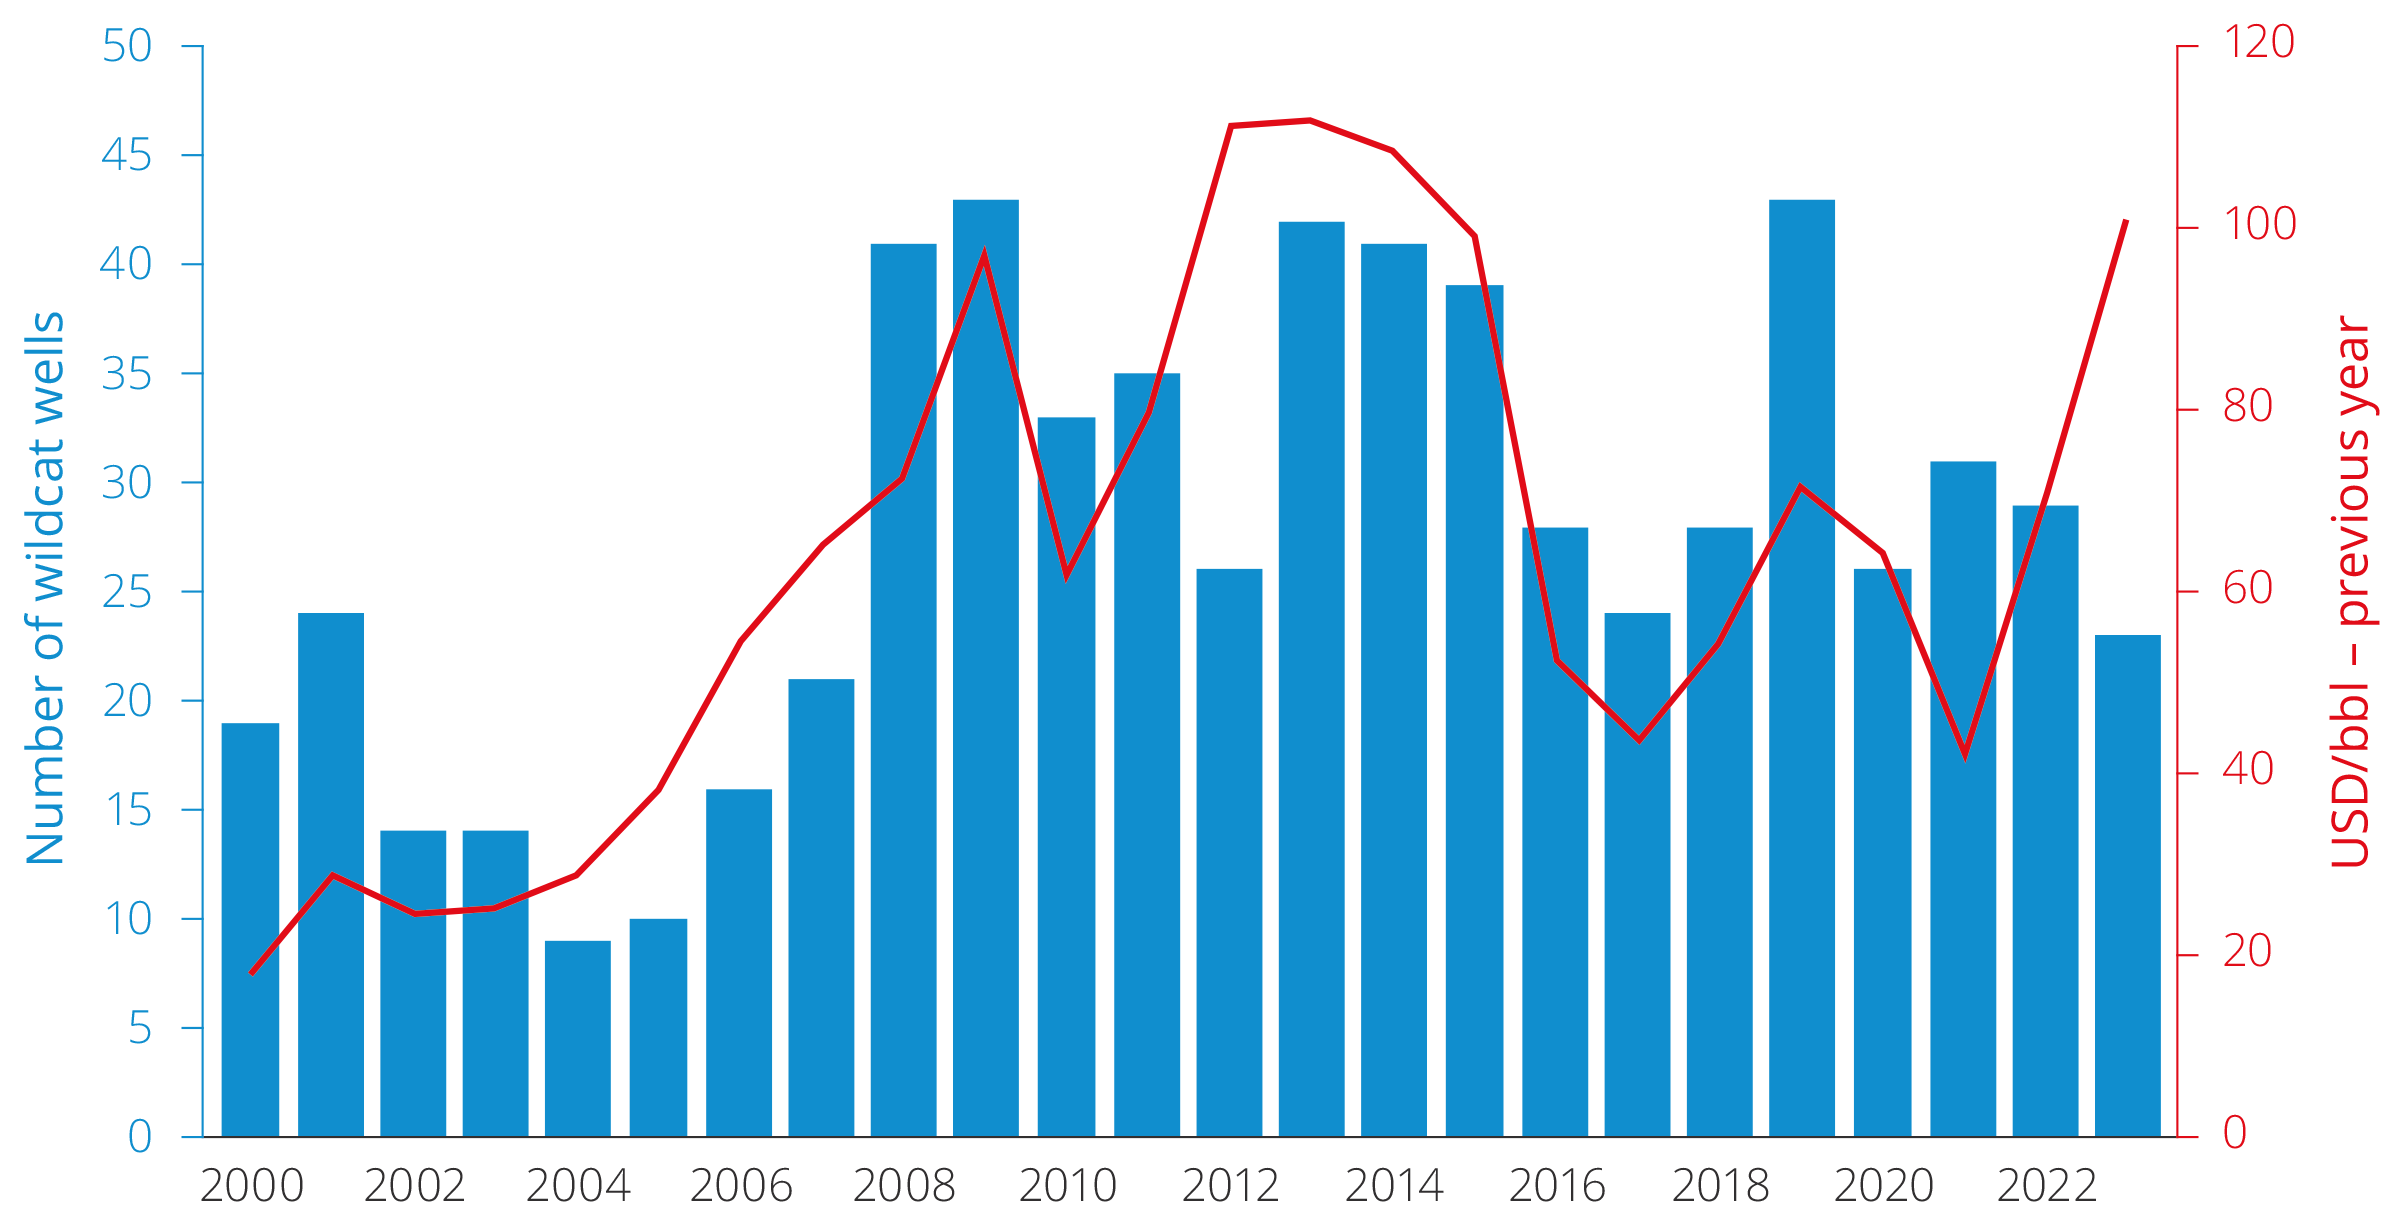
Figure 4.4 Number of spudded wildcat wells and oil price the following year (2000–2023).
Higher oil prices increase the value of new oil projects and companies' income, which in turn affects the exploration budgets. During high-income periods, oil companies tend to focus on increasing oil and gas resources by exploring more and taking greater exploration risks. Periods with lower oil prices and income see cuts to exploration budgets. Only projects with the highest expected profitability and lowest risk are prioritised.
In addition to the number of wildcat wells, technology development also affects reserve growth from new discoveries. Improvements in technology for imaging the subsurface have been crucial for high levels of exploration success.
As the resources become increasingly hard to find, the development and implementation of new technology will become even more crucial for future exploration success. At the same time, it is necessary to continuously review the professional basis and knowledge about the resources on the NCS.
Improvements in field development technology and drilling help ensure that more of the smaller and marginal discoveries become profitable for development. Considerable additional volumes can also be recovered by implementing advanced recovery methods. One example is recovery from tight reservoirs (chapter 5 and chapter 6).
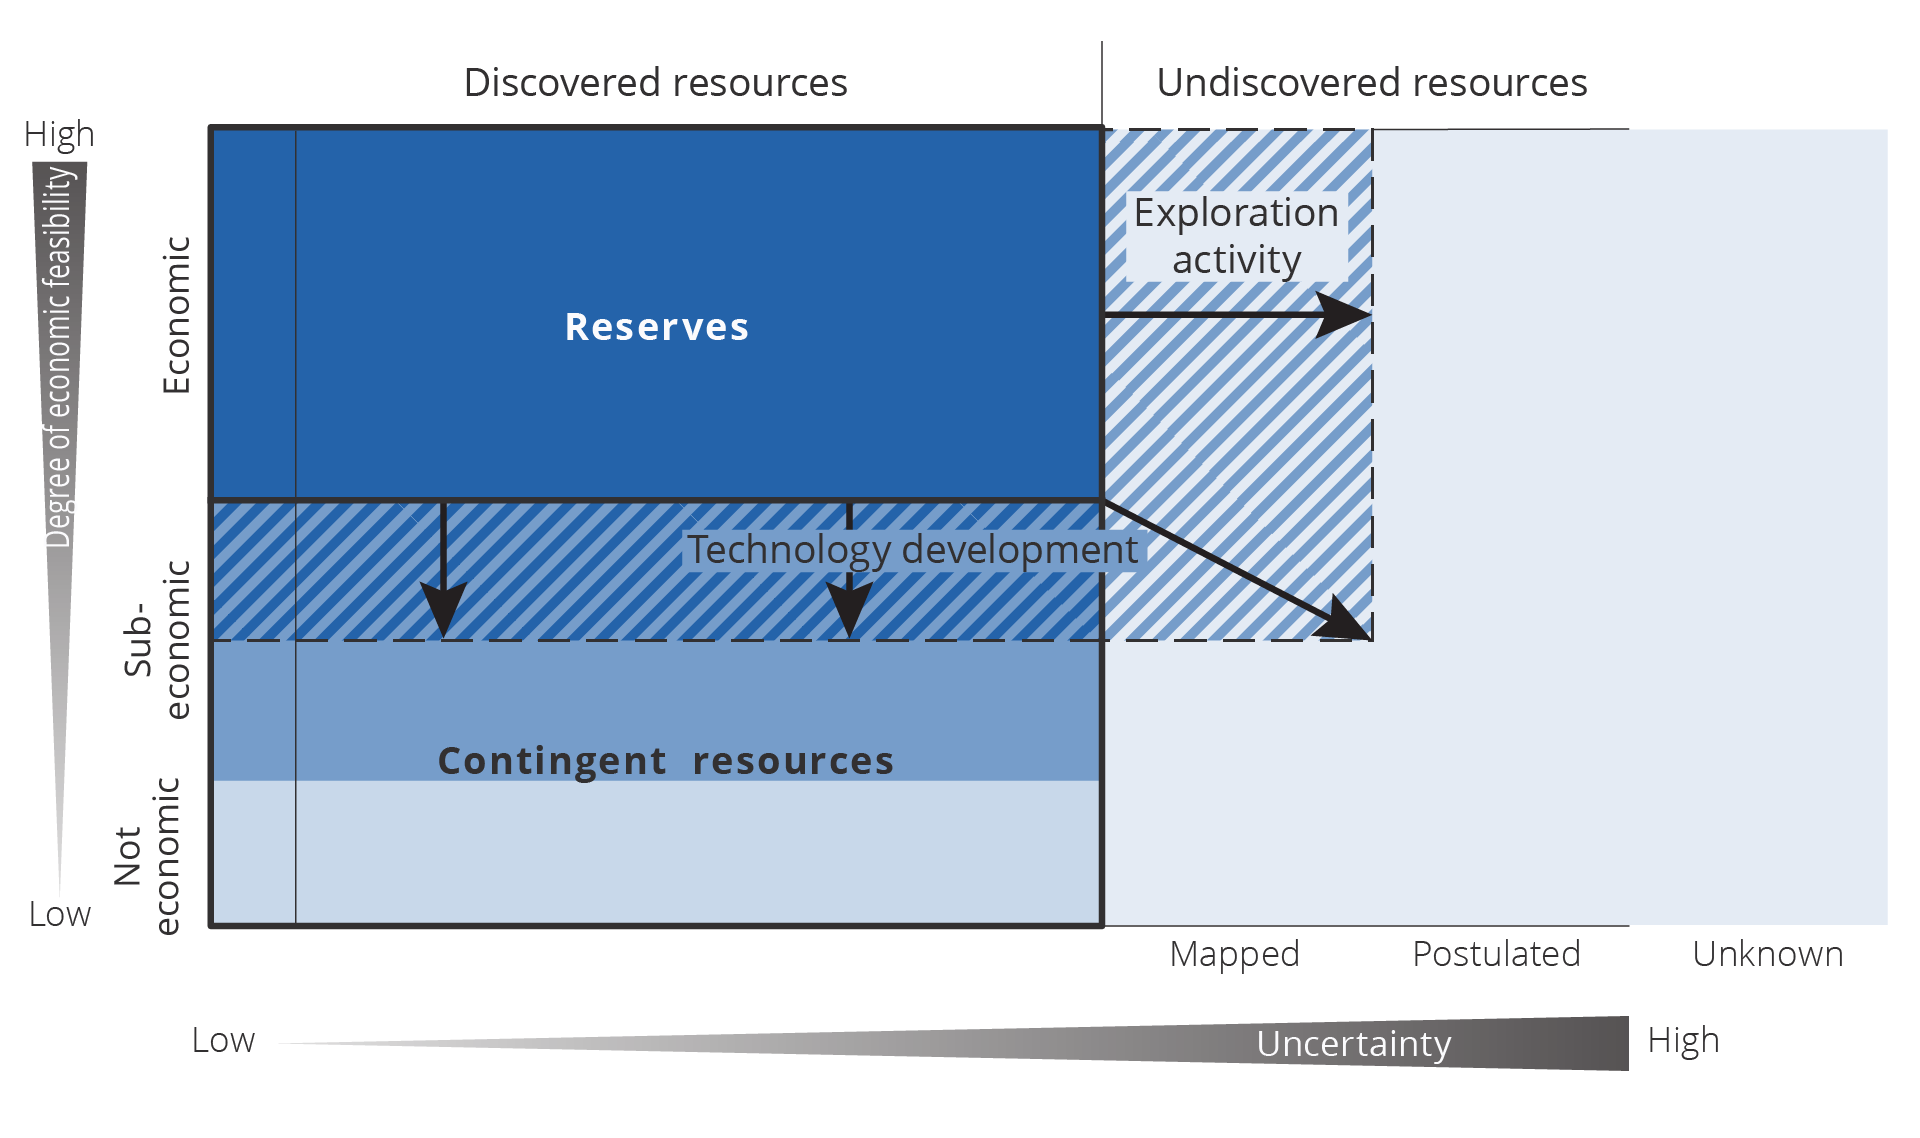
Figure 4.5 This figure is a modified version of the approach taken by American geologist Vincent McKelvey. The so-called McKelvey diagram(12) splits the oil in place into profitable and unprofitable resources and into discovered and undiscovered resources. When new technology and more information define new plays and discoveries are made, the reserve box expands toward the right. When technology development helps make marginal and unprofitable discoveries profitable to develop and recover, the reserve box expands downward. In an effort to reflect the possibility that unforeseen discoveries can still be made on the NCS, we have also added a category for unforeseen undiscovered resources(13).
Figure 4.5 illustrates how new technology and knowledge, as well as the ability to rapidly utilise new technology, can contribute to increase profitability for exploration, developing new discoveries and improved recovery on fields. The figure represents this as an increase in the reserve base; see resource classification, chapter 3.
Historically, there has been a tendency to underestimate how technology development and increased knowledge about the subsurface have contributed to increased resource growth and higher production. Figure 4.6 shows the development in the Norwegian Offshore Directorate's assessment of overall resources in 1990 and 2023. The Directorate's resource estimate has increased by about 60 per cent during this period.
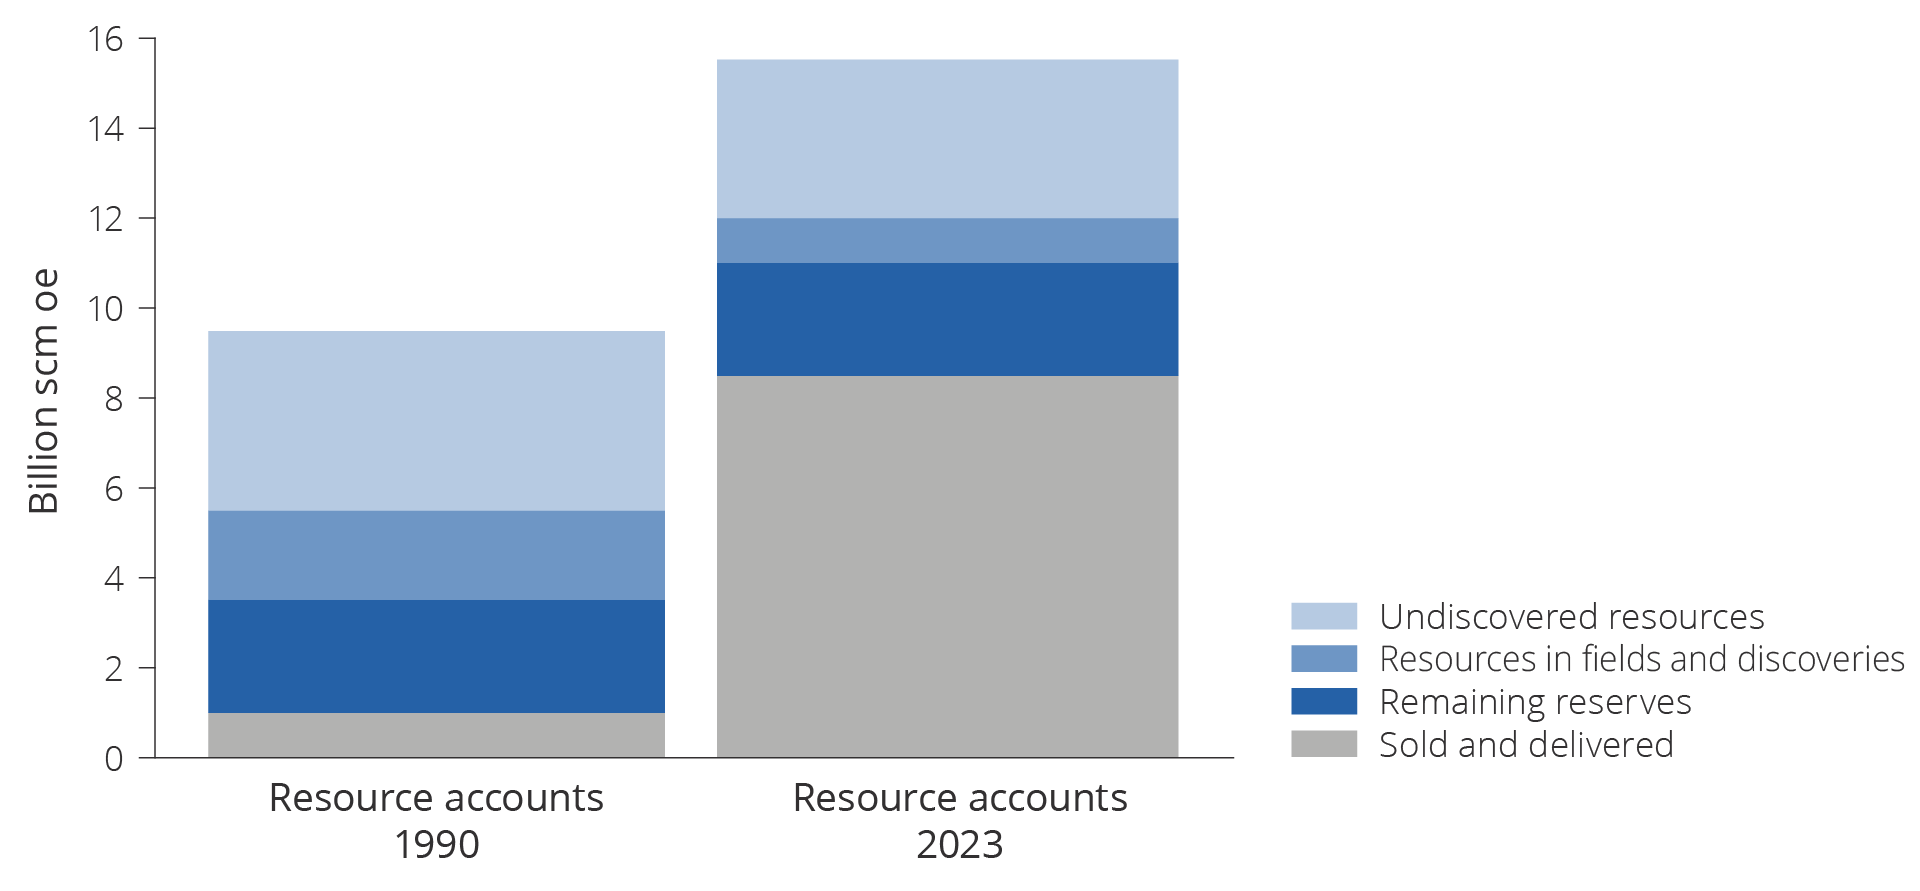
Figure 4.6. Growth in the Norwegian Offshore Directorate's resource estimate from 1990 to 2023.
Three scenarios leading up to 2050
The considerable uncertainty in the resource base, exploration activity and technology development make it difficult to create an unbiased forecast of future oil and gas production.
This is why the Norwegian Offshore Directorate has developed three scenarios for total petroleum production on the NCS leading up to 2050, which are better suited than a forecast to expand on the range of possible outcomes or opportunities for future production. The three scenarios were first published in the Norwegian Petroleum Directorate's resource report for 2022(14). They have now been updated with new data from the oil companies in connection with reporting for the 2024 revised national budget, see figure 4.7.
All scenarios show a decline in production, but the pace of this decline varies depending on exploration activity and technology development. The range of possible outcomes shows a significant spread in production in 2050.
The decline in production on the NCS in the three scenarios is within the interval for the global decline in oil and gas production the Intergovernmental Panel on Climate Change and IEA have estimated is in line with successfully following up the Paris Agreement(14).

Figure 4.7 Three potential scenarios for production developments for total production on the NCS 2025–2050.
Method for developing potential scenariosMethod for developing potential scenarios
Production trajectories are established for fields, discoveries and improved recovery in each scenario by starting with data reported by the companies (reporting for the revised national budget (RNB)).
The Norwegian Offshore Directorate's estimate for undiscovered resources in opened areas forms the basis for production from new discoveries. The production profile for new discoveries is derived from the scenarios' assumptions about exploration activity, discovery rate and lead times. Development solutions and associated cost and production profiles are developed for each discovery.
The model calculations for new discoveries are based on assumptions about typical development solutions (independent or satellite developments), main phase (oil or gas), resources, reservoir depth and distance to nearest infrastructure (both fields and pipelines). The cost level for exploration, development and production is based on historical costs on the NCS and expectations as regards future cost level and technology developments.
As production on the NCS is expected to gradually decline toward 2050, the infrastructure will need to be consolidated in order to keep unit costs down. This is reflected in the costs used as a basis.
The same market development is used as a basis for all scenarios. For computational purposes, the oil and gas price development from the 2024 revised national budget has been used as a basis. The Ministry of Finance's carbon price trajectories for use in socio-economic analyses are used for developments in the CO2 tax and emission credit price(16).
The Norwegian Offshore Directorate has calculated the profitability (net present value (7 per cent before tax)) for discoveries, fields and improved recovery. Only projects with positive net present value are included in the production profile. This yields a production cycle leading up to 2050 for each scenario. The scenarios vary as regards exploration activity and resource growth, capacity restrictions in infrastructure and industries, lead times and technology development.
Base scenario
In this scenario, liquids and gas production increases leading up to 2025, before it gradually declines in line with depletion of the resources. The gas share of total production increases over time.
Production development
Production reduces gradually from 243 million scm oe in 2025 to about 83 million scm oe in 2050 in line with a gradual production decline on the larger fields (base, figure 4.7). This is a reduction of about two-thirds from 2025 to 2050. This constitutes a significant dismantling of petroleum activities leading up to 2050.
Exploration activity and resource growth
Exploration activity will remain at the current level over the next few years and will then decline. Over the short and intermediate term, the North Sea and Norwegian Sea will see the most exploration activity. These areas feature access to infrastructure with available capacity, and this can contribute to short lead times from discovery to production and short repayment times.
Discoveries being developed will maintain capacity utilisation on host fields, pipelines and process plants. Unit costs will be contained. This will increase profits on existing fields and result in a lower threshold for initiating new projects.
Over the intermediate and longer term, an increasing share of wildcat wells will be drilled in the Barents Sea, while the share in the North Sea will decline.
Many discoveries will be made, but they are consistently small and the resource growth from exploration will drop.
Technology development, discoveries and fields
As the industry is operated efficiently and extensive consolidation takes place, new discoveries will generally be profitable even if they are minor. Most new discoveries that come on stream will be developed as satellites to existing infrastructure, which will extend production on fields beyond original plans.
Several projects will be implemented to improve recovery on operating fields. However, these projects will not be sufficiently large to offset the production decline from operating fields.
The economy and society at large
The petroleum sector will account for substantial value creation over the next 25 years and will remain important for government revenues.
A report prepared by Statistics Norway (SSB) in 2022(17) estimates the number of direct and indirect jobs associated with the petroleum activities on the NCS at around 156,100 in 2021. This does not include jobs linked to the supplier industry's deliveries to the international petroleum industry. SSB presumes that jobs in the sector will decline in line with production. As production will drop by just under 70 per cent leading up to 2050, a similar reduction will be seen in jobs.
Alongside the decline in production, reduced activity, and production dropping by more than half leading up to 2050, there will also be a gradual decline in ripple effects on other industries. This will weaken the sector's role as the growth engine for the rest of the economy. At the same time, the industry in 2050 will still deliver substantial revenue per employee.
Low scenario
In this scenario, liquids and gas production will decline rapidly. This will accelerate the dismantling of the petroleum activities. A significant resource potential in fields, discoveries and undiscovered resources will never be realised.
Production development
Production will fall quickly from about 235 million scm oe in 2025 to close to zero production in 2050, see figure 4.7. In practice, this means that the petroleum activities will be dismantled.
Exploration activity and resource growth
Exploration activity will remain at the current level over the next few years, followed by a rapid decline. Most wells will be dry, few viable discoveries will be made, and exploration activity will stagnate.
Exploration wells drilled in the Barents Sea will be dry or result in very small discoveries. Exploration activity will therefore concentrate on the North Sea and Norwegian Sea, where ample access to infrastructure will incentivise further exploration. Nevertheless, as the discoveries will be very small, few of them will be developed. The exploration activity will therefore be unable to help maintain capacity utilisation on host fields, pipelines and process plants.
Technology development, discoveries and fields
Few new discoveries will be developed and very few improved recovery projects will be initiated. This will lead to a substantial production decline and reduced value creation for the industry.
Unit costs on fields will rise rapidly, as new discoveries through exploration will not contribute to substantially increased production on host fields. In turn, this will result in reduced profits and a drop in production. Costs will increase, accompanied by reduced profitability for exploration and the development of new discoveries. This will lead to many fields shutting down early.
The economy and society at large
The rapid decline in field production toward near-zero in 2050 will be accompanied by a reduction in both the number of jobs associated with the industry and ripple effects for the rest of the economy. SSB's calculations may indicate potential effects where the number of jobs drops by 100,000 compared with the base scenario(18).
In practice, this will entail a complete dismantling of the petroleum industry leading up to 2050. However, despite the substantial drop in production, this scenario will contribute to significant value creation over the next 25 years.
High scenario
Liquids and gas production will increase leading up to 2025 and stay at a high level over the next decade. Gas production will remain at a high level until 2037 and will then start to decline. The NCS is an attractive petroleum province, and the authorities and the industry both help maintain exploration activity, technology development and profitable petroleum production.
Production development
As of 2025, production will be maintained over the next decade, followed by a gradual decline. Production will drop from about 245 million scm oe in 2025 to about 120 million scm oe in 2050, see high, figure 4.7. In other words, production will be cut in half from 2025.
Exploration activity and resource growth
High exploration activity, both in areas close to infrastructure and more frontier areas, will quickly yield more and larger discoveries. Several major gas discoveries will be made in less mature areas in the Norwegian Sea early on in the period.
Multiple major discoveries will be made in the Barents Sea, for example in the western and central parts of the Barents Sea. These will be developed quickly. New and significant gas export capacity from the Barents Sea to the Norwegian Sea will be developed quickly. The major discoveries will lead to increased exploration. An increasing share of exploration wells will be drilled in the Barents Sea over the intermediate and longer term.
Increased exploration and more discoveries in mature areas will increase the value of existing fields and infrastructure. Discoveries being developed will maintain capacity utilisation on host fields, pipelines and process plants. Costs will be contained. Increased profits on existing fields will help extend production on the fields.
Technology development, discoveries and fields
Multiple innovations will increase profitability for exploration, improved recovery and the development of new discoveries. A number of major discoveries will be developed, either as independent offshore solutions or as subsea tie-back solutions to onshore process plants. All new, independent developments will be supplied with nearly emission-free power.
Several projects will be implemented to improve recovery on operating fields. New technology will be developed and implemented quickly. This will aid in improving recovery from tight reservoirs as well. A number of players will attempt and succeed with advanced improved recovery methods.
The economy and society at large
The sector's importance for the Norwegian economy and government revenues will be significant in this scenario. As production will remain at a high level for 10-15 years, employment will be high and ripple effects for the rest of the economy will be extensive.
The sector's significance will decline toward the end of the period in line with tapering production. However, the industry will still enjoy substantial revenue per employee.
Consequences for future production and value creation
All three scenarios show a decline in production moving forward, but the pace of this decline varies across the three scenarios. The production decline will depend on development in the world at large, the resource base and the stakeholders' investments in exploration and technology developments.
How these factors evolve could make a significant difference in future production. The three scenarios show a difference in accumulated production of 2400 million scm oe in 2050, see figure 4.8.
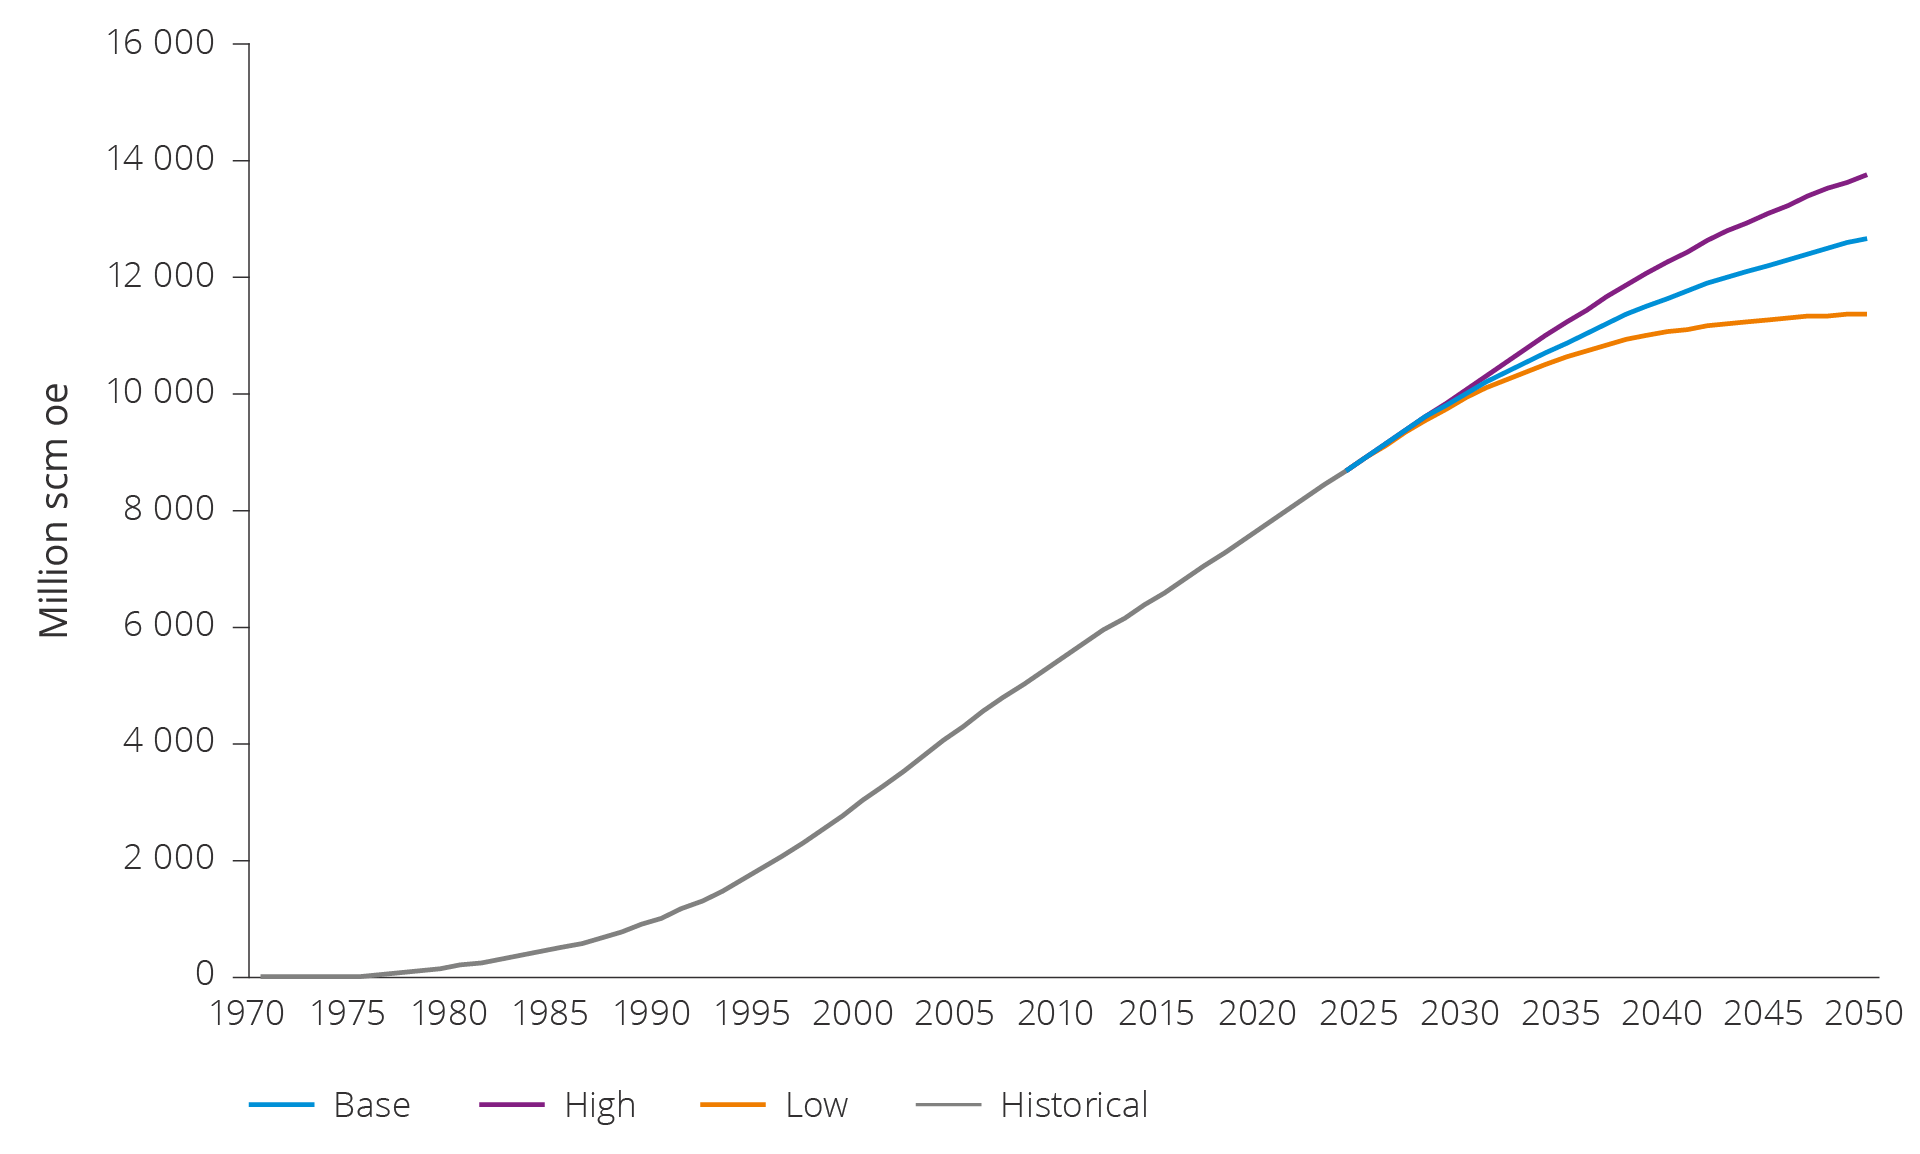
Figure 4.8 Projection of accumulated production leading up to 2050 in the three scenarios.
The scenarios reveal stark differences in future value creation and future government revenues from the petroleum sector, see figure 4.9.
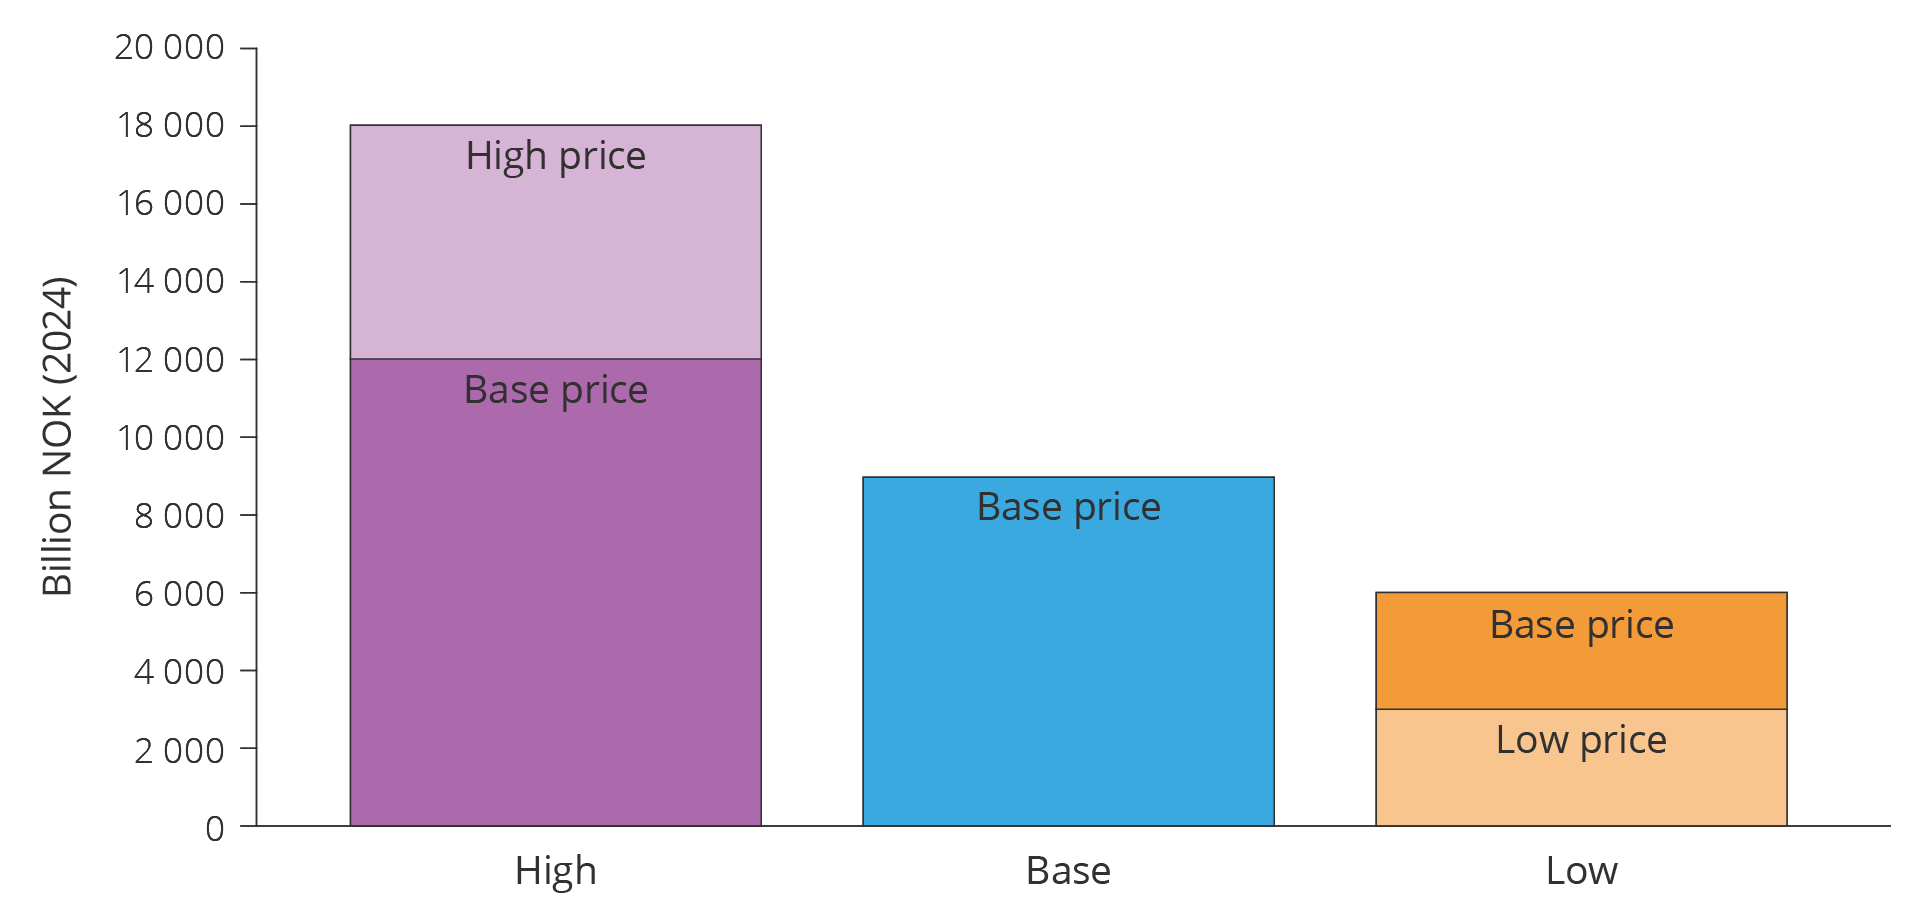
Figure 4.9 Projection of net cash flow from Norwegian petroleum activities 2025–2050 in the three scenarios. One trajectory where all three scenarios have a basic price of USD 70/bbl, and one including price sensitivity of USD 95/bbl in high, and USD 45 in low.
The number of jobs, inputs and ripple effects are adjusted downward in line with the decline in production. Calculations conducted by SSB(19) show that adaptation costs associated with the transition to different commercial activities are uncertain, despite the changes taking place over a longer period of time, such as in the base scenario. These costs could be substantial in the event of a rapid dismantling as seen in the low scenario(20). At the same time, there is significant uncertainty associated with the future activity level, even within each scenario.
Measures to increase resource growth and keep unit costs low will be crucial for future production and future revenues in all scenarios. New industries may help bolster the established value chains in oil and gas.
DownloadRemaining resources
In this chapter:
- Managing the petroleum resources
- Reserves and challenges in fields
- Several measures can yield improved recovery
- Resources and challenges in discoveries
- Exploration builds the foundation for long-term production
One of the Norwegian Offshore Directorate's most important responsibilities is to maintain an overview of the remaining petroleum resources, in order to ensure that the authorities and players have the best possible factual and knowledge basis. This contributes to learning, sound resource management and good decisions that can help to maintain exploration activity and production over the years to come.
The Norwegian Offshore Directorate's estimate of the total remaining resources on the NCS is about 7.1 billion scm oe. Of the remaining resources about 3.6 billion scm oe are reserves and resources in discoveries and fields, while about 3.5 billion scm oe are undiscovered resources. About 60 per cent of these resources are in opened areas.
Figure 5.1 shows the remaining resources and distribution between discovered and undiscovered resources in opened and unopened areas, respectively, for the three regions.
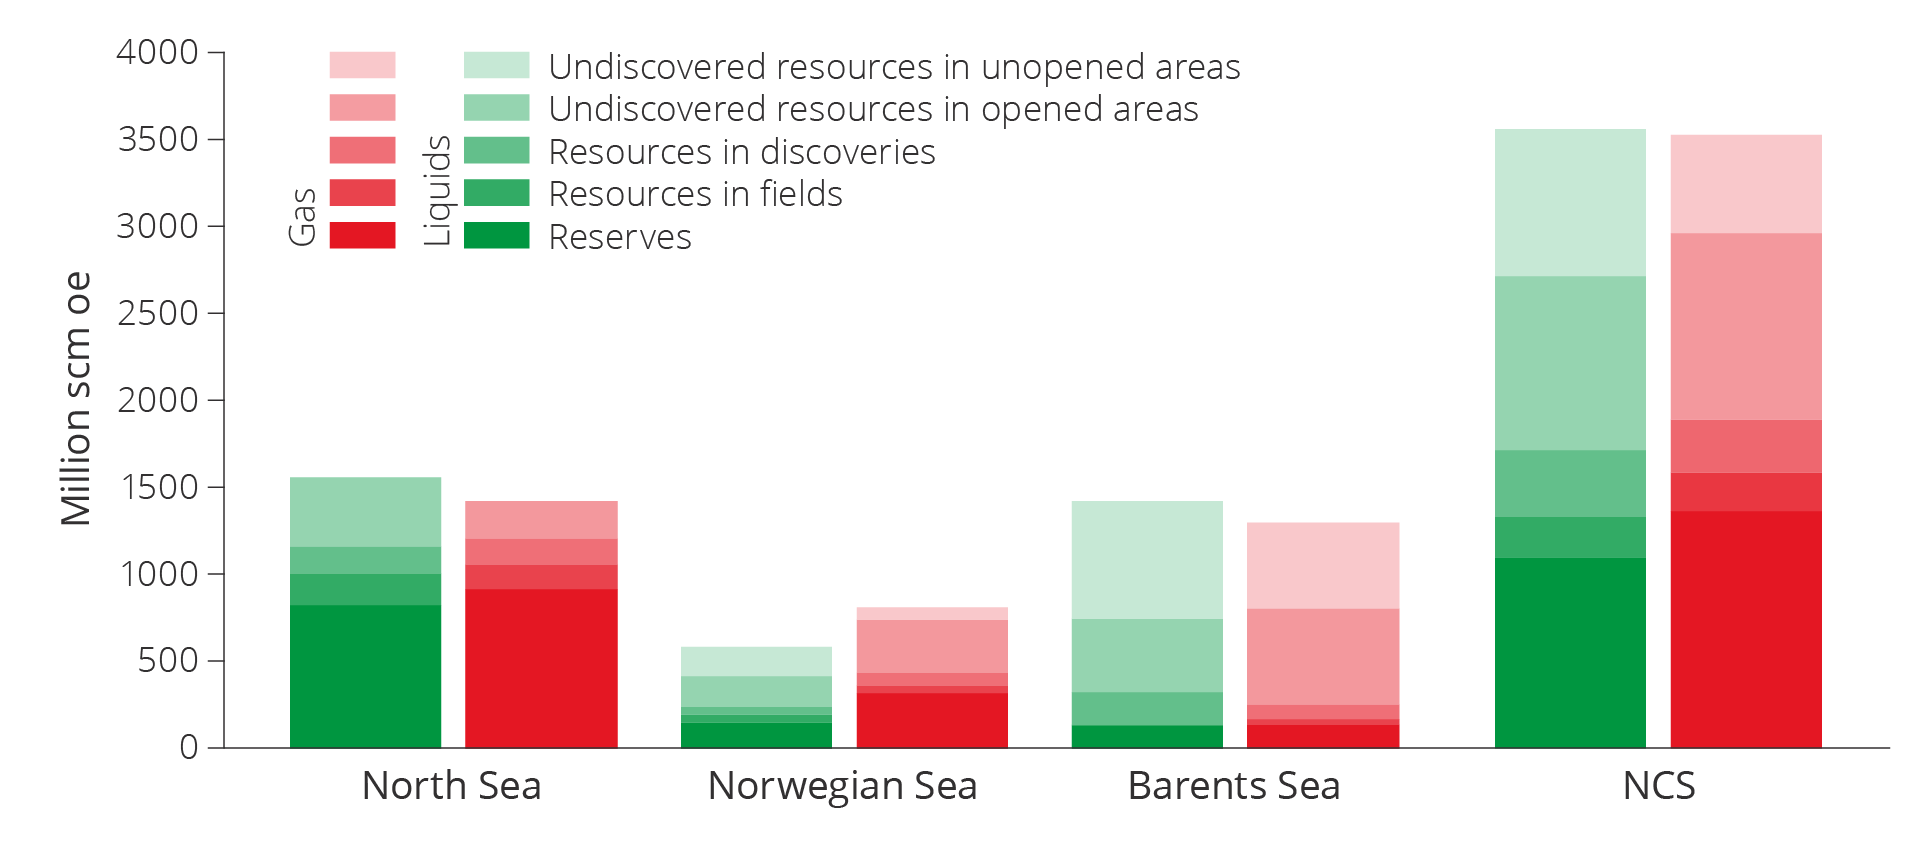
Figure 5.1 Total remaining petroleum resources distributed between liquids and gas, resource classes and regions on the NCS as per 31 December 2023.
Since it has been the centre of activity the longest, most experience and information is from the North Sea. Here, the majority of liquids and gas, about 60 per cent, is defined as reserves. This means that they are subject to approved recovery plans; see resource classification in chapter 3.
In the Norwegian Sea, undiscovered resources account for just over 50 per cent of remaining resources.
Undiscovered resources also account for the largest share in the Barents Sea. About 80 per cent of the remaining liquids and gas resources in the Barents Sea have yet to be discovered. Large areas in the Barents Sea remain closed for petroleum activity, and these areas are presumed to be home to about 50 per cent of the undiscovered resources in the Barents Sea.
The total remaining resources constitute a basis for oil and gas production for many years to come, as highlighted in figures 3.6 and 4.3.
In order for the NCS to maintain production at a high level, it is important that the companies invest to curtail the expected decline in production. The authorities acting as a driving force for comprehensive and long-term solutions can serve as a guarantee for decisions that contribute to sound resource management.
Managing the petroleum resources
The Petroleum Act(21) stipulates that the Norwegian State has the proprietary right to subsea petroleum accumulations and the exclusive right to resource management. Resource management of petroleum resources shall be carried out with a long-term perspective for the benefit of the Norwegian society as a whole.
Oil and gas resources are not renewable, and the activities are capital-intensive and take a long-term perspective. This is why one of the authorities' primary missions is, as resource owner and regulator, to establish and maintain a framework for the activities. This framework shall help ensure that the oil companies have a self-interest in utilising oil and gas resources in the best interests of the broader society.
However, the companies' and society's financial assessments do not always align(22). This is called market failure(23). These are instances where government measures may help ensure that resources are put to better use for the broader society. The fact box below shows selected examples of market failures that may occur in the petroleum sector, and which create a need for government measures.
Regulation of the petroleum activities seeks to take into consideration the most important forms of market failure and is designed to yield the best possible overlap between the companies' decisions and the authorities' interests.
Market failure in the petroleum sector
Market failure comes in different varieties in the petroleum sector. The authorities regulate, correct or influence the companies' decisions to ensure that they coincide with what is best for the broader society. The most common forms of market failure within the petroleum activities are described below.
Public goods(24) or shared goods are goods with the following properties:
1) Non-exclusivity, which means that no-one can be prevented from consuming the good; and 2) non-rivalry, which means that one person's consumption of the good does not diminish another person's consumption of the same good. When it is not possible to exclude others from using the good, it is difficult to establish a market for this good. No-one will be willing to pay for a good they have access to regardless. Neither will anyone be willing to invest in a good that everyone will have access to.
The value of the public good for society exceeds the companies' willingness to pay. This means that authority intervention to ensure that public goods can be produced may be in society's best interest.
One example is publicly available data and information about the geology on the NCS. Another example is government support for research and development (R&D). If the authorities do not take an active role, there will be insufficient research and not enough geodata will be collected. It is also important that the authorities, as resource owner, are as familiar as possible with the opportunities in place on the shelf(25).
Positive external effects are advantages from a company's activity or investments, which the company does not take into account in its decisions. Examples include investments in R&D or exploration that generate new knowledge. Others will benefit from this knowledge without the company receiving compensation. This could indicate regulation and/or government support.
Increased R&D efforts or exploration can also be stimulated through other types of policy instruments, such as patents or disclosure rules associated with sharing geological information. Such arrangements ensure that the party that develops a new solution or makes a new discovery is protected from early imitation efforts and others enriching themselves on the basis of their ideas. The disadvantage here is that this prevents the dissemination of important information or technologies.
Testing new technology, such as an EOR pilot (enhanced oil recovery), is also a variant of positive external effects. Technology tested by licensees in a production licence has positive effects for other production licences.
Network effects: Positive network effects will arise when a company's purchase of a good increases the benefit for all other buyers of this good. This can be a direct effect: The more users of a video-conferencing platform, the better this will be for all users of the platform. It can also be an indirect effect. One example is carbon capture from power plants and industry where the benefit for the individual company depends on access to infrastructure to transport and store CO2.
The point is that a company will benefit from other companies using the same type of technology. Positive values will be created beyond what the individual company will take into account. If the new technology is socio-economically profitable, this indicates that the government, during a transitional period, can take a coordinating role and contribute to ensure the establishment of an adequate number of users of this technology. One example of this is awarding storage opportunities for CO2 that can accelerate the capture and transport of CO2.
Negative external effects: Petroleum activity has disadvantages that the oil companies are not necessarily incentivised to take into account in their profitability calculations. This could involve pollution to sea, the seabed and coastal zone, as well as greenhouse gas emissions and other emissions to air.
If the oil companies are not held accountable for the socio-economic cost of their emissions, this will entail higher emissions than what is socio-economically acceptable. This can be avoided by employing environmental taxes and credit trading, thus ensuring that the companies include the societal disadvantages in their own cost assessments.
Petroleum activity can also lead to disadvantages for other commercial activity.
Lack of ownership of petroleum resources in the vicinity of their own production licences can entail that the companies' proposed solutions are not necessarily in the best interest of society. For example, this could result in the companies disregarding coordinated developments that would yield economies of scale and thus lower overall development costs.
A lack of area perspective and coordination across licence boundaries can also be caused by the players having different information about resources and costs. Different access to information relevant for decision-making can create a basis for different adaptation and strategic behaviour that could prevent profitable projects from being implemented.
Imperfect capital markets: Lack of or asymmetrical information about profitability in projects can also result in potential lenders not giving access to sufficient capital. In a capital market, the lender will generally have less information about profitability factors and creditworthiness than the borrower. This means that an investor or creditor could assess the risk as higher than it actually is, which leads to high interest rates or rejected loan applications. This can also contribute to less exploration and R&D than what is best for the broader society.
Economies of scale and market power: Both fields and transport infrastructure have economies of scale, which means that unit costs will falls alongside increasing production capacity. It is efficient to coordinate production and transport in order to utilise the advantages of large units. One disadvantage here is that large units can utilise their size and market power e.g. by demanding high prices for processing and transport. In such instances, there may be a need for government regulation. In the petroleum sector, this regulation takes place through regulated access to gas infrastructure and through the TPA Regulations (Regulations relating to the use of facilities by others).
Lack of long-term perspective in the licensees' decisions can entail that the companies have higher required rates of return than what is used in socio-economic analyses. Required rate of return means the minimum compensation the company needs to invest in a new project. The company will require higher return for high risk and lower return for low risk. The State will usually perceive the risk as lower than the companies since the State owns more projects with variable risks. Future opportunities will be valued lower by the companies than the State due to the higher required rate of return, for example exploration opportunities.
Absolute profit requirements: Internal capacity restrictions in the companies or restrictions in other markets such as capital or labour markets can result in an absolute profit requirements in projects. One such requirement could be a minimum requirement for the project's net present value after tax. This could lead the companies to de-prioritise socio-economically profitable projects on the NCS because they have projects with higher profitability in other petroleum provinces.
All these factors could cause the companies' decisions to lead to solutions other than what most benefits the broader society. This could result in lower exploration, fewer improved recovery projects and lower production than what is socio-economically profitable.
The companies' decisions and possible market failures can be linked to different phases, from exploration to decommissioning. In this chapter, these decisions concerning remaining resources, are split between the resource categories reserves, resources in fields, resources in discoveries and undiscovered resources.
Reserves and challenges in fields
At the start of 2024, there were 92 producing fields; 67 of which were in the North Sea, 23 in the Norwegian Sea and 2 in the Barents Sea.
Petroleum production on the NCS maintained a stable, high level in 2023. Oil production was at the highest level since 2010, while gas production declined somewhat from record-high levels in 2022.
The production of petroleum has increased each year since 2020 as shown in figure 5.2. Petroleum production is expected to increase in 2024. According to estimates, the level in 2025 will be the highest since 2006.
Total production from reserves in existing fields is expected to decline after 2025, in line with depletion and pressure drop in reservoirs. Based on current knowledge, production from operating fields is expected to drop by more than half during the period through and including 2033.
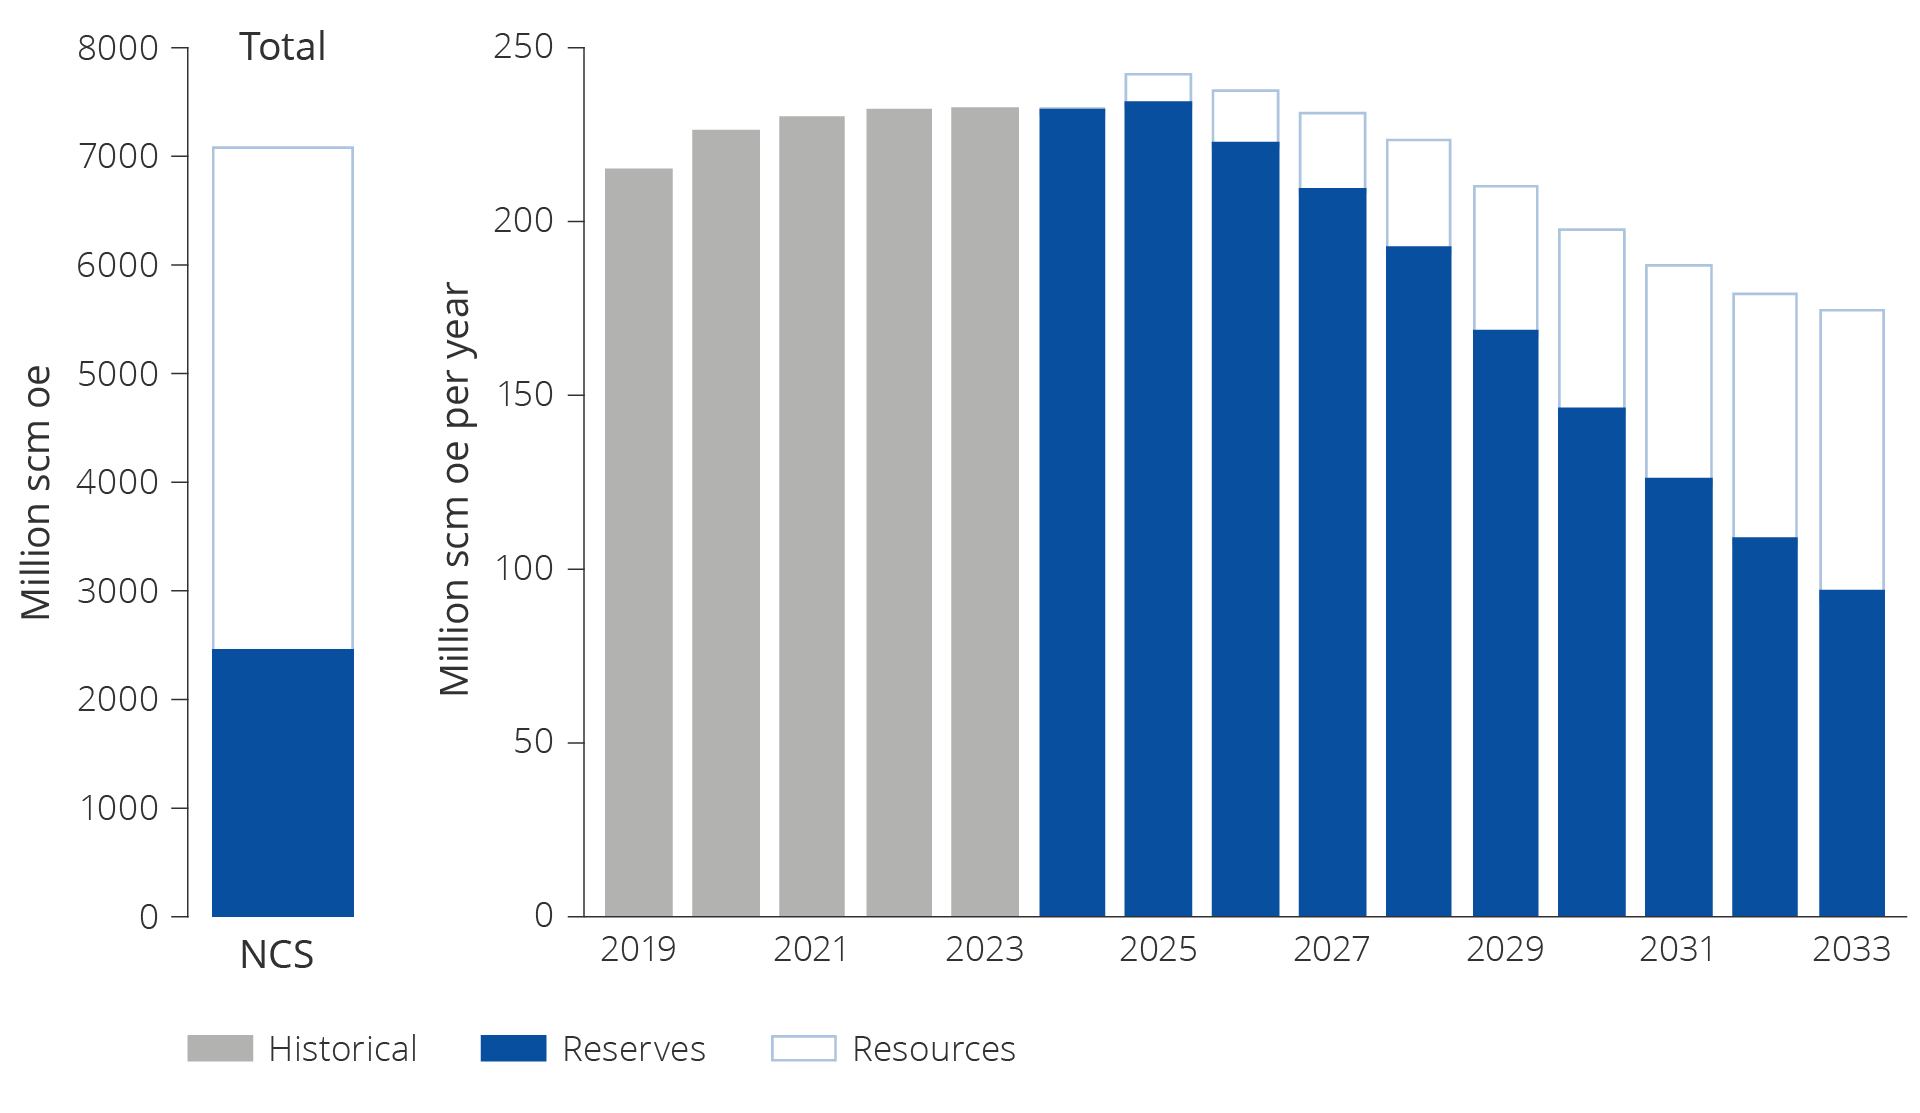
Figure 5.2 Remaining reserves. Historical total production 2019-2023 and expected future production from reserves 2024–2033.
A number of plans for development and operation (PDOs) were submitted to the Ministry in 2022 and processed in 2023, illustrated in figure 3.3 and described in the fact box on plans for development and operation (PDOs). All of these plans were approved by the authorities and are now included in expected future production from reserves in figure 5.2.
This major increase in the number of PDOs in 2023 was primarily caused by the temporary changes in the petroleum tax, further described in the fact box on the temporary changes to the Petroleum Tax Act adopted in June 2020. These changes in taxation have facilitated the realisation of more developments, with earlier production than would otherwise have been the case. These development projects will help ensure that production can remain relatively high over the next few years. Several projects are also facilitating power from shore, in order to reduce CO2 emissions from production.
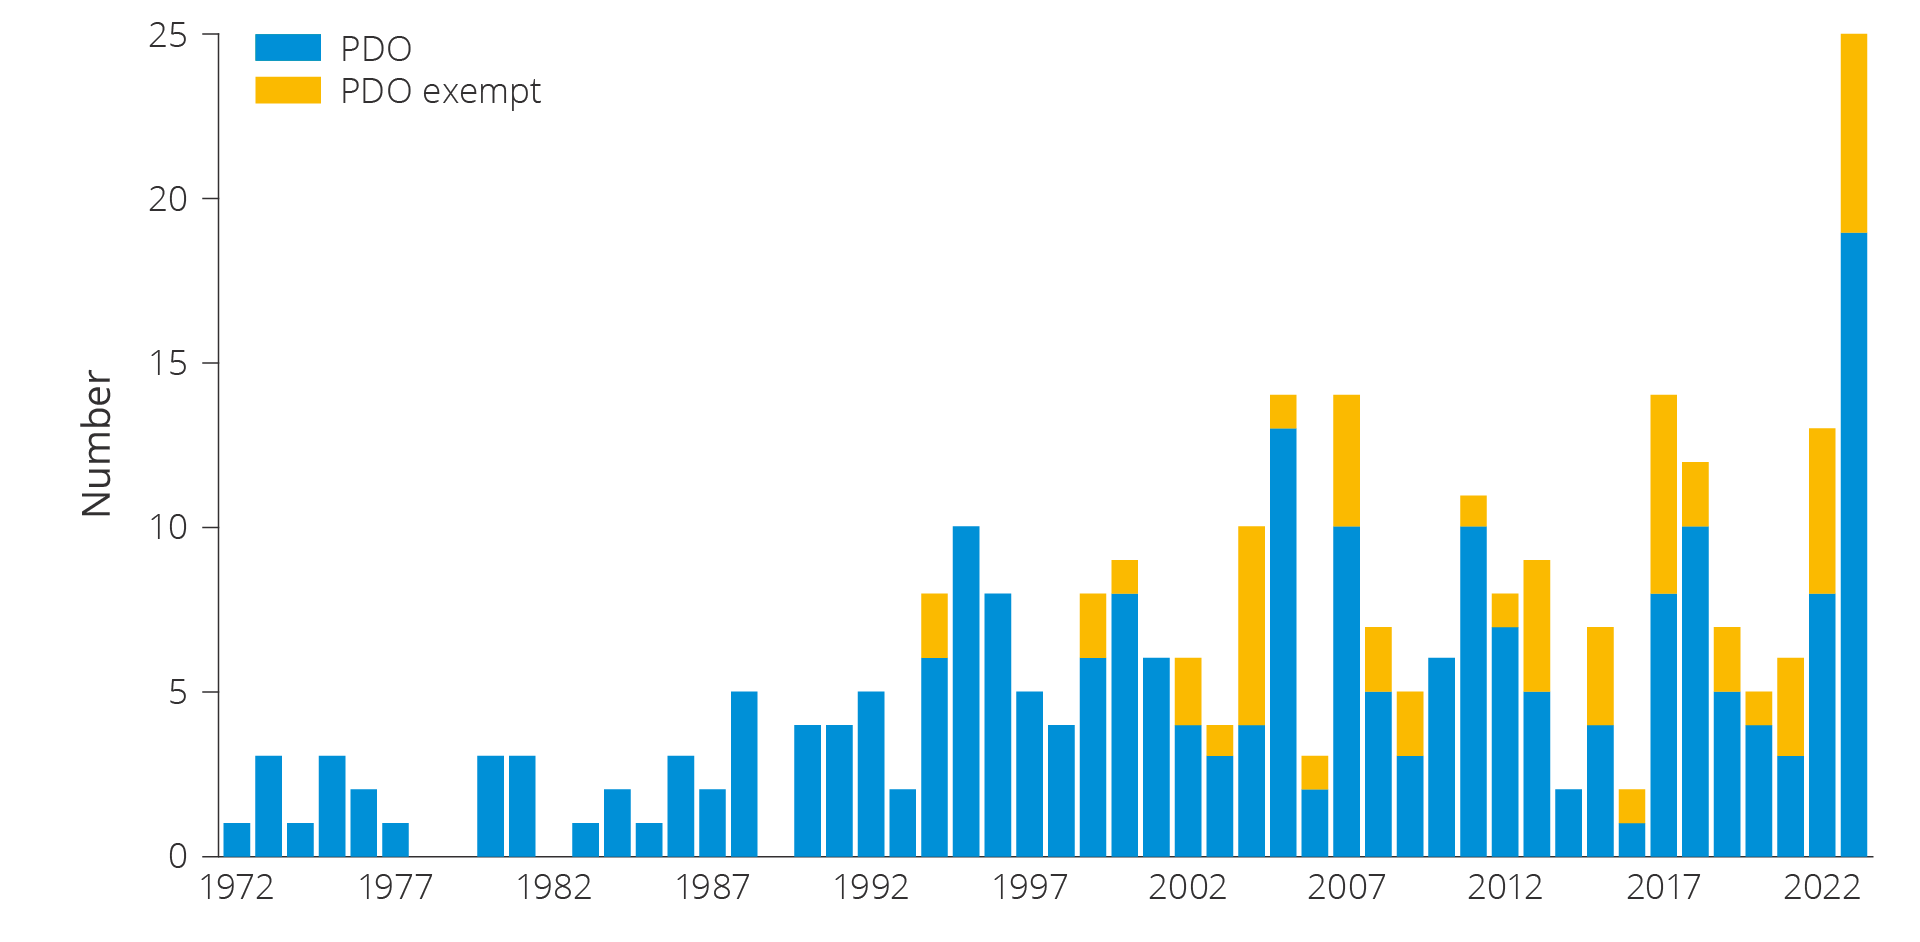
Figure 5.3 Approved plans for development and operation (PDOs) and PDO exempts in 2023.
Plans for development and operation (PDOs)
Before licensees can develop one or more discoveries, the authorities need to approve a plan for development and operation (PDO).
A PDO consists of a development part, which covers the development of the discovery or discoveries, and an impact assessment part, which covers the impacts the development will have. Developments can be exempted from the submission of a PDO.
This will primarily be relevant for developments of minor discoveries that can be reached from existing facilities on fields with an approved plan for development and operation. A discovery developed in this manner will normally be incorporated into the existing field without being given a separate name.
Temporary changes in the Petroleum Tax Act
In June 2020, the Storting (Norwegian parliament) passed temporary amendments to the Petroleum Tax Act, cf. Proposition No. 113 L (2019–2020) and Recommendation No. 351 L (2019–2020).
The objective was to help ensure that the oil companies could continue to work on planned investment projects despite temporary liquidity, funding issues and increased uncertainty surrounding the future due to the pandemic and its impact on the energy markets.
The background was that investment activity on the NCS was projected to be lower than expected before the pandemic as a result of planned investment projects being delayed. Such delays could have increased the risk of shutdowns and bankruptcies in the supplier industry.
Considerable remaining quantities of liquids
The remaining quantities of liquids on the NCS are still considerable. About 60 per cent of overall expected liquids resources have been produced since Ekofisk came on stream in 1971. Remaining liquids reserves distributed across fields are shown in figure 5.4. Johan Sverdrup (24 per cent) is the field that clearly has the most remaining reserves and which produces the most oil annually.
The second largest is Johan Castberg (8 per cent), which is expected to come on stream in 2024. Snorre accounts for 7 per cent. Yggdrasil with the Hugin, Munin and Fulla fields and expected start-up in 2027, will collectively account for 6 per cent of the overall remaining reserves.
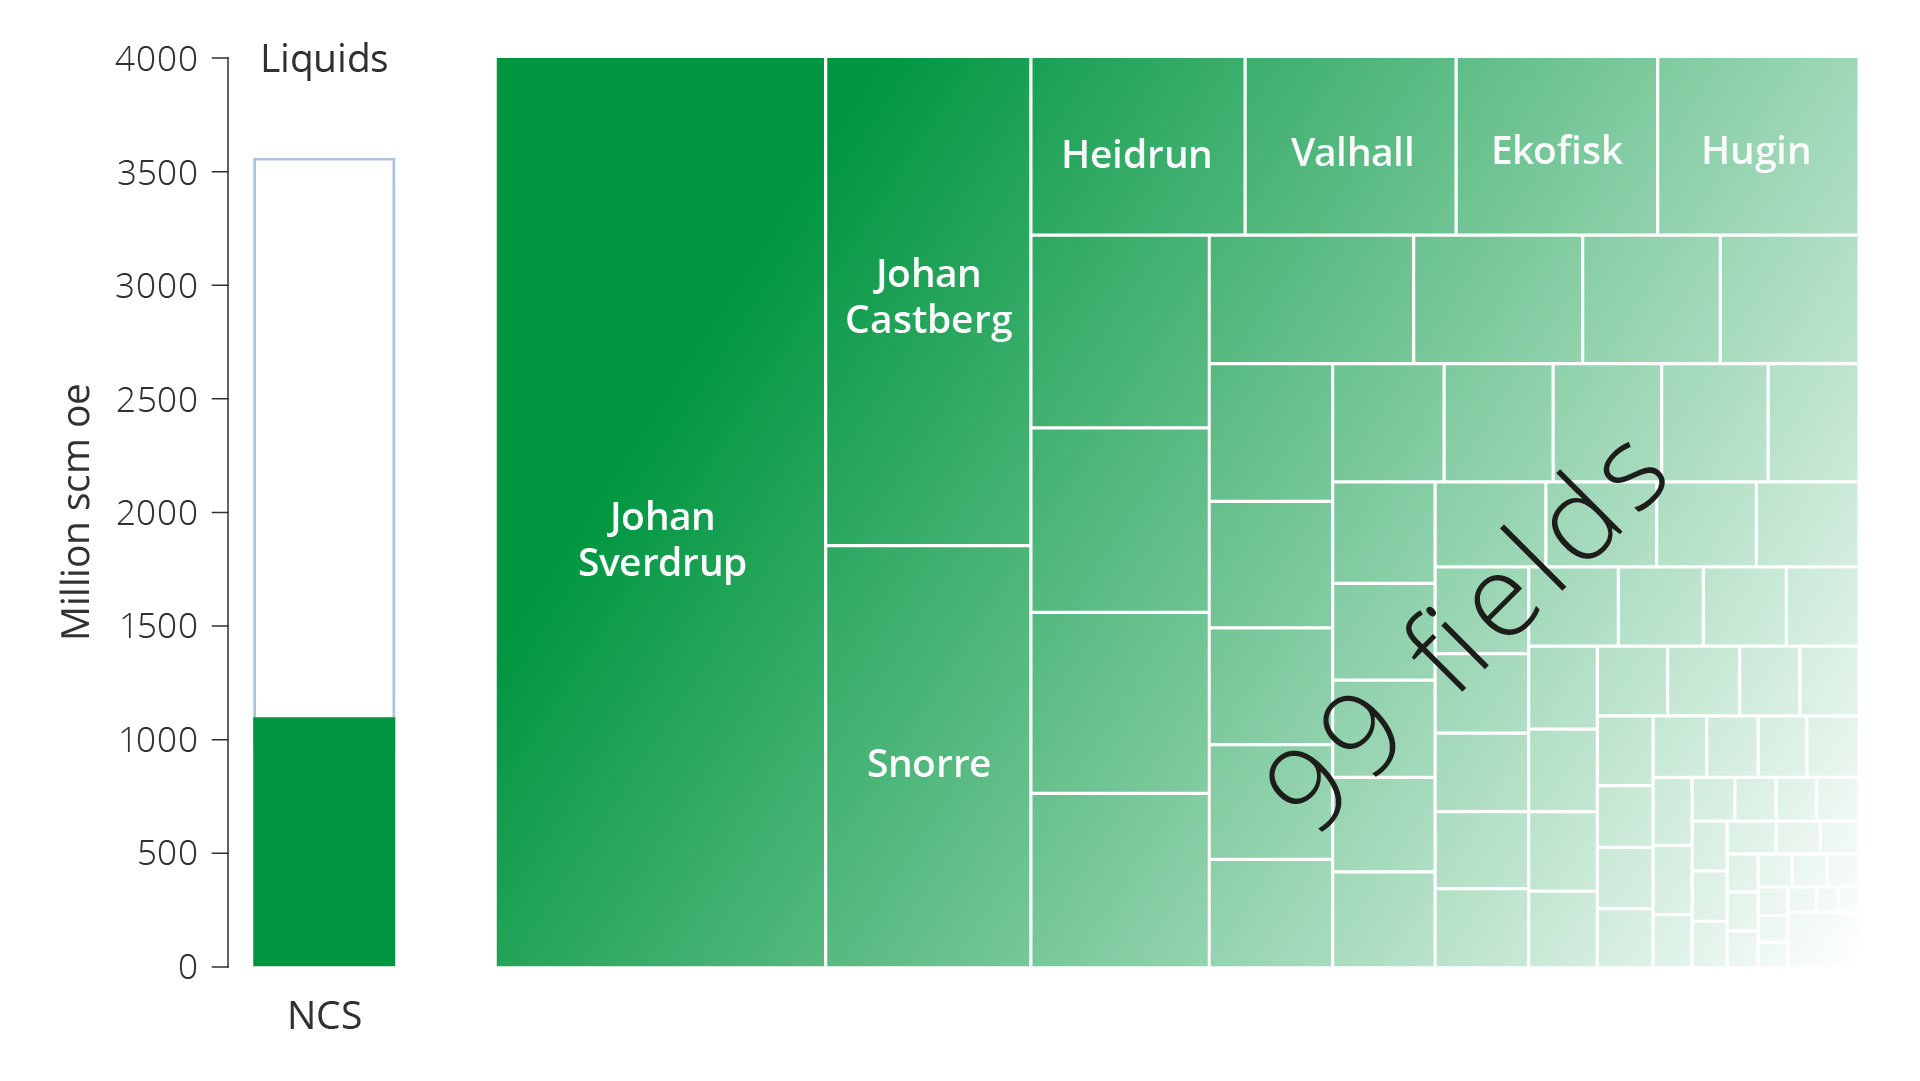
Figure 5.4 Remaining liquids reserves on the NCS as of 31 December 2023. Percentages are distributed across fields.
Liquids production will also decline in the future in several fields containing both, oil and gas as a result of initiating gas blowdown.
Gas blowdown
In some fields, which contain both oil and gas, the oil is produced first. This prevents the pressure from dropping in the reservoir, which will complicate extraction of the underlying oil. Eventually, as there will be less oil to produce, the field can start producing the gas in a so-called gas blowdown.
Several fields that have been injecting gas for improved oil recovery have halted this injection in recent years. For many fields, halting injection in this manner can be the first step towards gas blowdown on the field, and thus increased gas production. Examples of fields that have halted their gas injection include Visund and Gina Krog.
A full blowdown cannot start until active measures are taken to produce the gas in the gas cap. This can be done by drilling new gas production wells into the gas cap, converting gas injection wells into gas production wells or by opening gas cap zones in the existing oil production wells.
Once gas injection ends and gas production increases, most fields will see a minor increase in oil production, but in most instances, total oil recovery would have been higher if gas injection had continued.
Injection normally ends when the gas blowdown starts. The combination of stopping injection and increasing gas production will result in a rapid pressure drop in the reservoir. This is why it is important to conduct studies which ensure an adequate number of wells, so that all profitable oil resources in the field can also be produced.
Gas blowdown can also take place by lowering the pressure in the reservoir to the point that the gas, which was originally dissolved in the oil, condensates and can be produced. This is done on the Statfjord field, where the depressurisation started in 2007.
Market failure and accelerated gas blowdown
With high gas prices, it can be profitable to accelerate the gas blowdown timeframe by stopping gas injection and switching to gas export. The consequence of this will be a reduction in reservoir pressure and the end of oil production. Early gas blowdown can also affect oil production in neighbouring fields if the reservoirs are in pressure communication.
Such accelerated gas export will result in revenues and costs, that are taken into account in both a traditional commercial and socio-economic analysis. The profitability of this decision will be affected by the fact that accelerated gas export is an irreversible decision that could result in profitable oil being permanently stranded.
As long as the gas is re-injected, the companies have the opportunity to either continue oil production or start exporting gas. If the companies export the gas, parts of the known oil accumulations will be unavailable for production and sale.
Differences between profitability assessments made by the companies and the broader society could result in the companies setting lower future valuations than the authorities. Since the gains in the form of improved oil recovery are long-term, some licensees could potentially want to produce the gas faster than what would be in society's best interest. The higher required rate of return, the less attractive it could be to extract the remaining oil before gas production starts.
Large remaining quantities of gas
About 45 per cent of total expected Norwegian gas resources have been produced since gas exports from the NCS started in 1977. Remaining gas reserves distributed across the fields are shown in figure 5.5. Located in the North Sea, Troll (44 per cent) is clearly the field with the most remaining gas reserves. It is followed by Snøhvit in the Barents Sea with 10 per cent and Ormen Lange in the Norwegian Sea with 6 per cent.
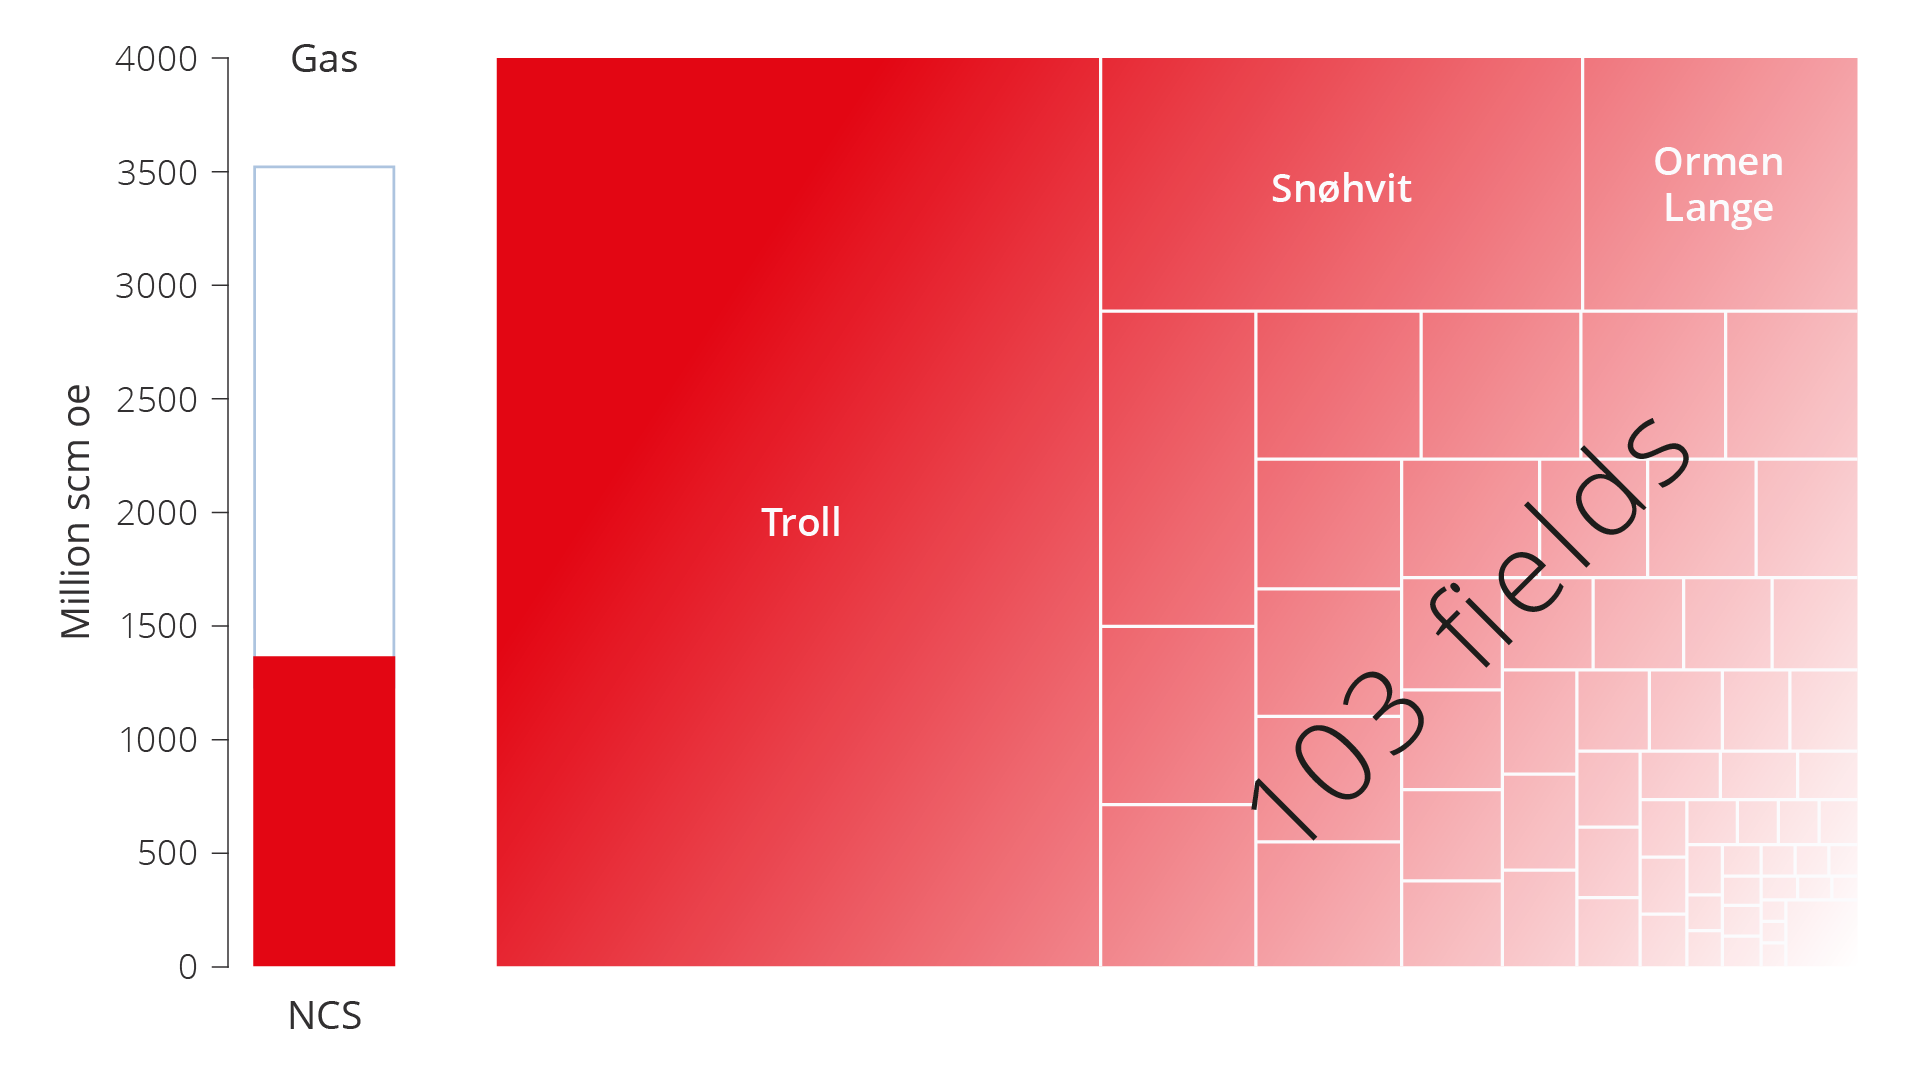
Figure 5.5 Remaining gas reserves on the NCS as of 31 December 2023. Percentages are distributed across fields.
117 billion scm of gas were exported in 2023. The Troll field produces the most gas, and in 2023 it accounted for 32 per cent of Norwegian gas production. When Troll eventually comes off plateau, there are no other fields or discoveries large enough to offset this decline.
The Troll field has two main structures: Troll Øst and Troll Vest. About two-thirds of the recoverable gas reserves are located in Troll Øst. Production from Troll Øst has evolved over a number of years with the installation of compressors on Troll A and pipelines to shore. Gas production from the first development stage of the Troll Vest gas province started in 2021.
In 2024, the Troll licensees decided to accelerate gas production from Troll Vest. This will be done by installing two new well templates with a total of 8 new wells and a pipeline back to Troll A. According to the licensees, this project will accelerate about 55 billion scm of gas starting from 2026. At its peak, this will amount to 7 billion scm in a single year. This is the equivalent of about 80 TWh or about one-half of Norwegian power generation in 2023.
Several measures can yield improved recovery
There are multiple improved recovery measures that can contribute to realising parts of the resources that, as of 31 December 2023, are expected to remain after the field is shut down. These measures can help slow the decline in production.
The expected estimate for contingent (no decision to develop) liquids resources in fields is about 355 million scm, and 290 billion scm for gas. These resources are periodised in figure 5.6.
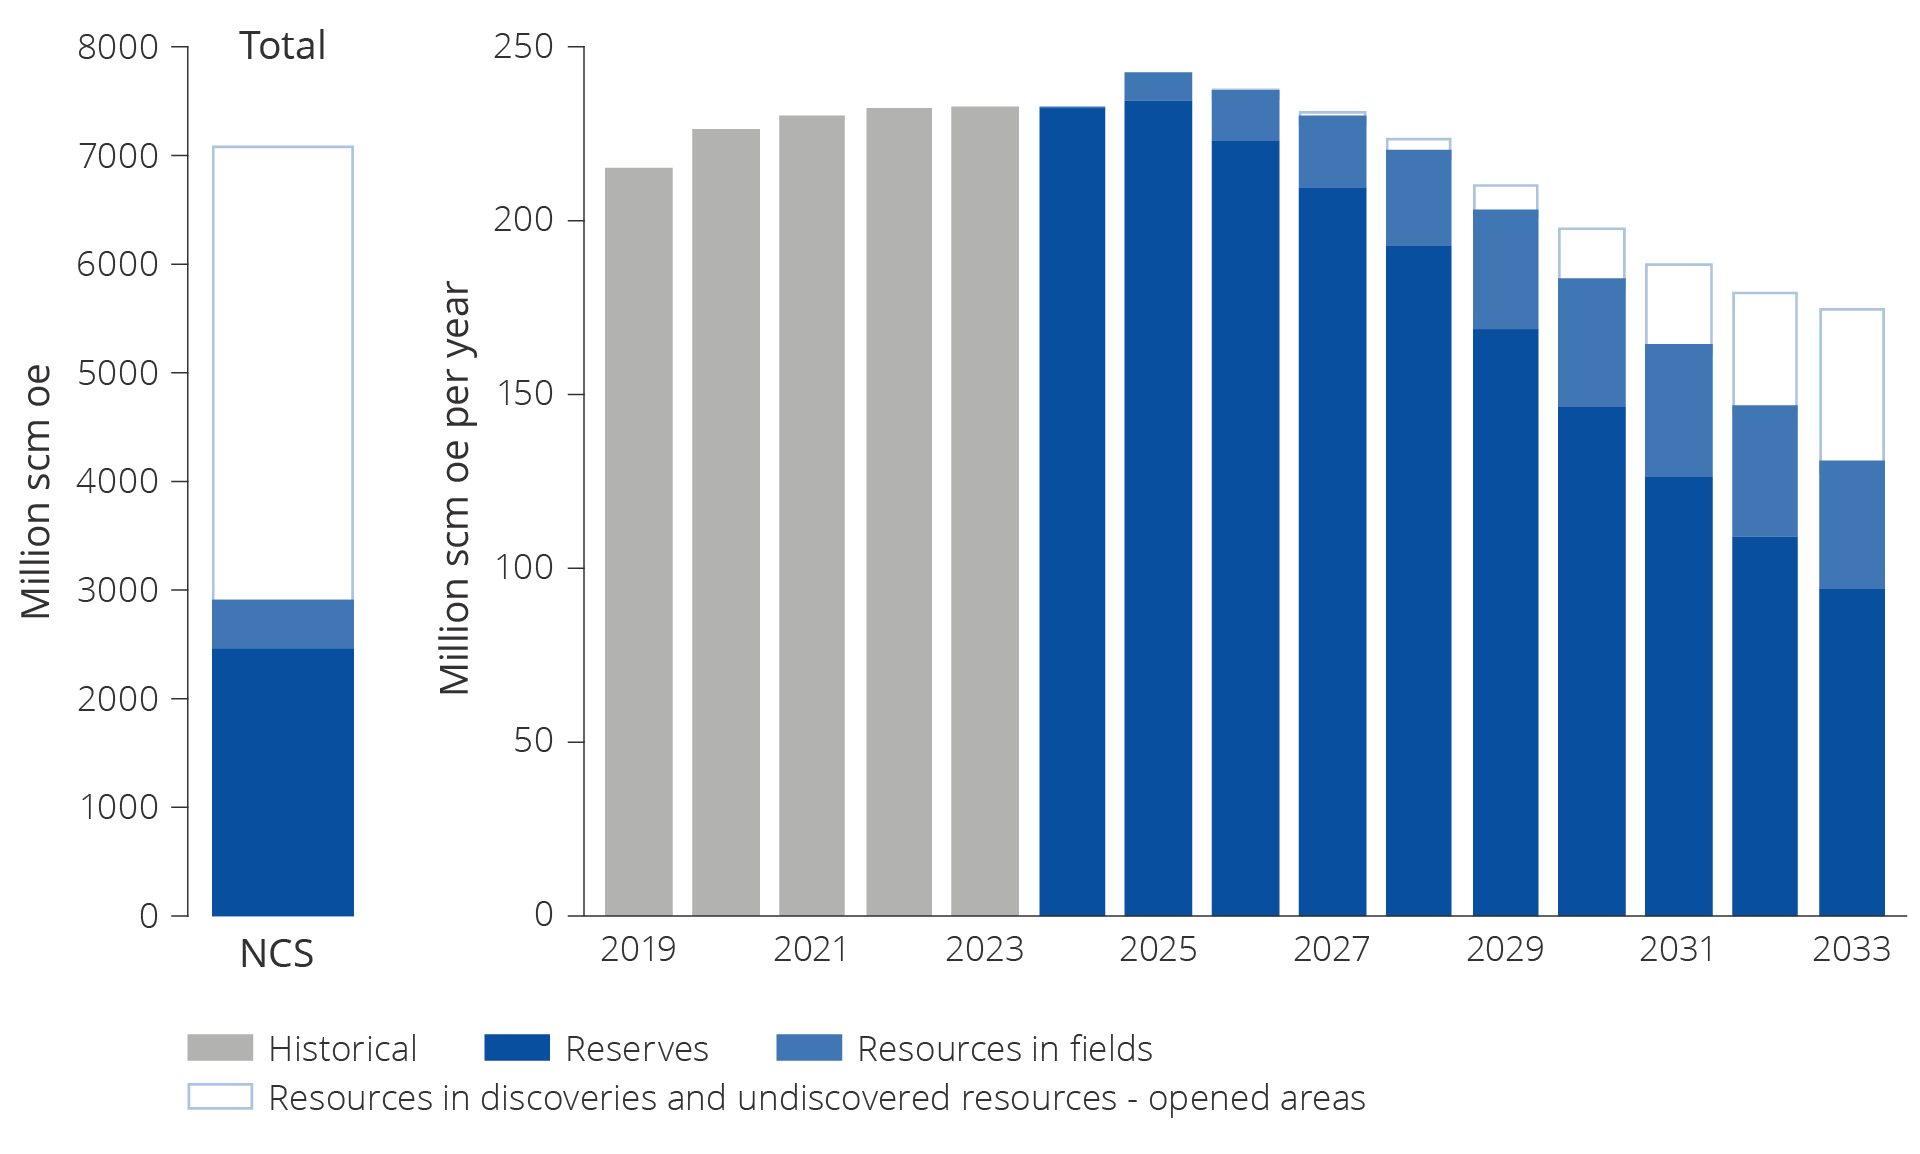
Figure 5.6 Remaining reserves and resources in fields. Historical total production from 2019–2023 and expected future production from reserves and resources in fields for the period between 2024–2033.
Many fields contain large volumes of oil beyond what is planned for production, and these fields are expected to shut down with considerable quantities oil stranded in the reservoirs. If some of this oil is produced before the field shuts down, production can be maintained for a longer period of time, and considerable value can be realised. Figure 5.7 shows produced oil, remaining oil reserves and remaining oil after planned production cessation for the largest oil fields as of 31 December 2023.
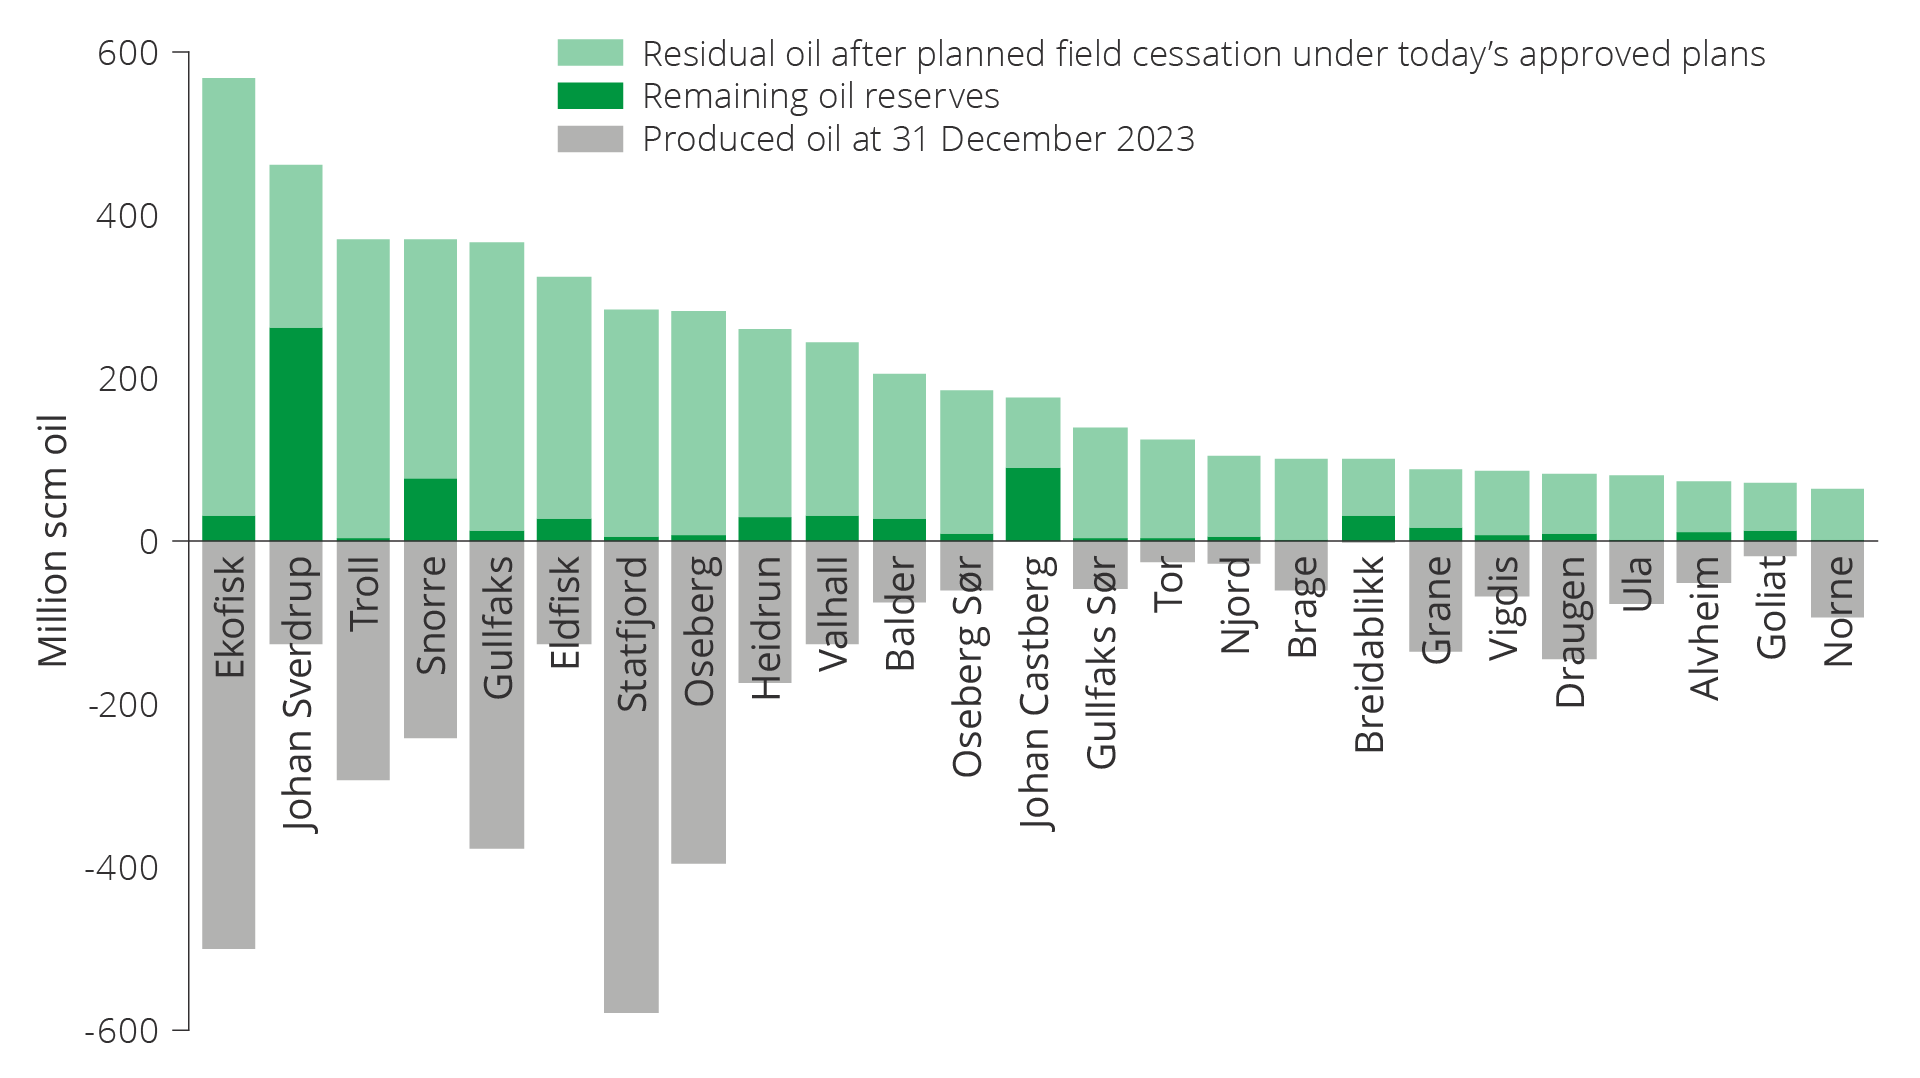
Figure 5.7 Remaining oil reserves, remaining oil after planned production cessation according to current plans and produced oil as of 31 December 2023.
Reported projects for improved recovery
The licensees are working continuously to map the resource base, drill new wells and implement other improved recovery measures on operating fields.
The projects the companies have reported to the authorities in connection with reporting for RNB 2024 (revised national budget) comprise 171 specific, but not yet approved projects for increased petroleum production and lifetime extensions.
Improved recovery measures on the fields
Wells are new development wells (injection and production wells) on the fields that are planned to be drilled from existing slots on fixed facilities or seabed templates.
Further development covers various measures to further develop fields, often by installing new infrastructure, for example seabed templates to add additional well slots for drilling or new pipelines. This category also includes projects to re-develop fields that are no longer producing, and projects to replace the fields' power supply. Further development projects will often need to be assessed by the authorities.
Late-phase production is production at the tail end of a field's lifetime. Late-phase production is reported separately from other production, since there is considerable uncertainty associated with this. The uncertainty could be the facilities' technical lifetime or the profitability of production.
Low-pressure production mainly includes projects where the installation's inlet pressure is reduced, thereby increasing the production rate from reservoirs with lower pressure. Low-pressure production leads to reduced process capacity on the installation if no investment is simultaneously made for compression on the seabed or on the installation. Compression helps ensure that the pressure in the process plant remains the same, see also low-pressure production, Chapter 6.
Injection and advanced methods cover a broad spectrum of measures. This could be increased or optimised injection of, for example, water and/or gas. Using technologies to fracture tight reservoirs is another example of this type of project, see Chapter 4, EOR.
It is important to implement new technology, in order to realise new projects for the fields. Figure 5.8 illustrates the reported, but not yet approved, measures that could contribute to enhanced recovery of liquids. In total this will result in increased recovery of approximately 155 million scm oe of liquids, if the projects are implemented. Drilling new wells is the measure that represents the single largest contribution to improved recovery, while further development accounts for one-fourth of increased liquids resources.
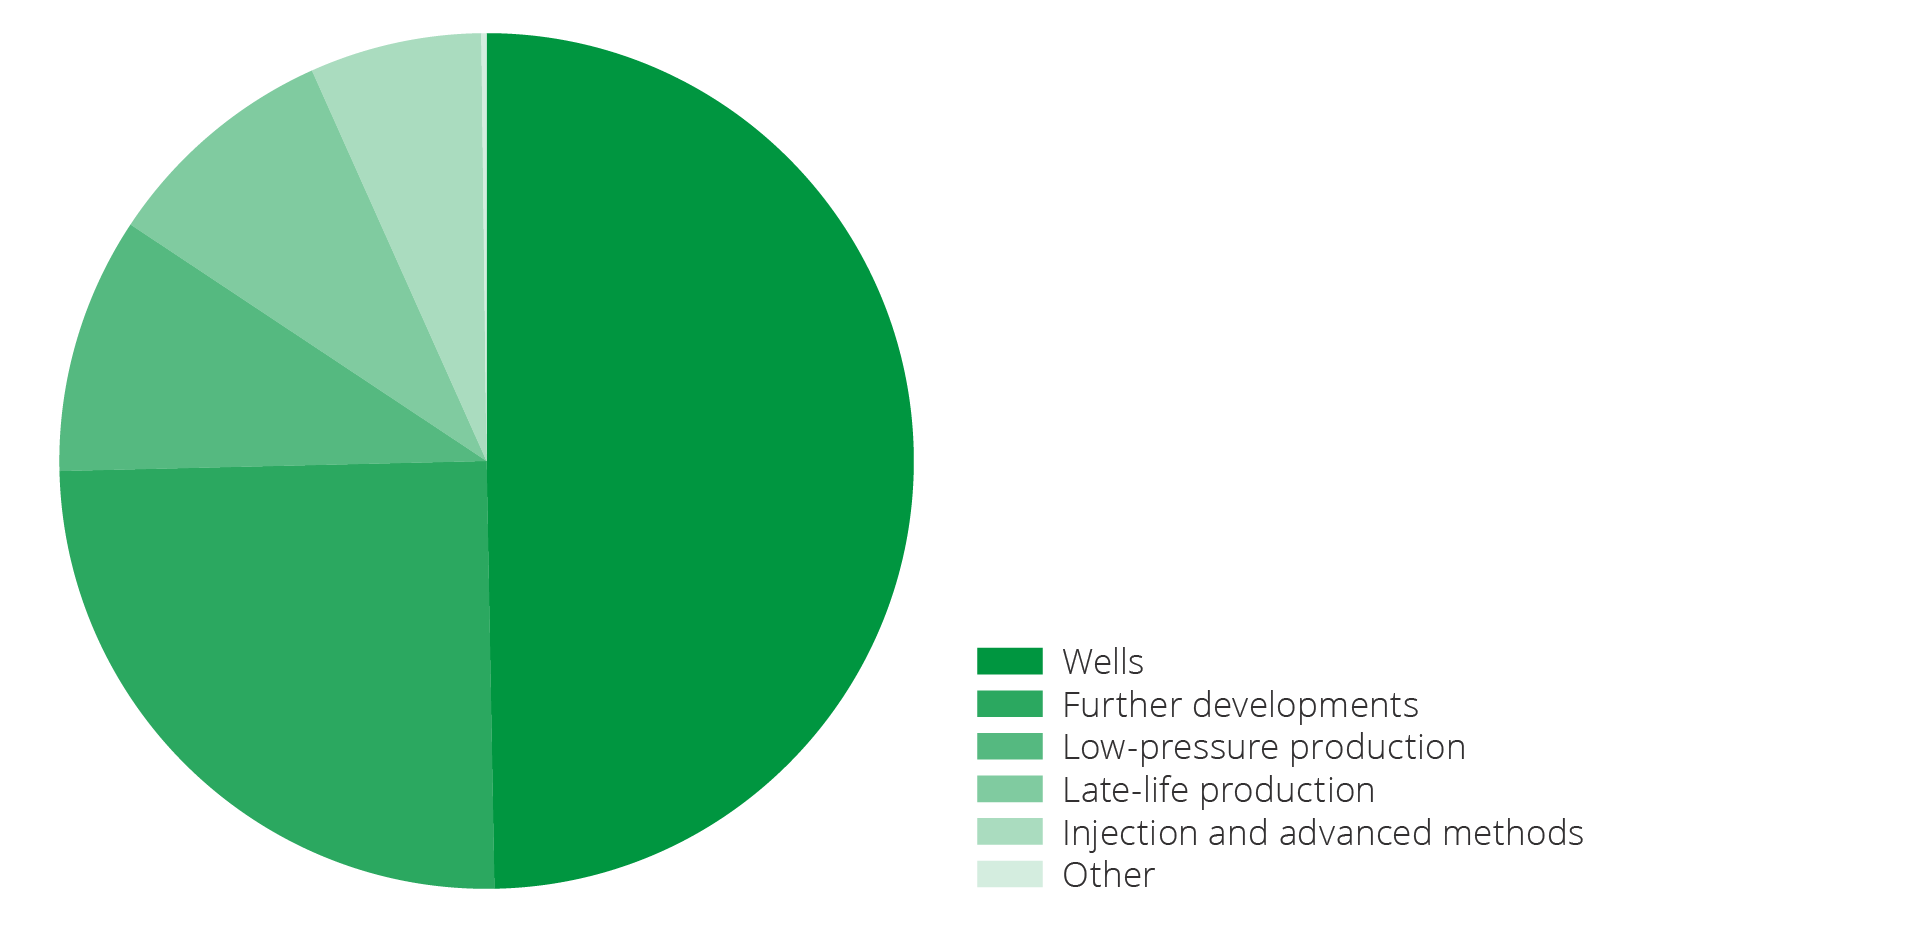
Figure 5.8 Potential measures reported in 2023 for increased recovery of liquids from fields, distributed across different project types. In total, this amounts to about 155 million scm oe of liquids.
Figure 5.9 shows reported, but not approved measures that can contribute to improved gas recovery. Overall, this can result in approximately 170 billion scm of gas if implemented.
The measure that provides the greatest contribution for improved gas recovery is low-pressure production, followed by wells and further development. There are very few reported projects within injection and advanced methods.
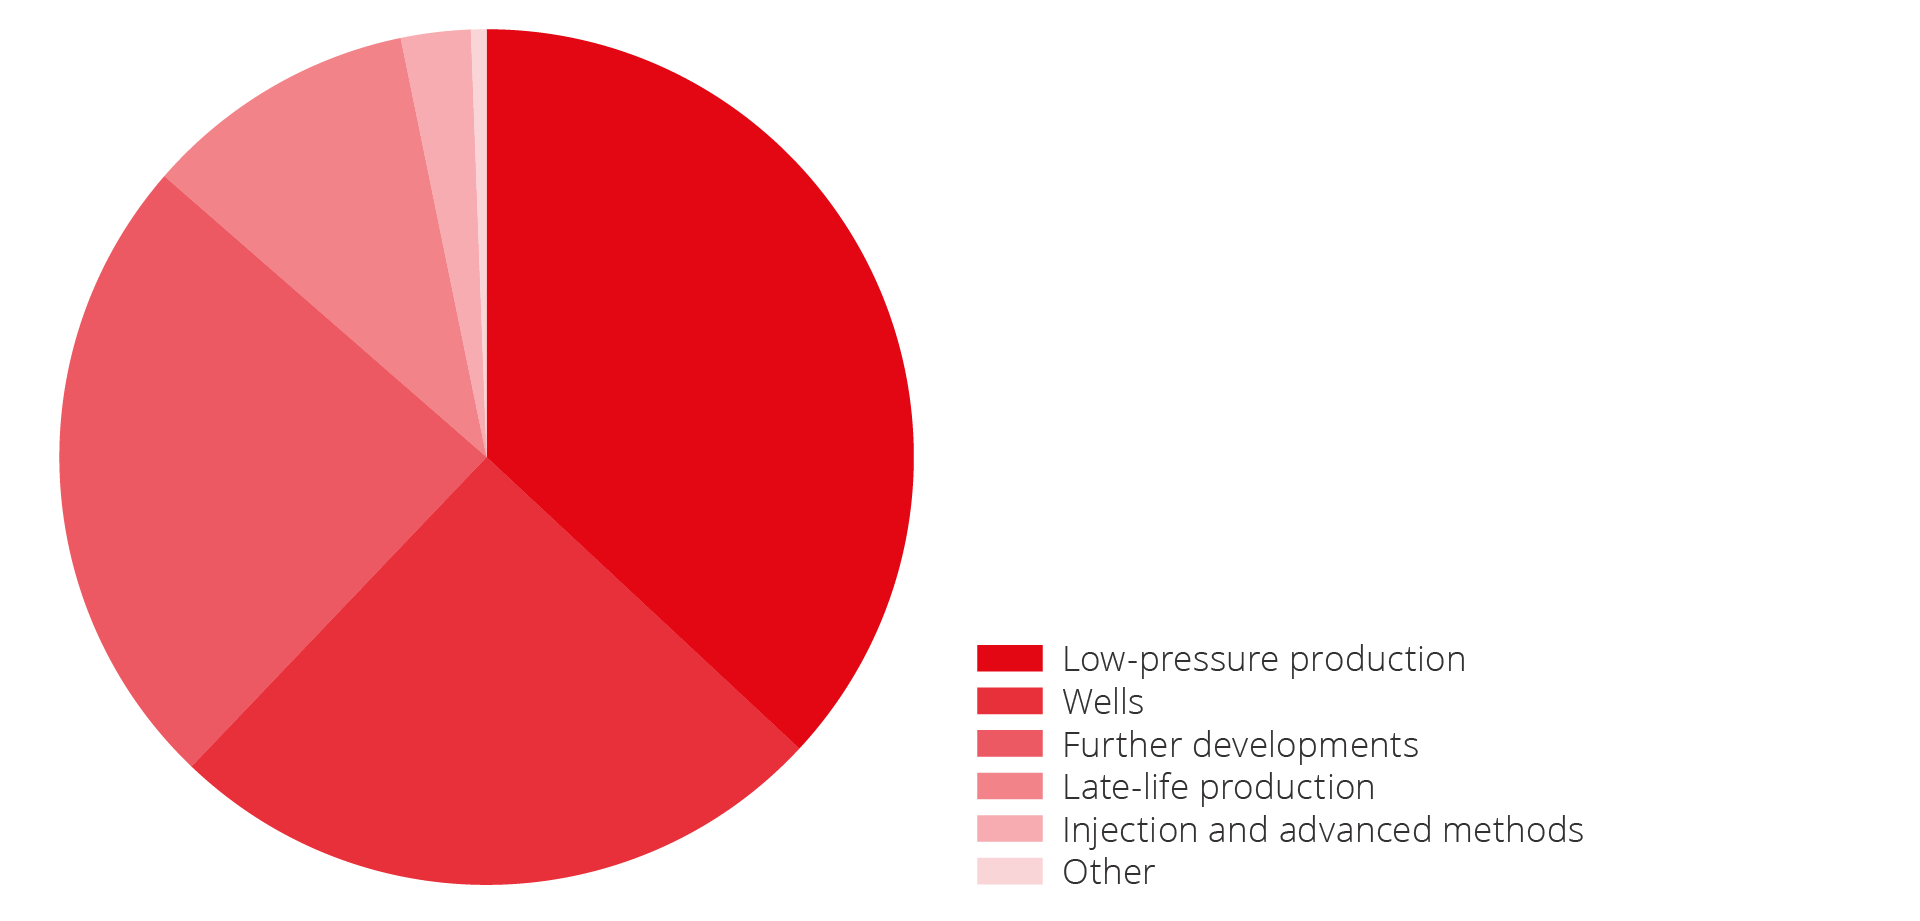
Figure 5.9 Potential measures for improved gas recovery from fields distributed across different project types. In total, this amounts to about 170 million scm oe of gas.
Market failure and improved recovery
The companies' required rate of return and absolute net present value requirements mean that fewer improved recovery projects prevail in the companies' project selection and decision-making processes(25). This means that socio-economically profitable projects are not implemented.
This was also emphasised by the Office of the Auditor General of Norway (the OAG) in their 2015 report, that showed that companies consistently have higher rates of return than the state. This indicates that fewer improved recovery projects are profitable when the companies' own required rates of return are applied.
According to the OAG, this, alongside the companies' limited access to capital, means that projects with a positive net present value with the companies' own required rates of return are not necessarily realised. Only the most commercially profitable projects (projects with high net present value) are realised, as the companies apply additional criteria before they accept a project. The OAG was concerned about a lack of focus on socio-economically profitable measures to increase production from mature fields.
New development wells
Measures to improve recovery are dominated by new wells, both in number and in volume. Drilling new development wells is entirely crucial to slow the decline in production, particularly for oil fields as illustrated in figure 5.10.
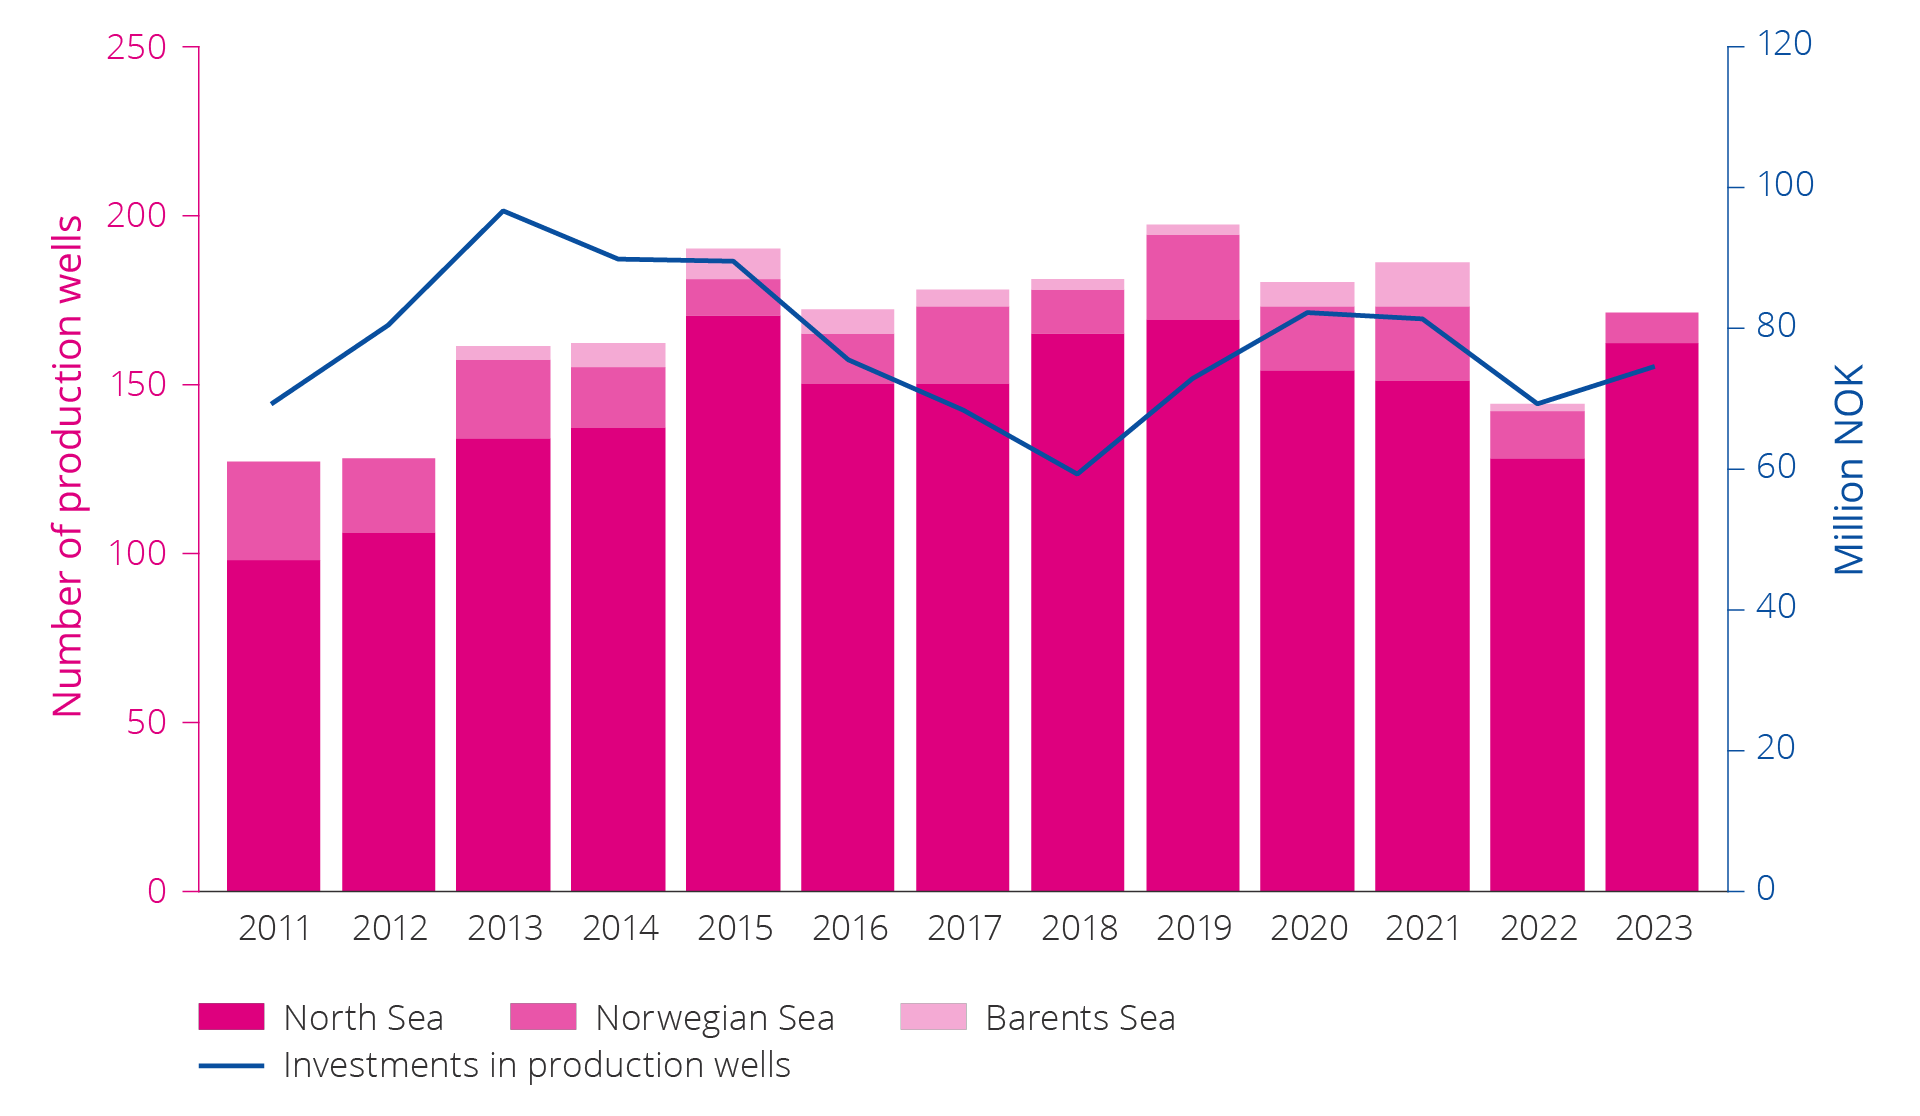
Figure 5.10 Number of development wells and investment in production drilling on the NCS over time from 2011–2023.
Low-pressure production
The pressure differential between the reservoir and the wellhead on the installation is what makes it possible to produce oil and gas. When petroleum is produced from a reservoir without injecting a corresponding quantity, the reservoir pressure will be reduced.
Gas fields do not normally utilise injection for pressure support. Declining reservoir pressure means that the wells will eventually produce at lower rates (volume per unit of time) as a result of the reduced pressure differential. One measure that can be implemented to maintain higher production rates is lowering wellhead pressure.
Lower wellhead pressure increases the production rate from the wells and ensures that a greater share of the resources can be recovered. This is achieved either by installing compressors between the wellheads and the process plant, or by lowering the receiving pressure at the installation/onshore facility. Åsgard and Ormen Lange are examples of fields that have, or are in the process of, installing seabed compression. Onshore compression for the Ormen Lange field started in 2019, and the field is now being further developed with subsea compression. The plan for development and operation was approved in 2022. Two compressor stations that handle rich gas will be installed on the seabed near the wellheads. This is expected to improve recovery by up to 30-50 billion scm of gas from Ormen Lange, which is expected to increase the field's recovery rate from 75 to 85 per cent; see figure 5.11.
If low-pressure production is implemented by reducing the receiving pressure at the installation/onshore facility, processing capacity will be affected. At this point, it may be necessary to modify the export compressors, in order to continue delivering gas that satisfies the required export pressure.
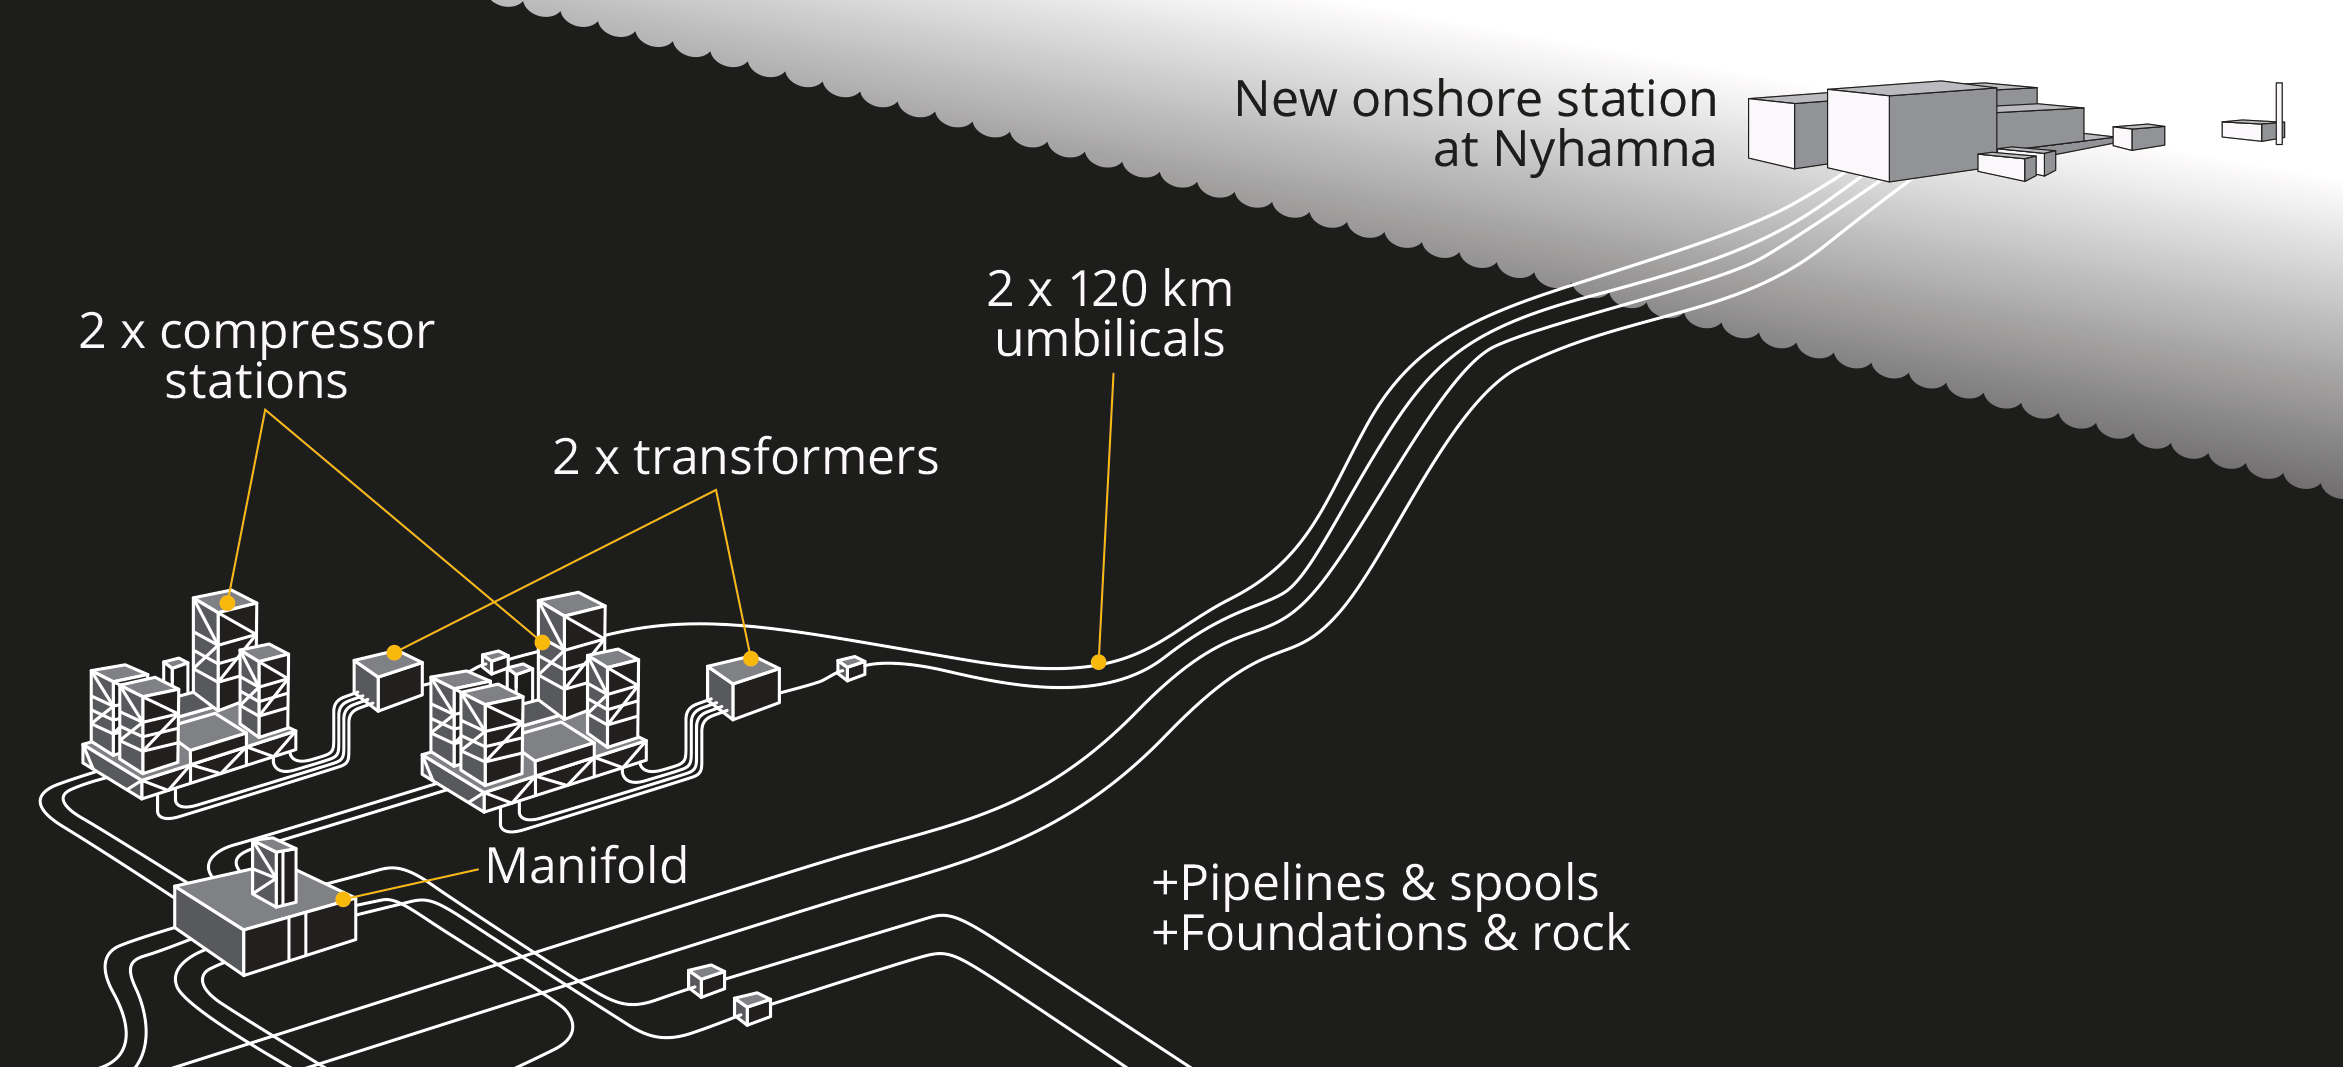
Figure 5.11 Ormen Lange subsea compression (adjusted according to illustration from Shell).
Phasing in discoveries to existing fields and infrastructure
Phasing in discoveries to existing fields can help extend the lifetime of the host field and thereby ensure continued profitable production and improved recovery.
The example in figure 5.12 is from the NCS and shows that a new discovery helps keep unit costs down. This can contribute to an extended field lifetime and provide incentives for further exploration in the area.
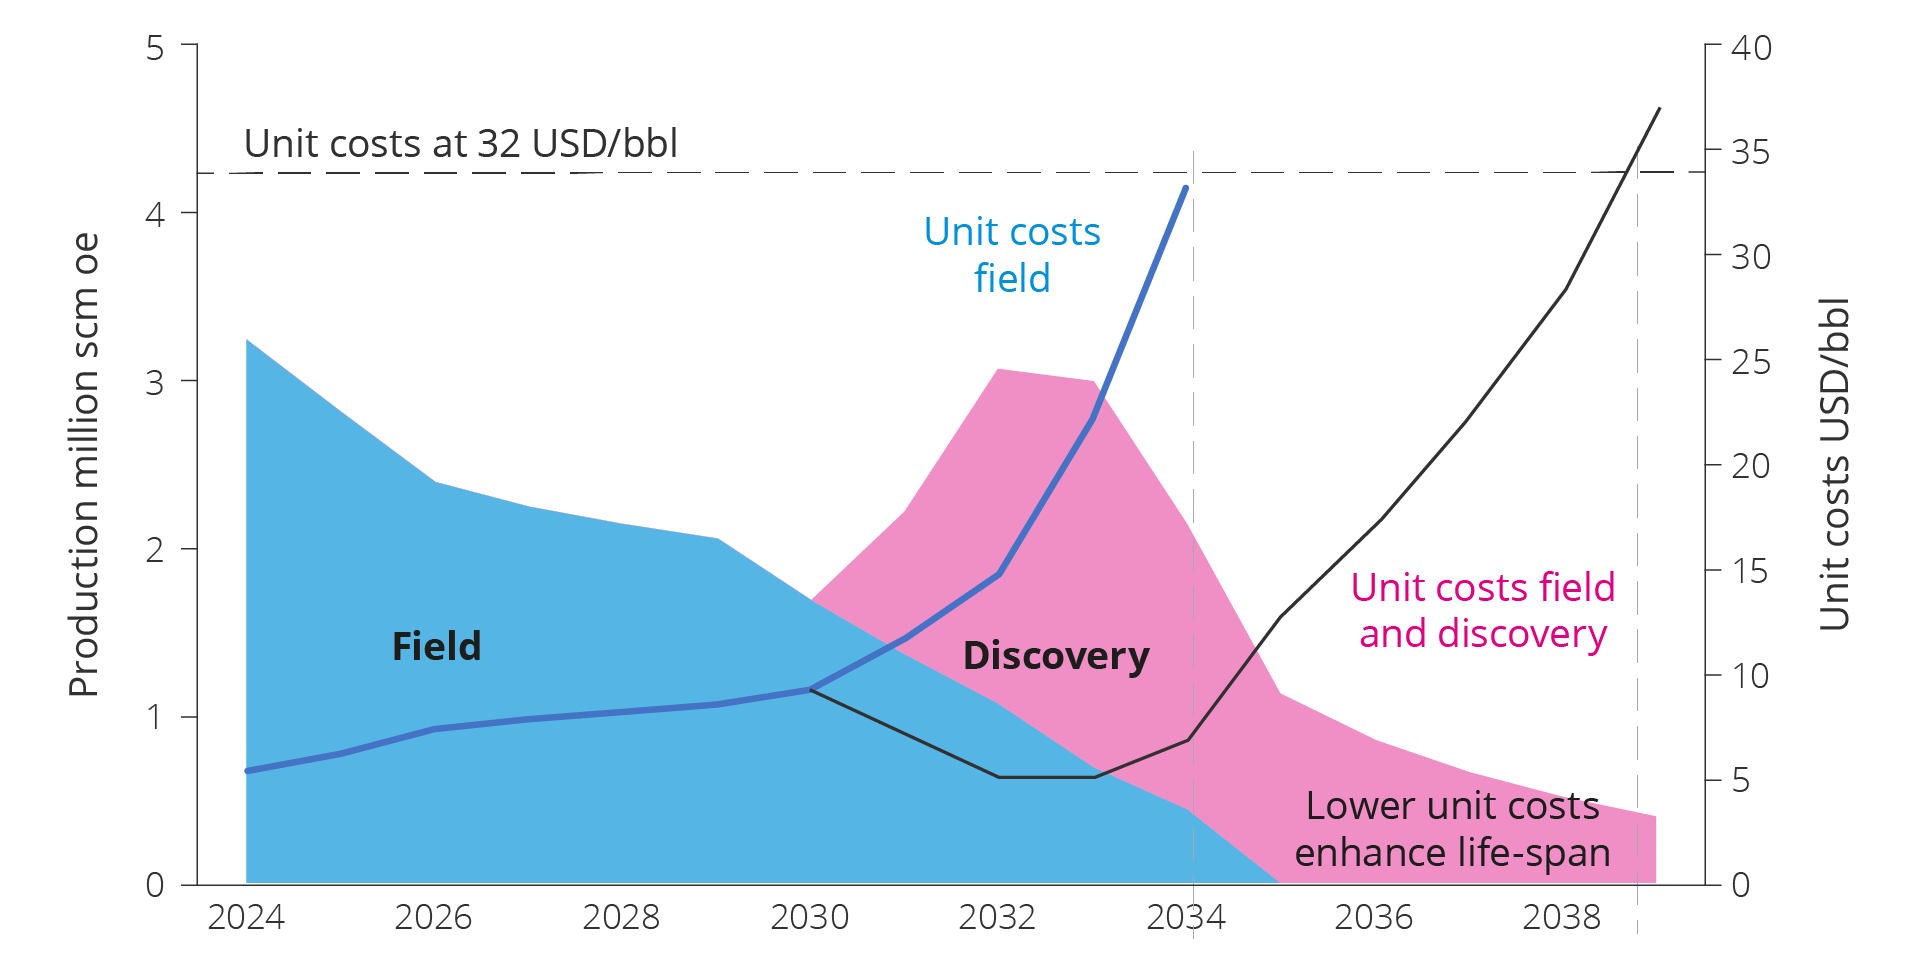
Figure 5.12 Connecting new discoveries to existing fields and infrastructure.
Time-critical resources
Time is a critical factor for a tie-back to a producing field (host field) due to its limited lifetime as well as rising unit costs as the host field approaches shutdown. It is important that the phase-in takes place before the unit cost of the host becomes too high. For this reason, future development of discoveries is not only dependent on available capacity, but also capacity at low unit costs; see chapter 6, exploration creates substantial values.
Several of the phase-in projects are in addition complex, and low capacity in process and transport systems or competing alternatives can affect the solution selection. Different ownership structures can also make it challenging to find good solutions across fields, discoveries and infrastructure.
Unit costs and need for consolidation
Eventually, the access to resources from new discoveries will be insufficient to counteract production decline from the fields, and there will be a need for consolidation to avoid exceedingly high unit costs. Consolidation may result in decommissioning of certain installations and optimisation of remaining infrastructure utilisation.
The decommissioning of installations may also result in the loss of exploration opportunities or other projects aimed at increasing access to resources in an area. The value of these resources must be weighed against the cost of maintaining infrastructure with high unit costs. Area analyses indicate that the loss of resources and value as a result of decommissioning can be mitigated in areas with well-developed infrastructure, by re-directing resources to another host field. However, this is difficult to achieve in practice; see fact box on market failure in the phase-in of discoveries. Experience indicates that fields, discoveries and undiscovered resources must be viewed in context before such decisions are made, so that necessary studies for this are conducted in time.
Resources and challenges in discoveries
The production decline can be slowed if discoveries are developed and put on stream; see figure 5.13. At the end of 2023, there were 79 discoveries (see note in resource classes 4F, 5F, 7F in the Resource Accounts for 2023) on the NCS where no decision had yet been made to develop, but where the licensees are considering development.
Resources in discoveries total 494 million scm oe, split between 261 million scm of liquids and 233 billion scm of gas. Together, the size of the resources in the 79 discoveries is on par with the original resources in the Åsgard field.
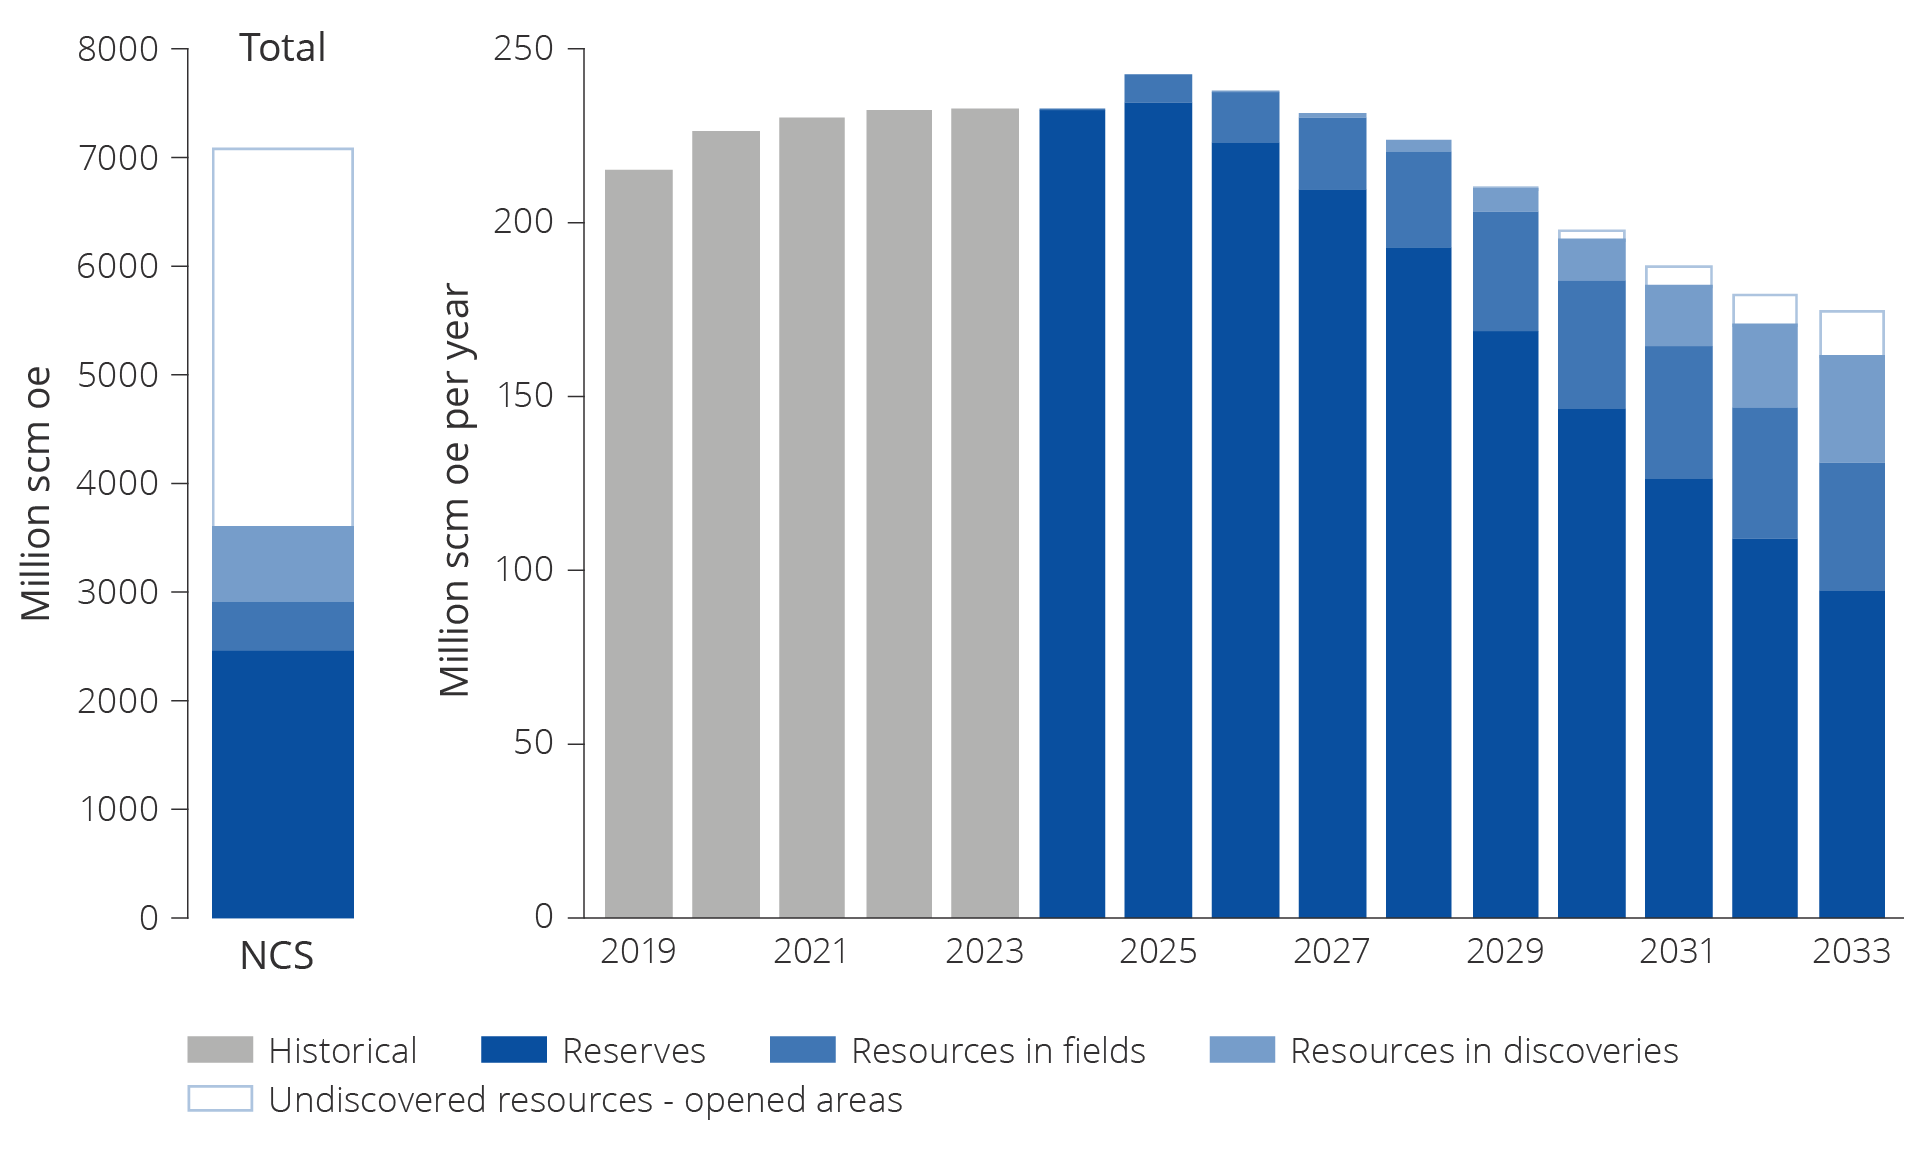
Figure 5.13 Remaining reserves and resources in fields and discoveries. Historical total production from 2019–2023 and expected future production from reserves and resources in fields for the period from 2024–2033.
The discovery portfolio is shown in figure 5.14 according to size per NCS area. There are certain larger discoveries and several minor ones in all three petroleum provinces on the Norwegian shelf. Most discoveries are in the North Sea.
There are few discoveries of sufficient size to help maintain production in the future. The largest discoveries are 7324/8-1 (Wisting) in the Barents Sea, 6406/9-1 (Linnorm) in the Norwegian Sea and 35/2-1 (Peon) in the North Sea.
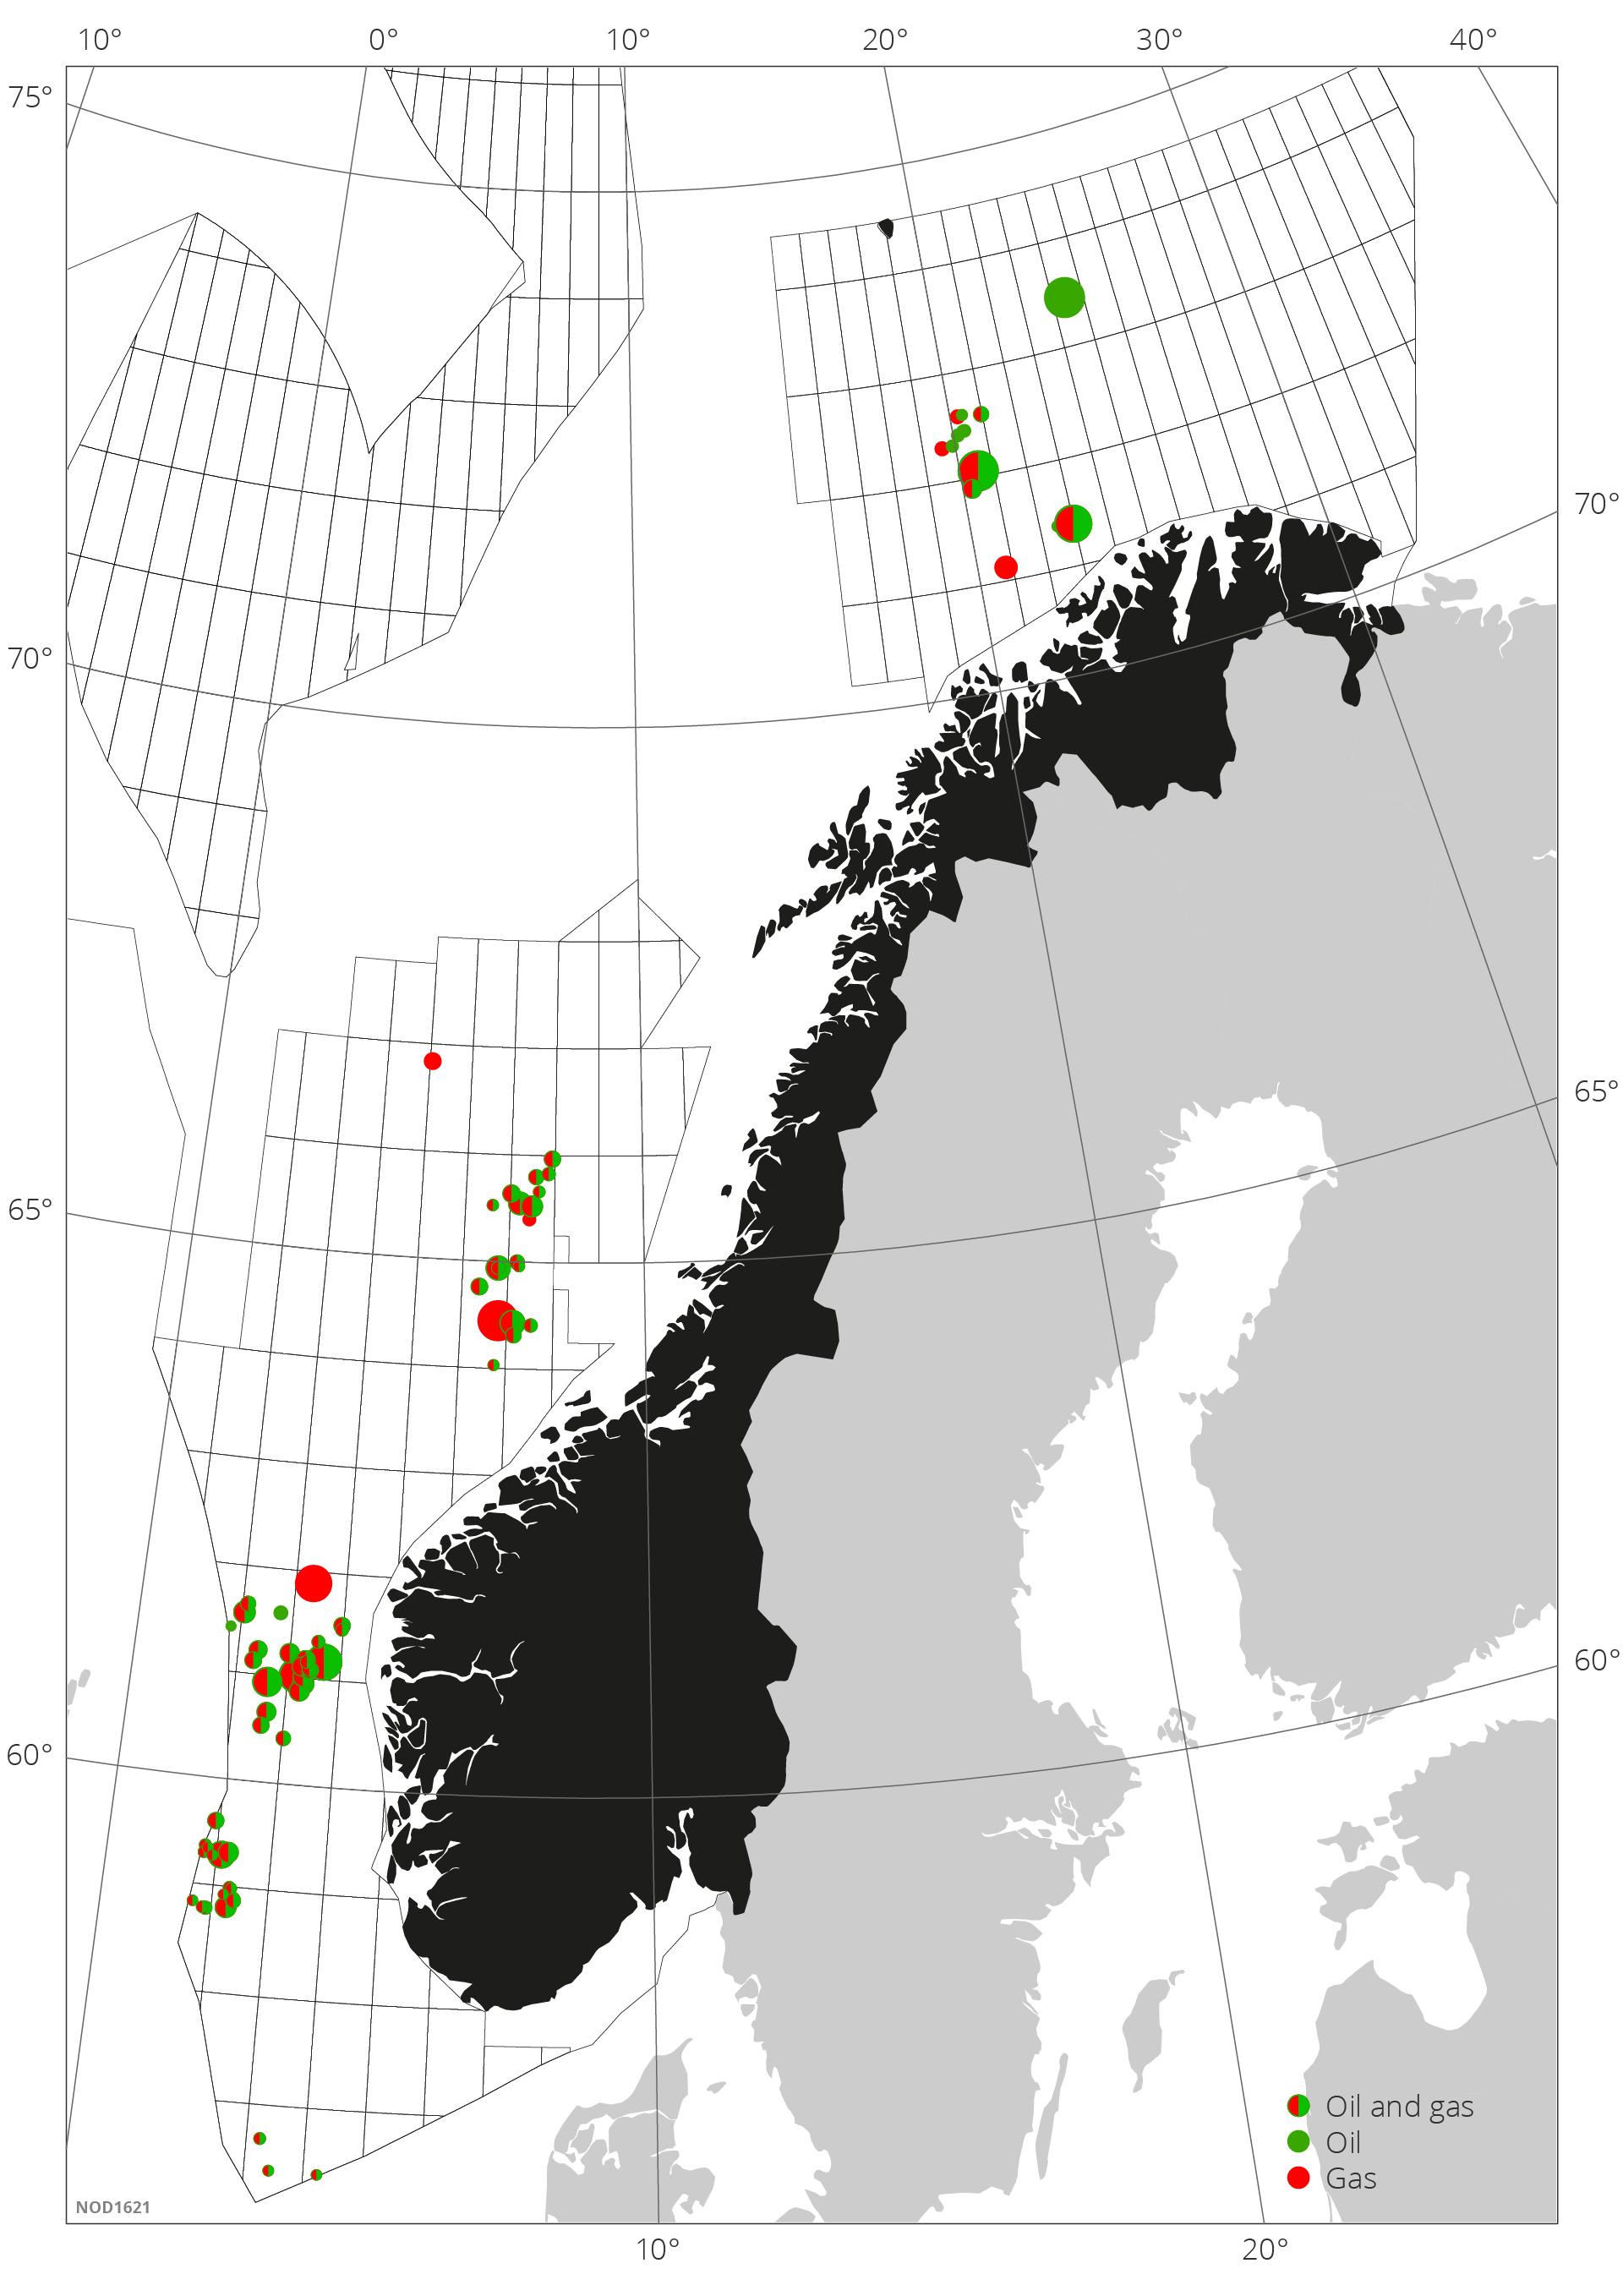
Figure 5.14 Discovery portfolio as reported in RNB (including all discoveries in resource classes 4F, 5F and 7F at the end of 2023). Phase (oil = green, gas = red) is indicated in circles. The size of the circles represents the relative size of the discoveries, so the largest circle illustrates the discovery with the biggest volume.
Tie-backs to existing infrastructure
Most discoveries in the portfolio are located near existing infrastructure and are planned for development as tie-backs/phase-ins to existing infrastructure; see figure 5.15.
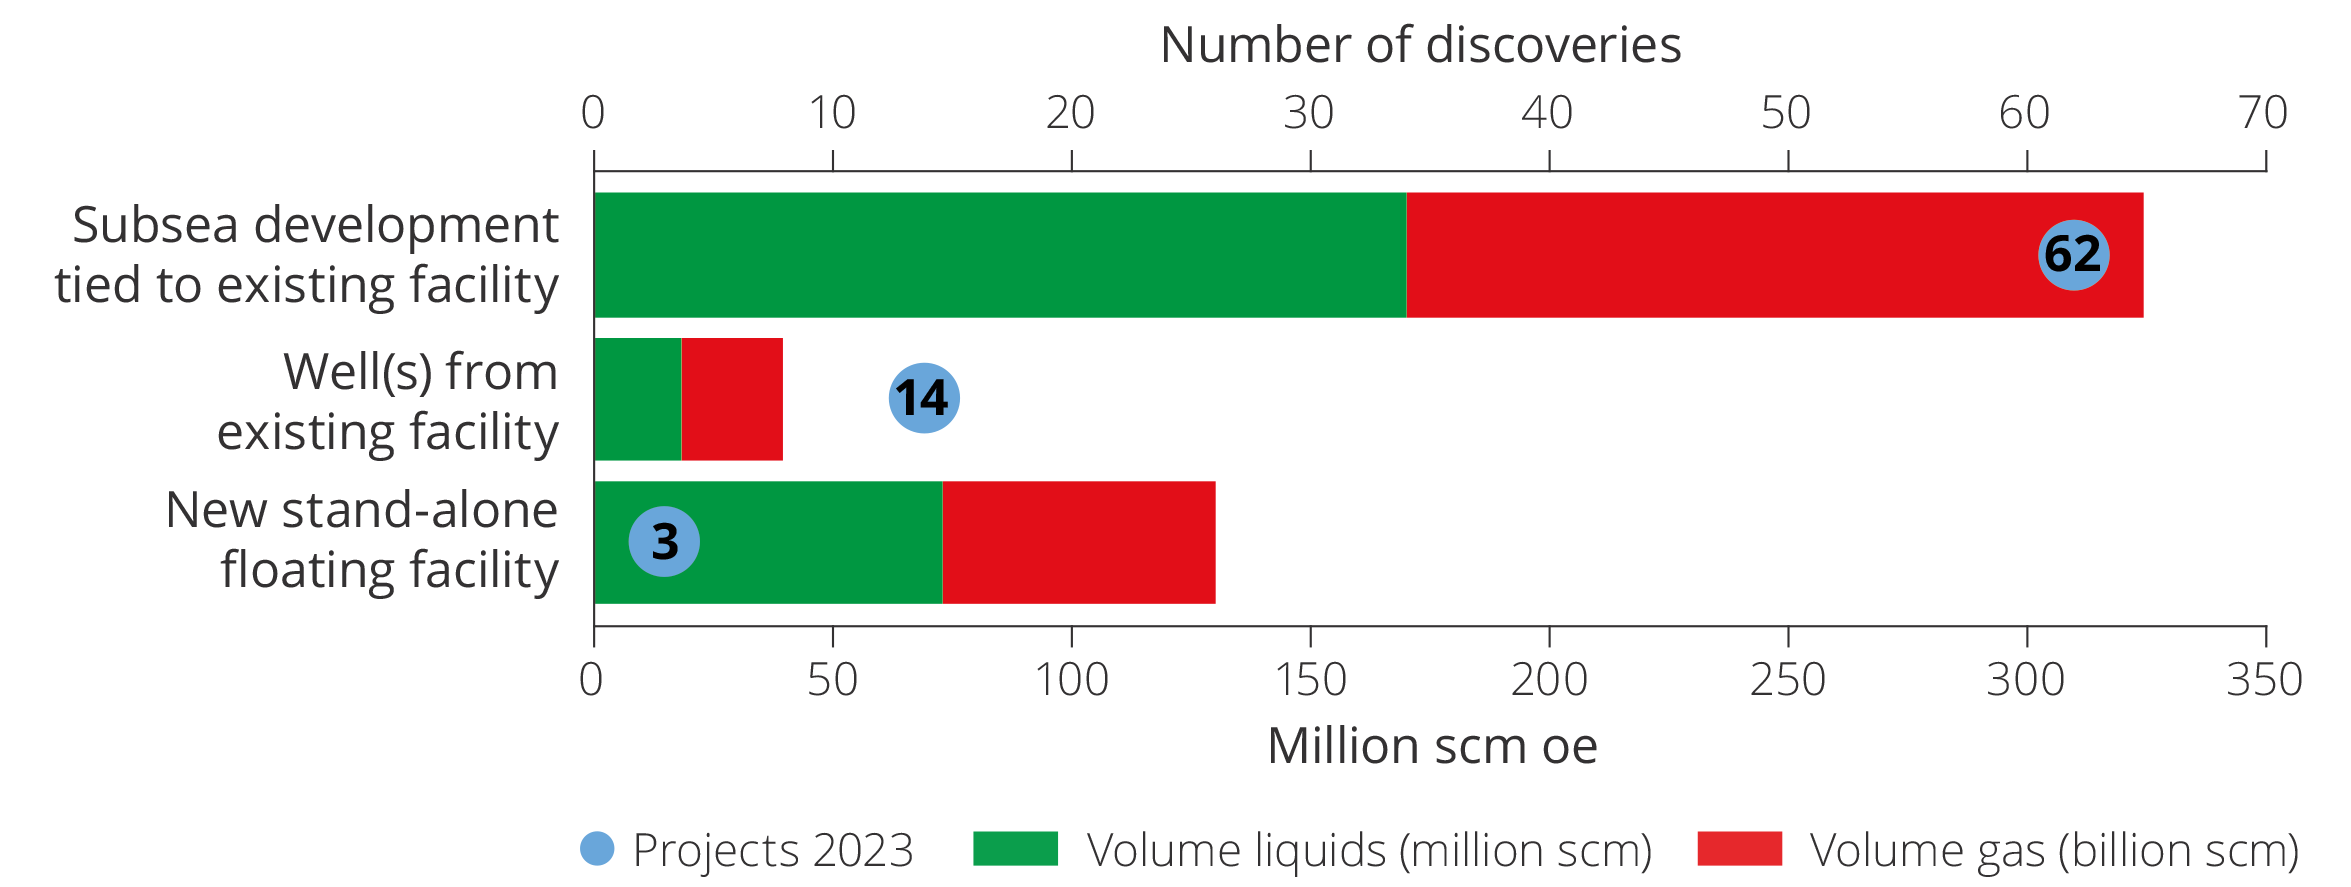
Figure 5.15 Likely development solutions for the 79 discoveries in the discovery portfolio as of 31 December 2023, and total resources per development solution.
Development with phase-in to existing fields or other major development projects is planned for 76 of the 79 discoveries in the portfolio.
The most common concept is subsea developments. This is the most likely solution for 62 of the discoveries. Another possible solution for smaller discoveries close to infrastructure, is to use vacant well slots on existing fields. This solution has been presumed for 14 discoveries.
Market failure in phasing in discoveries to existing fields and infrastructure
Connecting a discovery to a producing field frequently requires complex and time-consuming negotiations. This is often caused by differing ownership compositions in the production licenses, and that the owners can be on both sides of the table.
In addition to complex ownership compositions, the owners often have other special interests linked to nearby infrastructure that complicate a straightforward approach. Different strategic interests and asymmetrical information will challenge the negotiations and involve considerable transaction costs and plenty of time.
Maximum value creation can be achieved if negotiations result in the same solution that would have been chosen if the owners of host and satellite fields are the same.
However, free negotiations will not necessarily lead to such a solution. On the contrary, they can lead to a loss of efficiency.
One reason why negotiations do not necessarily lead to the best solution is that the host field is in a monopoly position. Stand-alone development is not profitable and the absence of other host fields in affordable proximity leave the field stranded. Monopoly solutions can frequently result in overpricing and under-supply.
Furthermore, different access to information (asymmetrical information) between contracting parties can result in prolonged negotiations, if they succeed at all. Another market failure may arise from vertical integration, where the owner of the infrastructure is also the user.
Market failure presents multiple reasons for the authorities to intervene in tie-back agreements. At the same time, the authorities face some of the same challenges themselves, for example asymmetrical information, which makes it difficult to achieve efficient direct regulation.
The Norwegian policy is therefore to address each negotiated tie-back agreement separately. The Regulations relating to the use of facilities by others(27) outlines several principles and procedures for the parties' negotiations, in an effort to reduce transaction costs and prevent exceedingly lengthy negotiations.
Stand-alone developments
Investment in stand- alone production facilities require relatively large discoveries or coordination of multiple small discoveries. Coordination of multiple discoveries leverages economics of scale and contributes to lower unit costs compared to developing and producing the discoveries separately. Despite the obvious rationality of coordinating discoveries, such coordinated solutions may not necessarily be realised due to differing ownership interests and asymmetrical information as discussed in the market failure box above.
Stand-alone developments in areas without access to adequate process or transport capacity, or where the distance to existing infrastructure is significant, can be crucial for the development of other resources in the area. Establishing new capacity will allow for phasing-in future discoveries, and will make it possible to develop older discoveries that are not profitable today.
New infrastructure in these areas should have the flexibility to accommodate other discoveries, proven or future. The Norwegian Offshore Directorate has been particularly concerned with ensuring that the development of 7324/8-1 (Wisting) has the flexibility to also accommodate future additional resources. This particular area in the Barents Sea, has significant resource potential, but there is no existing infrastructure.
7324/8-1 (Wisting)
7324/8-1 (Wisting) in the Barents Sea is the largest oil discovery on the NCS that has yet to be developed. The licensees are working on the project, which is also a strategically important for developing infrastructure in this region. If the development solution has the flexible capacity to accommodate future additional resources, the value of the oil and gas resources in the area will increase.
Different solutions are being considered for the gas volumes, including a coordinated solution with the Johan Castberg and Snøhvit fields. More information about this can be found in the Norwegian Offshore Directorate's annual report for 2023.
Too few discoveries are realised
In addition to high returns, licensees on the NCS require the development of discoveries to be economically resilient against oil and gas prices that are substantially lower than forecasted (see also fact box on market failure and improved recovery in chapter 5).
As a consequence, socio-economically profitable discoveries can end up not being developed and investments, production and value creation on the NCS would decrease for society.
Break-even price as a criterion for decision-making
The break-even price illustrates a project's resilience against lower market prices. It is defined as the average future oil price a discovery needs to achieve in order to cover all future investments and operating costs and simultaneously yield a good return on capital.
Since the oil price plunge in 2014, break-even price requirements have increasingly been used as a criterion to assess whether or not to develop a discovery. For example, a 30 USD/bbl break-even price requirement could mean that projects with a higher break-even price are not realised. Break-even price requirements are also used to choose development concept(29).
Break-even price developments
The Norwegian Offshore Directorate has compared the relationship between break-even prices and actual oil prices from 2010 to 2024 for 94 different projects, 71 of which were discoveries. This comparison shows that, with the exception of 2 projects, the break-even price was lower than the oil price when the PDO was approved. With a few exceptions, the calculated break-even price has been below USD 60.
During the period from 2010 until the oil price plunge in 2014, the break-even price was higher than during the subsequent period leading up to the pandemic in 2020. The results are shown in figure 5.16.
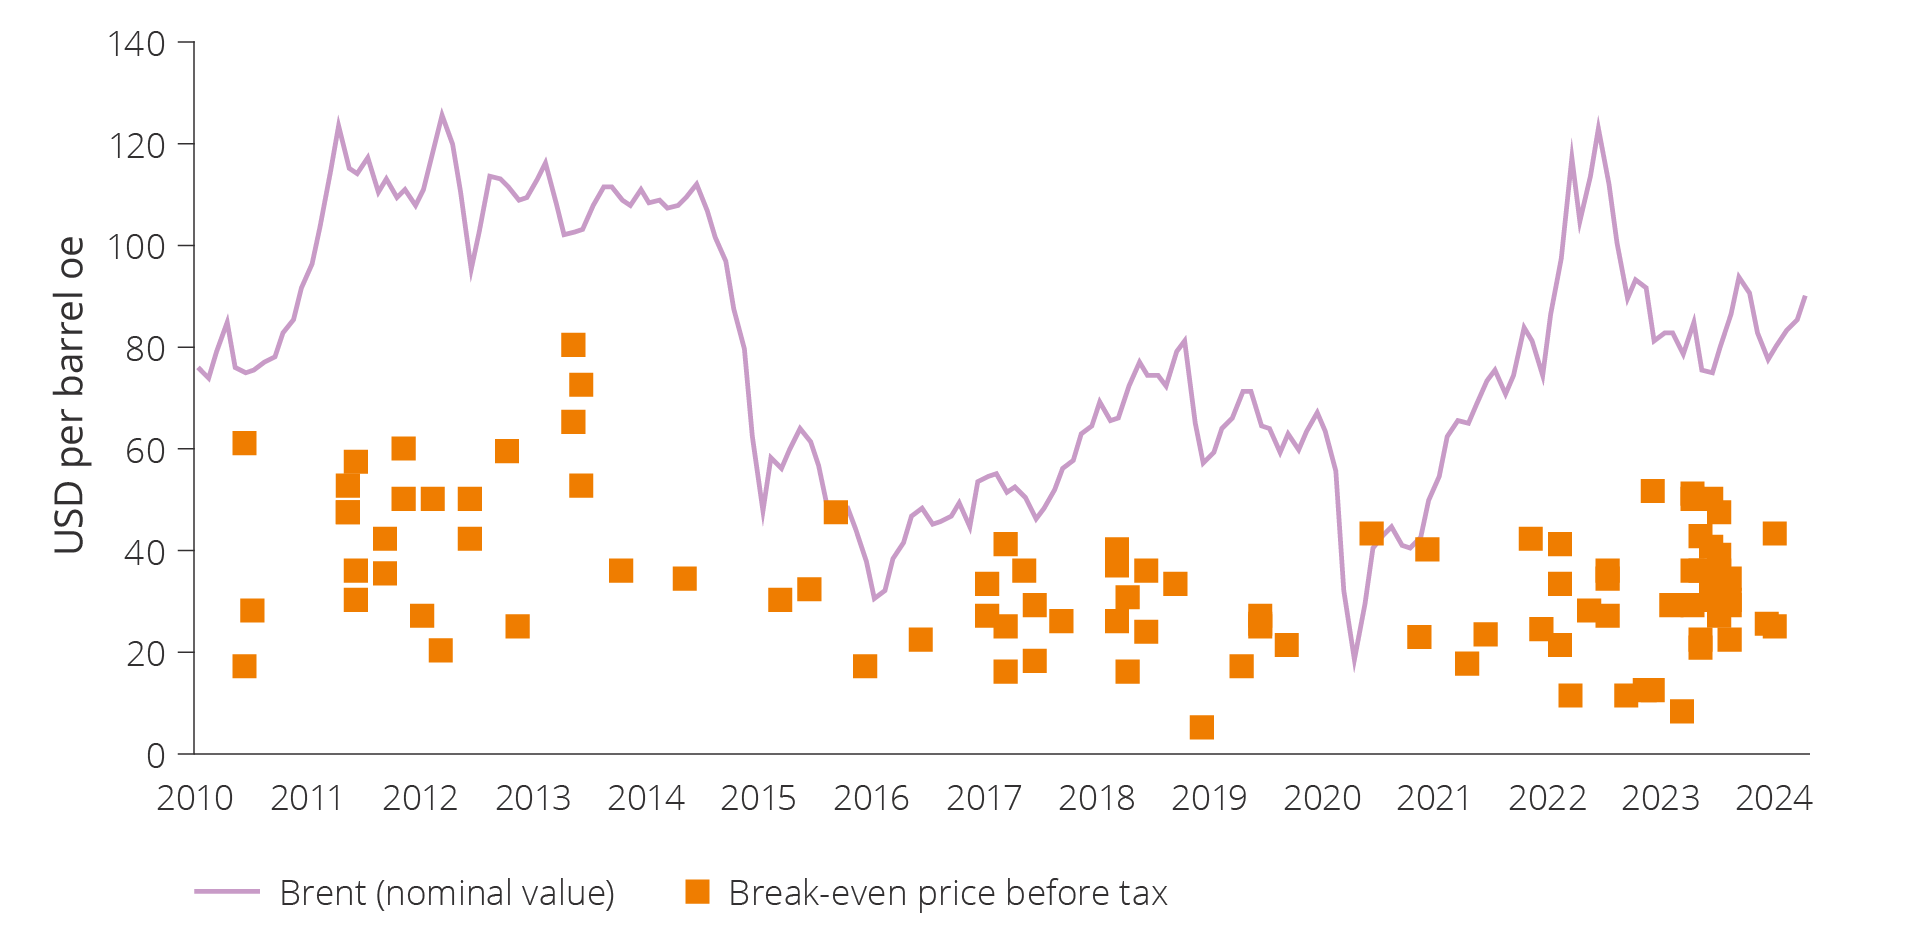
Figure 5.16 Break-even prices before tax for development projects with PDO, amended PDO or PDO exemption. The figure shows the break-even price for different discoveries (fields) when the PDO was approved. The break-even price is calculated with a 7 per cent discount rate.
More PDOs were submitted after 2020 than during the preceding period. As many as 13 PDOs were submitted in 2022. There have been more discoveries with a break-even price exceeding 40 USD/barrel after 2020, compared to the period following the oil price decline in 2014 up to 2020.
There are various explanations for this development. One could be the temporary amendments to the Petroleum Tax Act(30), which in a situation characterised by immense future uncertainty, were introduced to prevent development projects from being shelved during the 2020 pandemic.
This adjustment, combined with oil and gas prices eventually rising from a very low level in 2020, prevented the projects from being put on hold. The increased prices also led to a gradual rise in future price expectations, thereby reducing uncertainty about the future.
The comparison shows that the value of all projects realised under the temporary tax amendment from 2020–2022 is significant. The net present value amounts to 450 billion 2024-NOK. The projects are ranked according to their net present value as shown in figure 5.17.
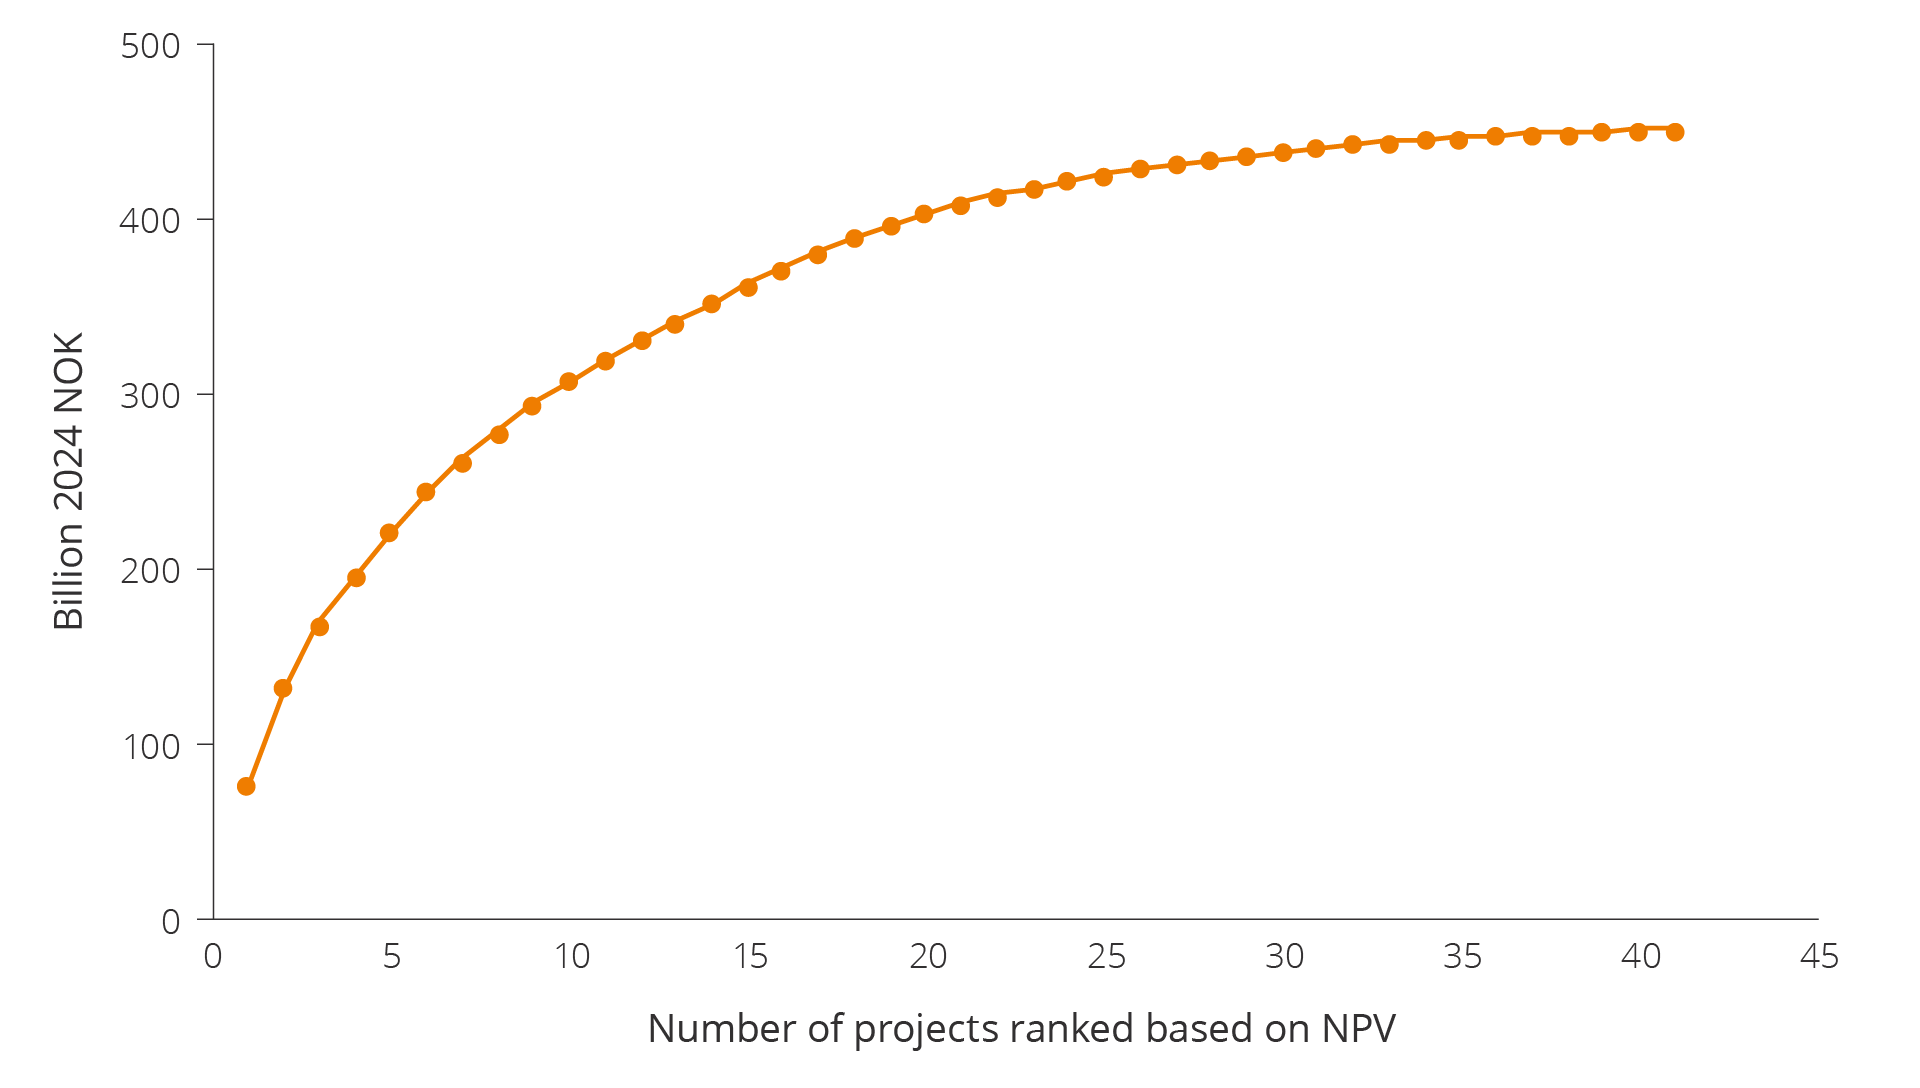
Figure 5.17 Accumulated value from projects realised under the temporary tax amendment in 2020–2022. Product prices are projections from the national budget/revised national budget.
Undeveloped gas discoveries
82 gas discoveries have yet to be developed. Two of the largest are 35/2-1 (Peon), a very shallow gas discovery in the North Sea, and 6406/9-1 (Linnorm) in the Norwegian Sea, which has somewhat tight reservoirs deep below the seabed. Extraction is highly unlikely for 47 of these discoveries; resource class 6; see chapter 3).
Shallow or tight reservoir are two of the reasons why discoveries are not developed. One of the primary challenges associated with shallow reservoirs is low pressure. Challenges associated with tight reservoirs include low flow rates.
Other reasons include difficult gas compositions that can be expensive to produce or treat. There could also be a lack of nearby infrastructure. Licensees and operators de-prioritise the development due to a lack of personnel, technology and materials. The reasons for delaying developments are diverse and often complex; see also market failure in chapter 3.
Targeted efforts to implement technology to increased productivity in tight and shallow gas reservoirs can contribute to improved recovery and value creation and is further discussed in chapter 6.
Examples of undeveloped gas discoveries
35/2-1 (Peon)
Peon in the North Sea is one of the largest gas discoveries on the NCS that has yet to be developed. The discovery was made in 2005 and is located north of the Gjøa field. 27 billion scm of gas has been proven. The resources are located less than 1000 metres below sea level and in somewhat unconsolidated sandstone. The gas is dry, meaning that it consists of nearly pure methane (99.5 per cent).
One of the primary challenges associated with shallow reservoirs is low original pressure and therefore low gas density (Resource report (2019)(31). This makes it difficult to achieve effective drainage of sufficient volumes per well.
Because the reservoir in 35/2-1 (Peon) is very shallow, a test well was drilled in 2020 to confirm the possibility of drilling a relief well. Compression may be needed to recover the gas, either offshore or at a receiving facility. As of 2024, the licensees are working on studies to choose a development solution.
6406/9-1 (Linnorm)
In the Norwegian Sea several discoveries were made in tight reservoirs, including 6406/9-1 (Linnorm). This reservoir is located 5000 metres below sea level and has a relatively high content of both CO2 and H2S. Recovery is difficult due to pressure as high as 840 bars, temperature as high as 184 degrees and a complex reservoir with variable quality.
This discovery consists of large accumulations of gas in deep and tight reservoirs. High pressure, high temperature and cementation as a result of increasing depth all contribute to difficult extraction of the resources (see also Resource report 2017(32).
Poor gas quality can represent a considerable cost for discoveries that already face other challenges, such as considerable water depth, a tight reservoir or a significant distance to existing infrastructure.
In some instances, delaying a development could open up new possibilities. New technology can help ensure that more of the gas in tight zones can be recovered. This can also result in a diminished need for investments to remove CO2 due to the new opportunities for dilution.
Exploration builds the foundation for long-term production
There are still substantial undiscovered resources on the NCS. Undiscovered resources are the volumes of petroleum estimated to be recoverable from accumulations that have not yet been proven by wells. To secure sufficient resources and sustain both activity and production over time, exploration must be intensified, both near existing infrastructure and in less mature areas.
Undiscovered resources represent significant opportunities in both mature and less explored areas. Increased understanding, better data coverage, new ways of working and the application of emerging technologies can lead to new exploration opportunities and result in profitable discoveries.
The expected undiscovered resources contain assumptions concerning the number and size of undiscovered petroleum accumulations. Based on these assumptions, and including estimates for well counts of future wildcat wells, discovery rates and lead times from discovery to first oil, a production forecast for these future discoveries is calculated.
The volumes we project that can come on stream until 2033 are shown in figure 5.18. Since it can take several years from when a discovery is made until it comes on stream, production from exploration will be limited leading up to 2030.
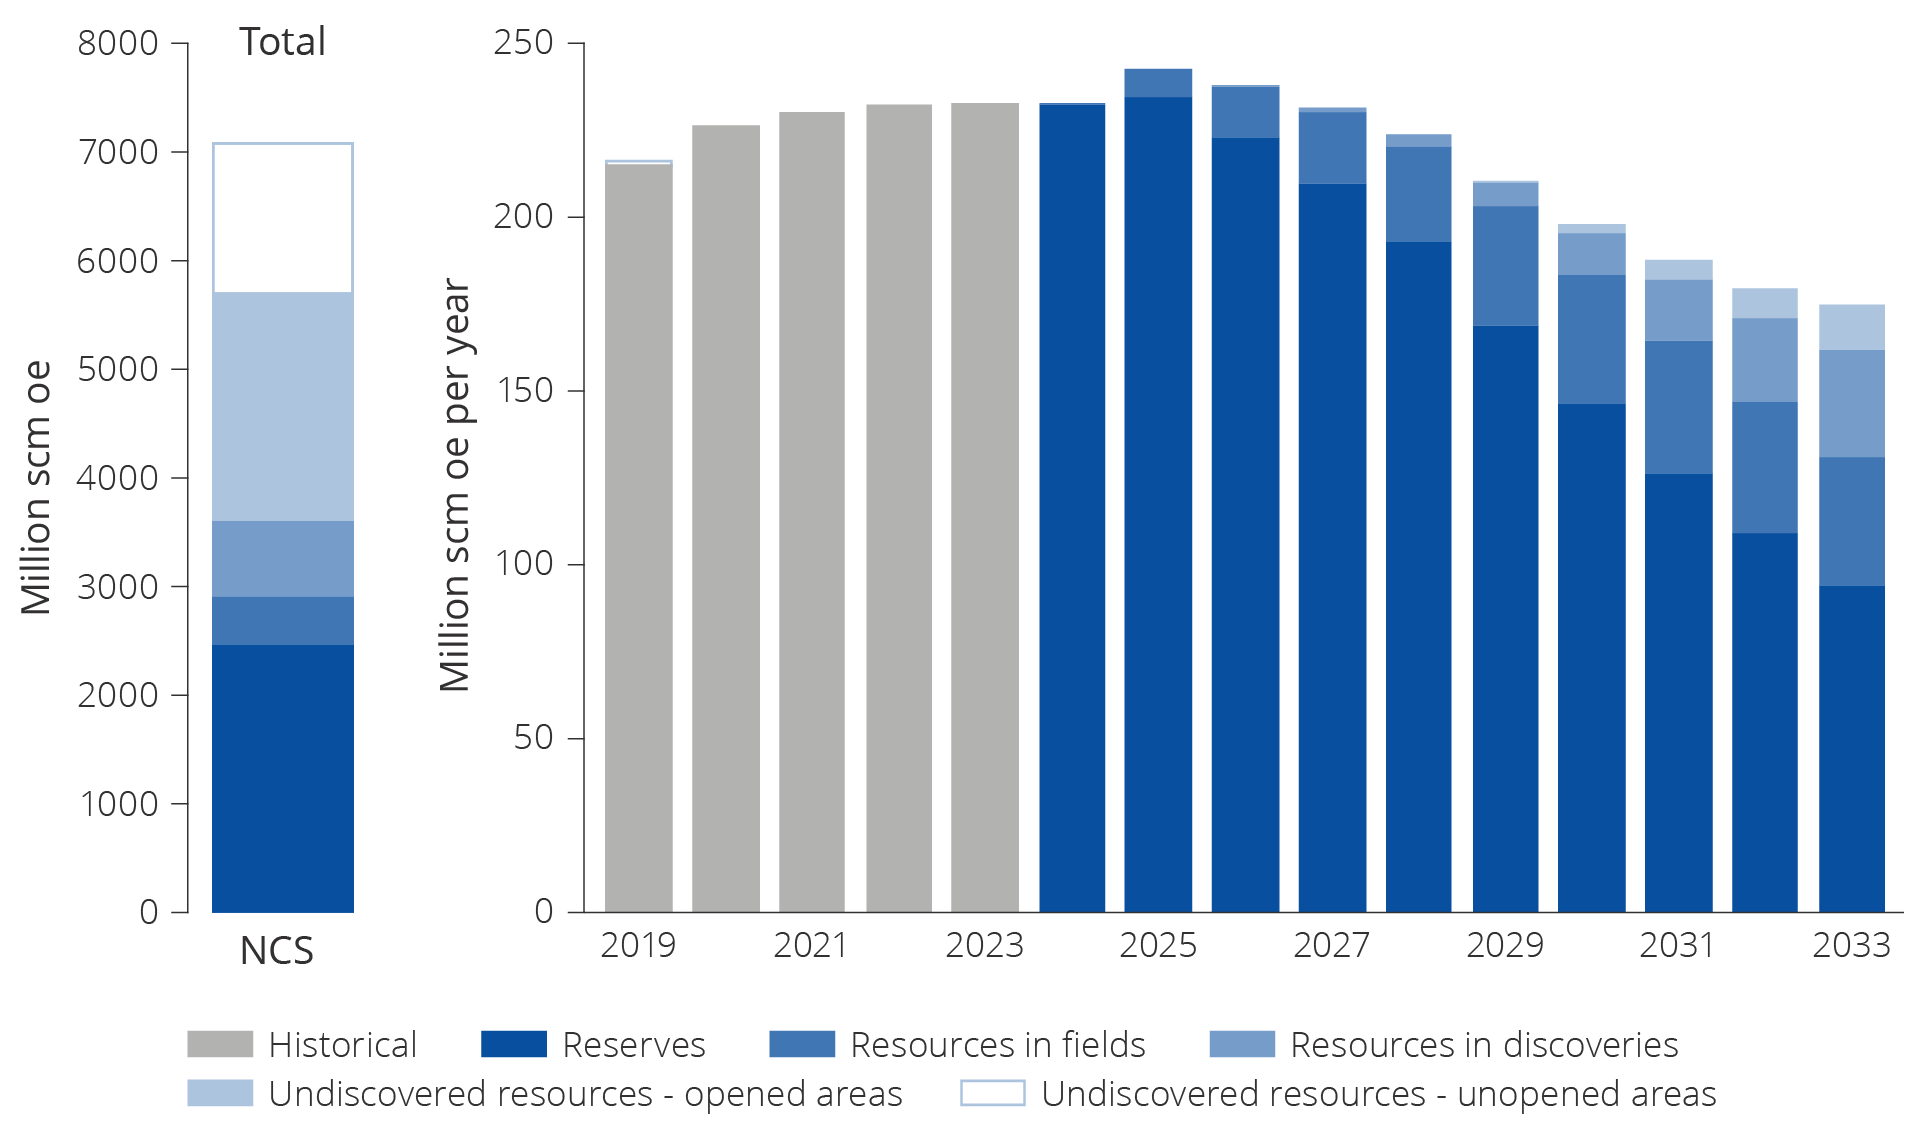
Figure 5.18 Remaining reserves and resources. Total historical production 2019–2023, expected future production from reserves and resources in fields and discoveries and undiscovered resources in opened areas in 2024–2033.
Substantial undiscovered resources
The Norwegian Offshore Directorates responsibility is to have the best knowledge on the resources on the NCS. It is therefore important to maintain the best possible and most up-to-date overview of the resource base. This is achieved through the Directorate's own geological work and data collection, by obtaining and processing external data, including data from the industry. Continuous review and application of established methodologies to evaluate the resource potential and increase the understanding of the resource base are key.
The updated estimate for undiscovered resources is 3480 million scm oe (figure 4.3, chapter 4). More than half (60 per cent) of the undiscovered resources are expected to be in areas already opened for petroleum activities. They are distributed across the shelf with 28 per cent in the Barents Sea, 14 per cent in the Norwegian Sea and 18 per cent in the North Sea. Figure 5.19 shows the distribution of resources in opened and unopened acreage for each region.
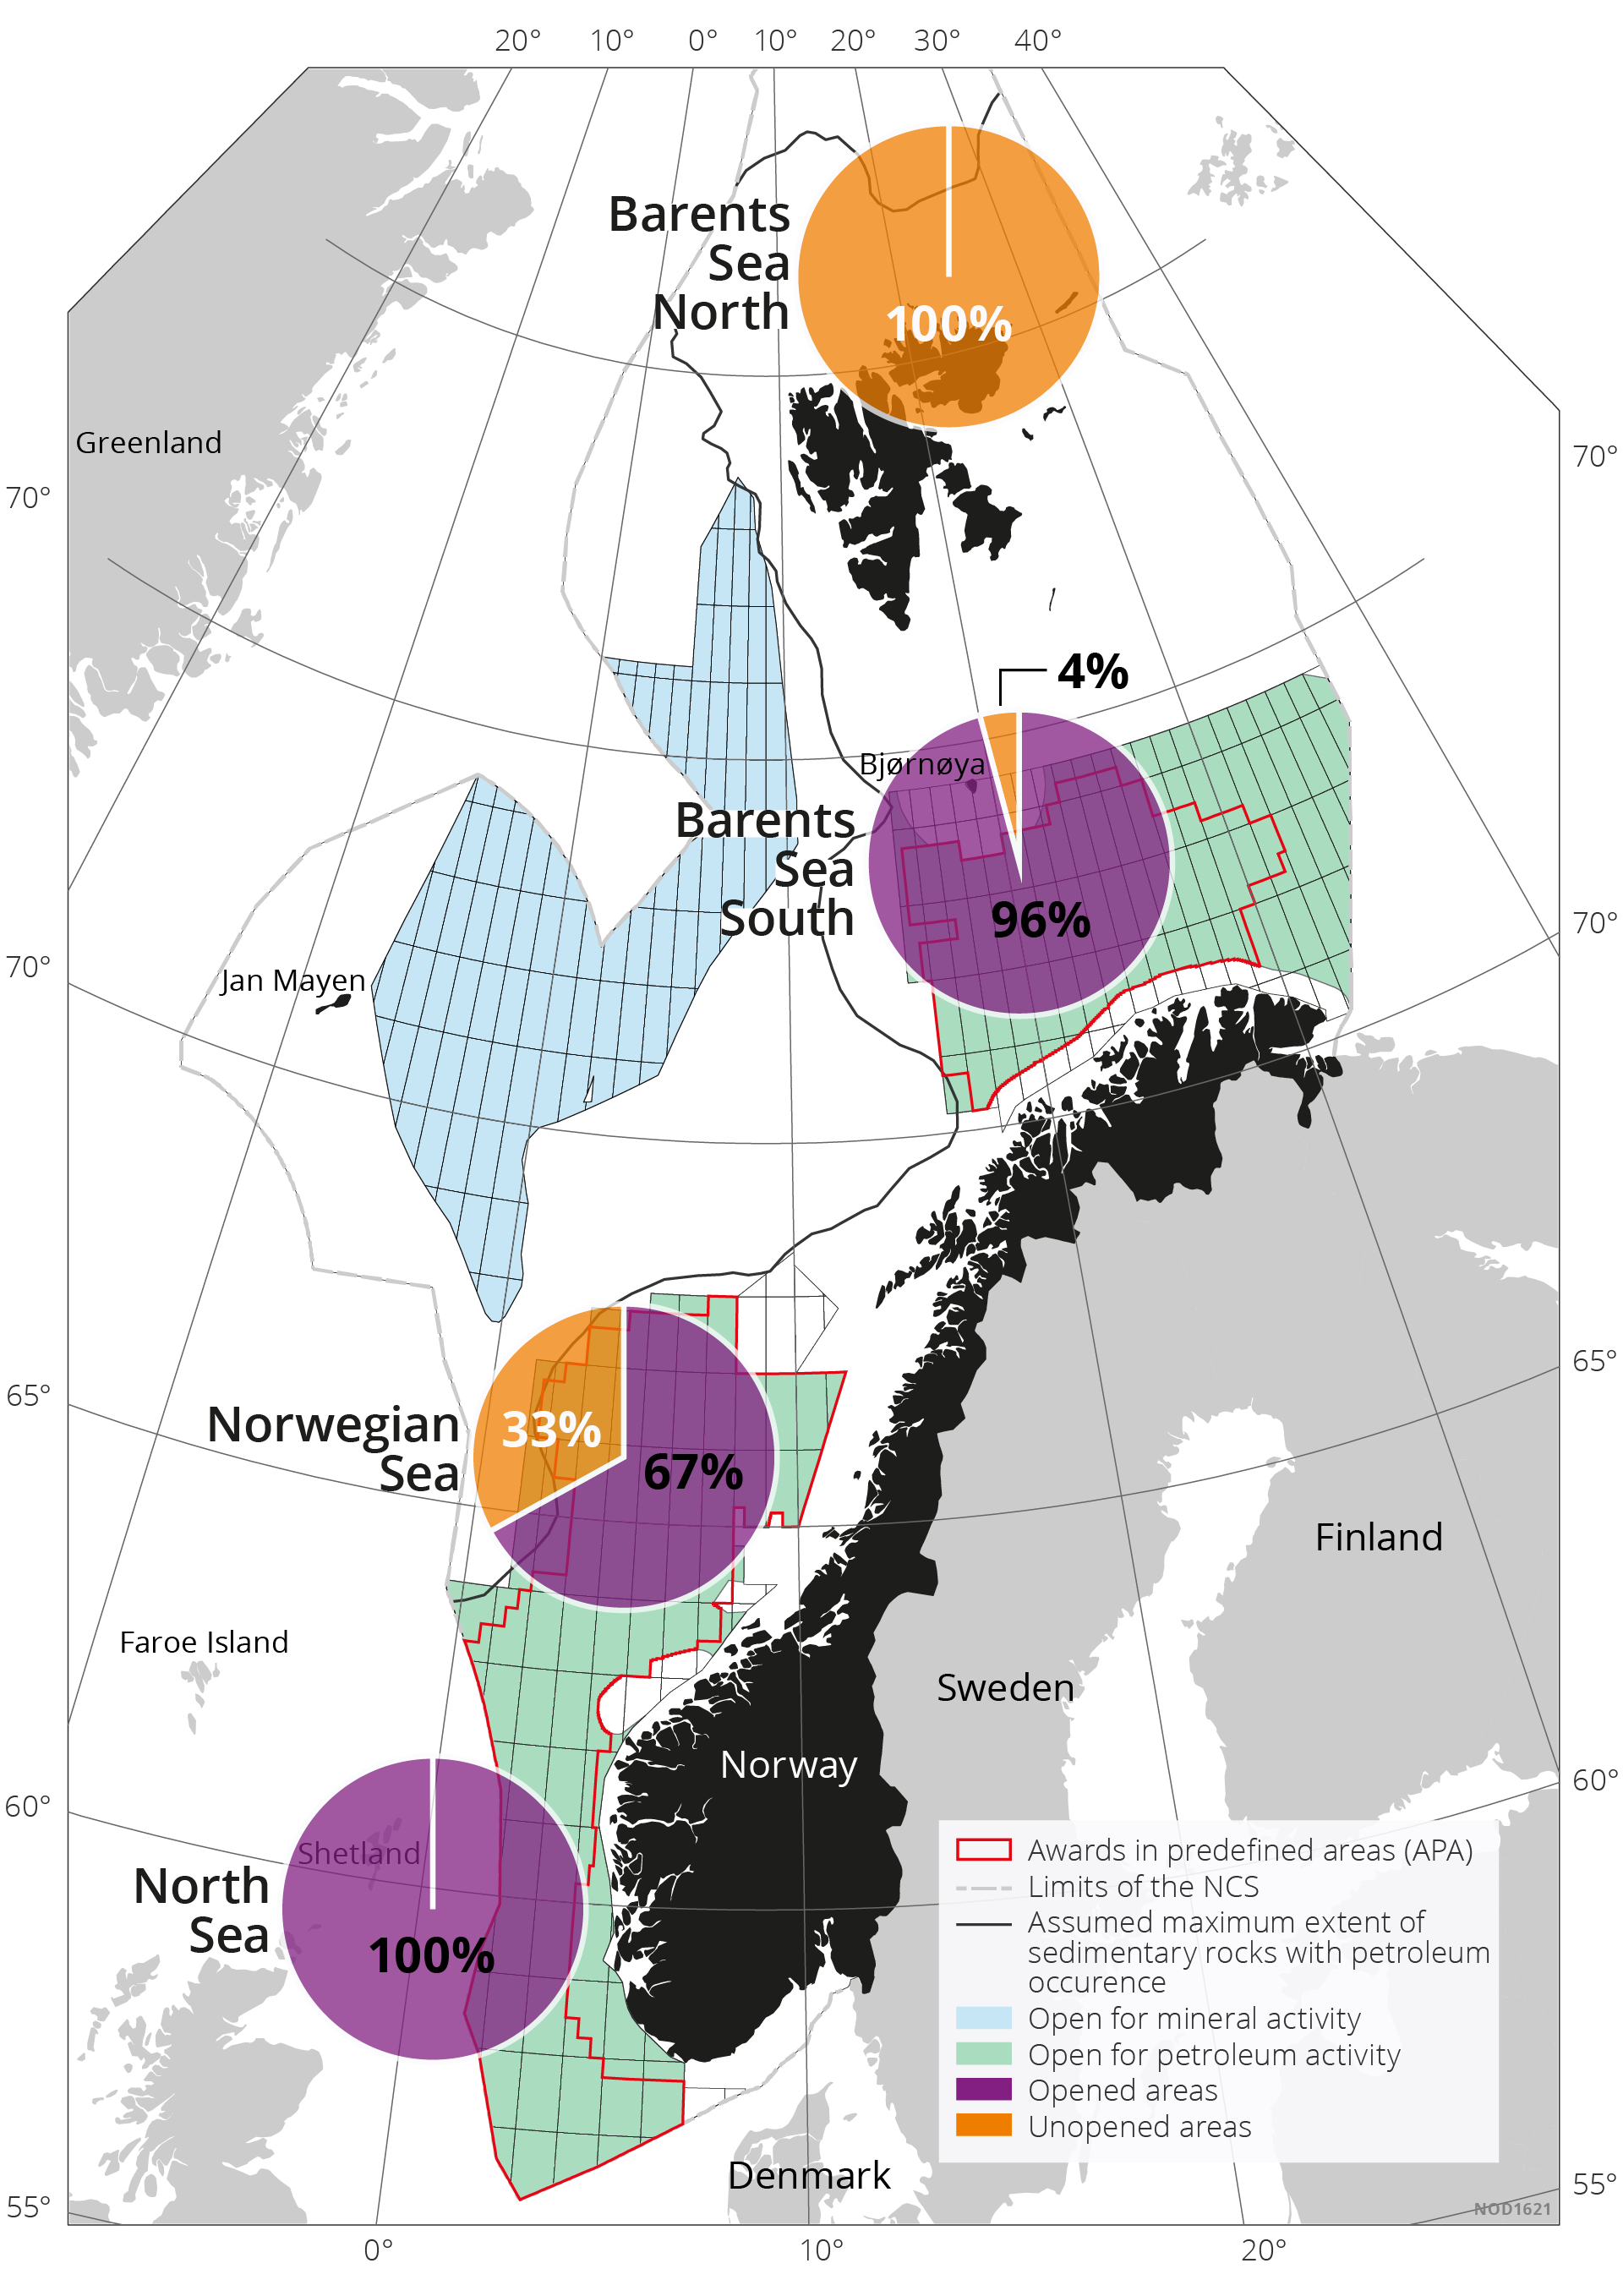
Figure 5.19 Percentage distribution of undiscovered resources across opened and unopened areas.
Tables 5.1 and 5.2 reflect the probability distribution with P95 and P05 estimates. The tables reflect the likely volume of undiscovered resources greater than or equal to 95 per cent and 5 per cent, respectively.
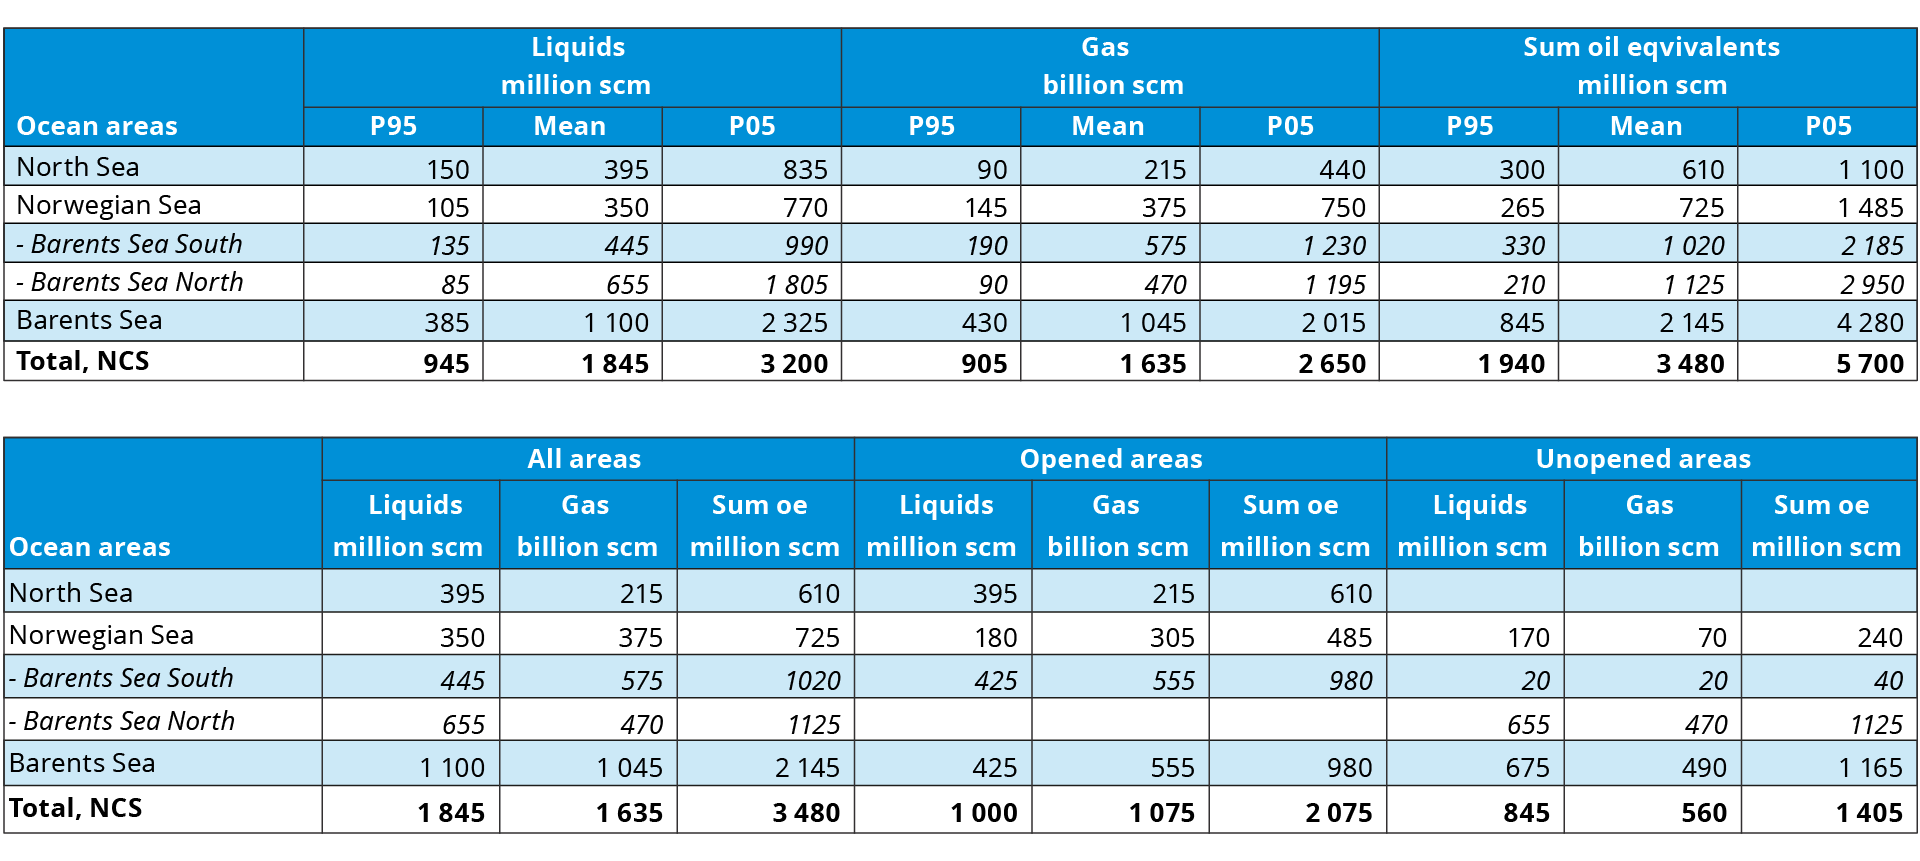
Table 5.1 and 5.2 Resource accounts as of 31 December 2023.
Estimating undiscovered resources
The Norwegian Offshore Directorate uses a statistical method called “play analysis” to calculate undiscovered petroleum resources. The method systematises and describes the geological understanding of an area in defining plays.
The analyses of more than 70 plays form the basis for the estimated undiscovered resources. Some of the most important parameters that are incorporated in the analyses are the number of prospects and leads (potential petroleum accumulations), volume and likelihood of success. The Directorate also receives information about mapped prospects and leads through applications in licencing rounds and from documentation in active and relinquished production licences which supplement the analyses.
Well information, discovery rates and recovery rates, as well as other data collected through the Directorates field work or seismic mapping are further included in the analyses. All plays are initially analysed individually and afterwards dependencies between relevant models are applied. The resulting estimated resources are then summarised by area, in order to achieve an overall estimate for the North Sea, Norwegian Sea and Barents Sea (south and north), respectively.
The estimates for undiscovered resources in areas open for petroleum activities are updated on an annual basis. The update is based assessments surrounding the previous year's exploration results, any potential new studies as well as relevant information from the companies. In areas that have not been opened for petroleum activities, the estimates are only updated if for example new data has been acquired and has provided significant new information.
The extent to which the estimates will change in the light of new well results will depend on both, the extent to which the well results deviate from expected results, and often the amount of data available (knowledgebase) before the well was drilled. Estimates for a mature play with multiple wells and numerous discoveries will typically not change to the extent of, for example, a play without discoveries or previous wells.
Even if the database of an analysis is extensive, estimates will always be accompanied by a certain level of uncertainty. The drilling of wells is the only way to prove or disprove the occurrence and size of hydrocarbon accumulations. There is less uncertainty in areas where several wells have already been drilled, since large quantities of well data and geological information have led to increased knowledge about the area.
The expression ‘yet-to-find’ is frequently used for undiscovered resources. It implies an estimate of what will be discovered, rather than an estimate of what can be discovered. The Norwegian Offshore Directorate's estimate of undiscovered resources covers the oil and gas that can presumably be proven and produced with current knowledge and current technology. This estimate includes no assumptions concerning profitability or exploration activity.
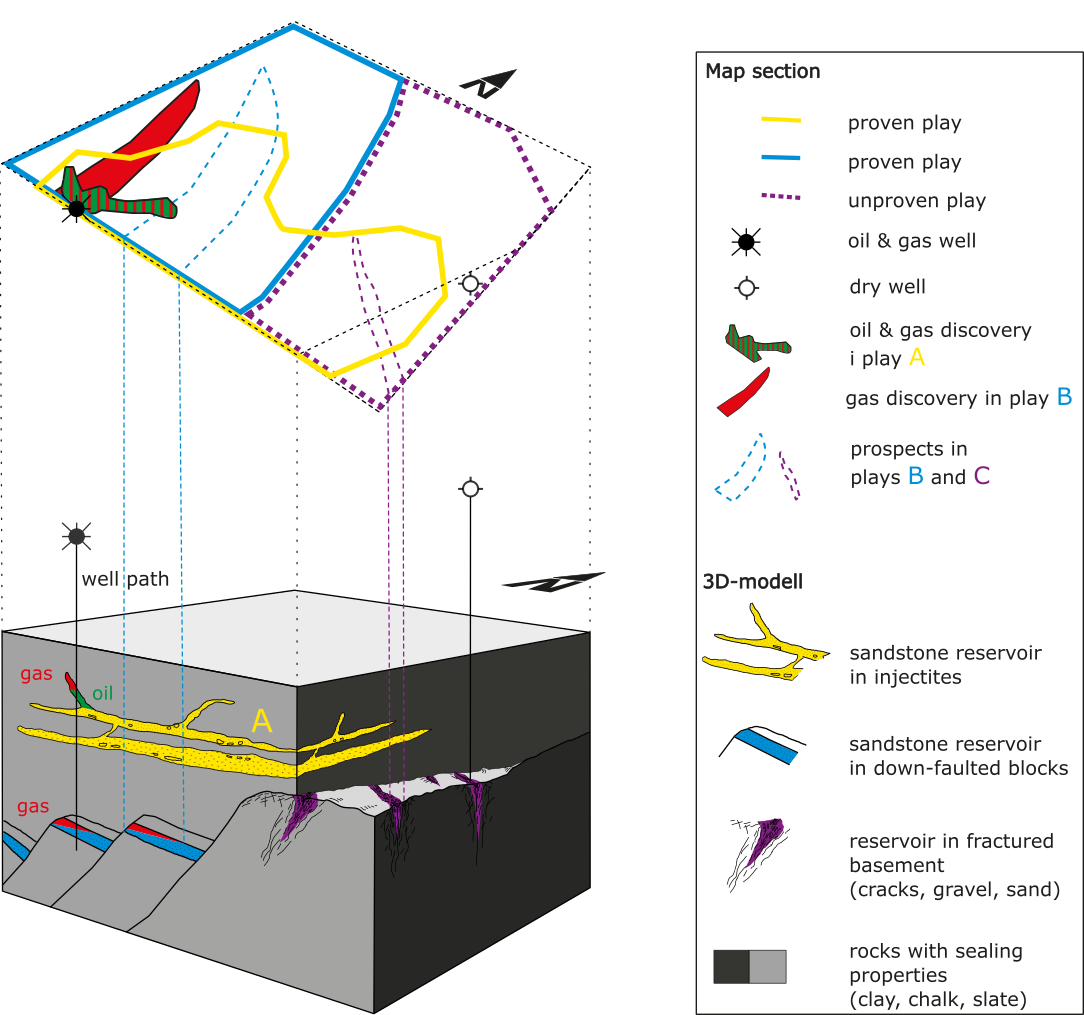
The t-dimensional map shows a projection of different plays, discoveries and wells based on their spatial location (3D block). The methodology, plays and prospects are explained in detail in Chapter 2 of the Resource report 2022 and Chapter 3 of Resource report 2020. In this figure, the discovery well in the west was drilled to test play A and B. The well proved oil and gas in play A and gas in play B, thereby confirming the plays. This means that the petroleum system is working: i.e. migration into reservoirs is working, the plays have traps that prevent oil and gas from migrating to the surface and a reservoir container is present. The eastern well tested play C, in this case reservoirs in fractured basement rock, but he well did not prove hydrocarbons (dry well). Play C was therefore not confirmed.
Undiscovered resources in unopened areas in the Barents Sea
An important part of the Norwegian Offshore Directorate's work has historically been to map unopened areas in an effort to increase understanding and knowledge of the geology in these areas.
Since 2012, we have mainly been gathering data in the Barents Sea North, particularly in the northeastern parts towards the Russian border.
Just over half of the total undiscovered resources in the Barents Sea are located in areas that have be opened for petroleum activities, mostly in the Barents Sea North (see table 5.1 and 5.2.)
This is the area with the greatest likelihood for major discoveries on the Norwegian shelf. The mapping revealed sizeable structures that could contain considerable amounts of oil and gas. Parts of this area could be a prospective petroleum province with several large basins, platforms and highs(33)(34).
The uncertainty is significant, as the mapping is based on limited 2D seismic data and no exploration wells, only shallow boreholes. None of the plays in the area have been confirmed with exploration wells.
Access to acreage
Good access to attractive exploration acreage in licencing rounds is important, in order to maintain exploration activity and facilitate new discoveries. There are two equal licencing rounds on the NCS, numbered rounds and awards in pre-defined areas (APA). Annual APA rounds have taken place since 1999. Numbered rounds in more frontier exploration areas have generally taken place every two years. The last numbered round was announced in 2020.
The number of awards per years is reflected in figure 5.20.
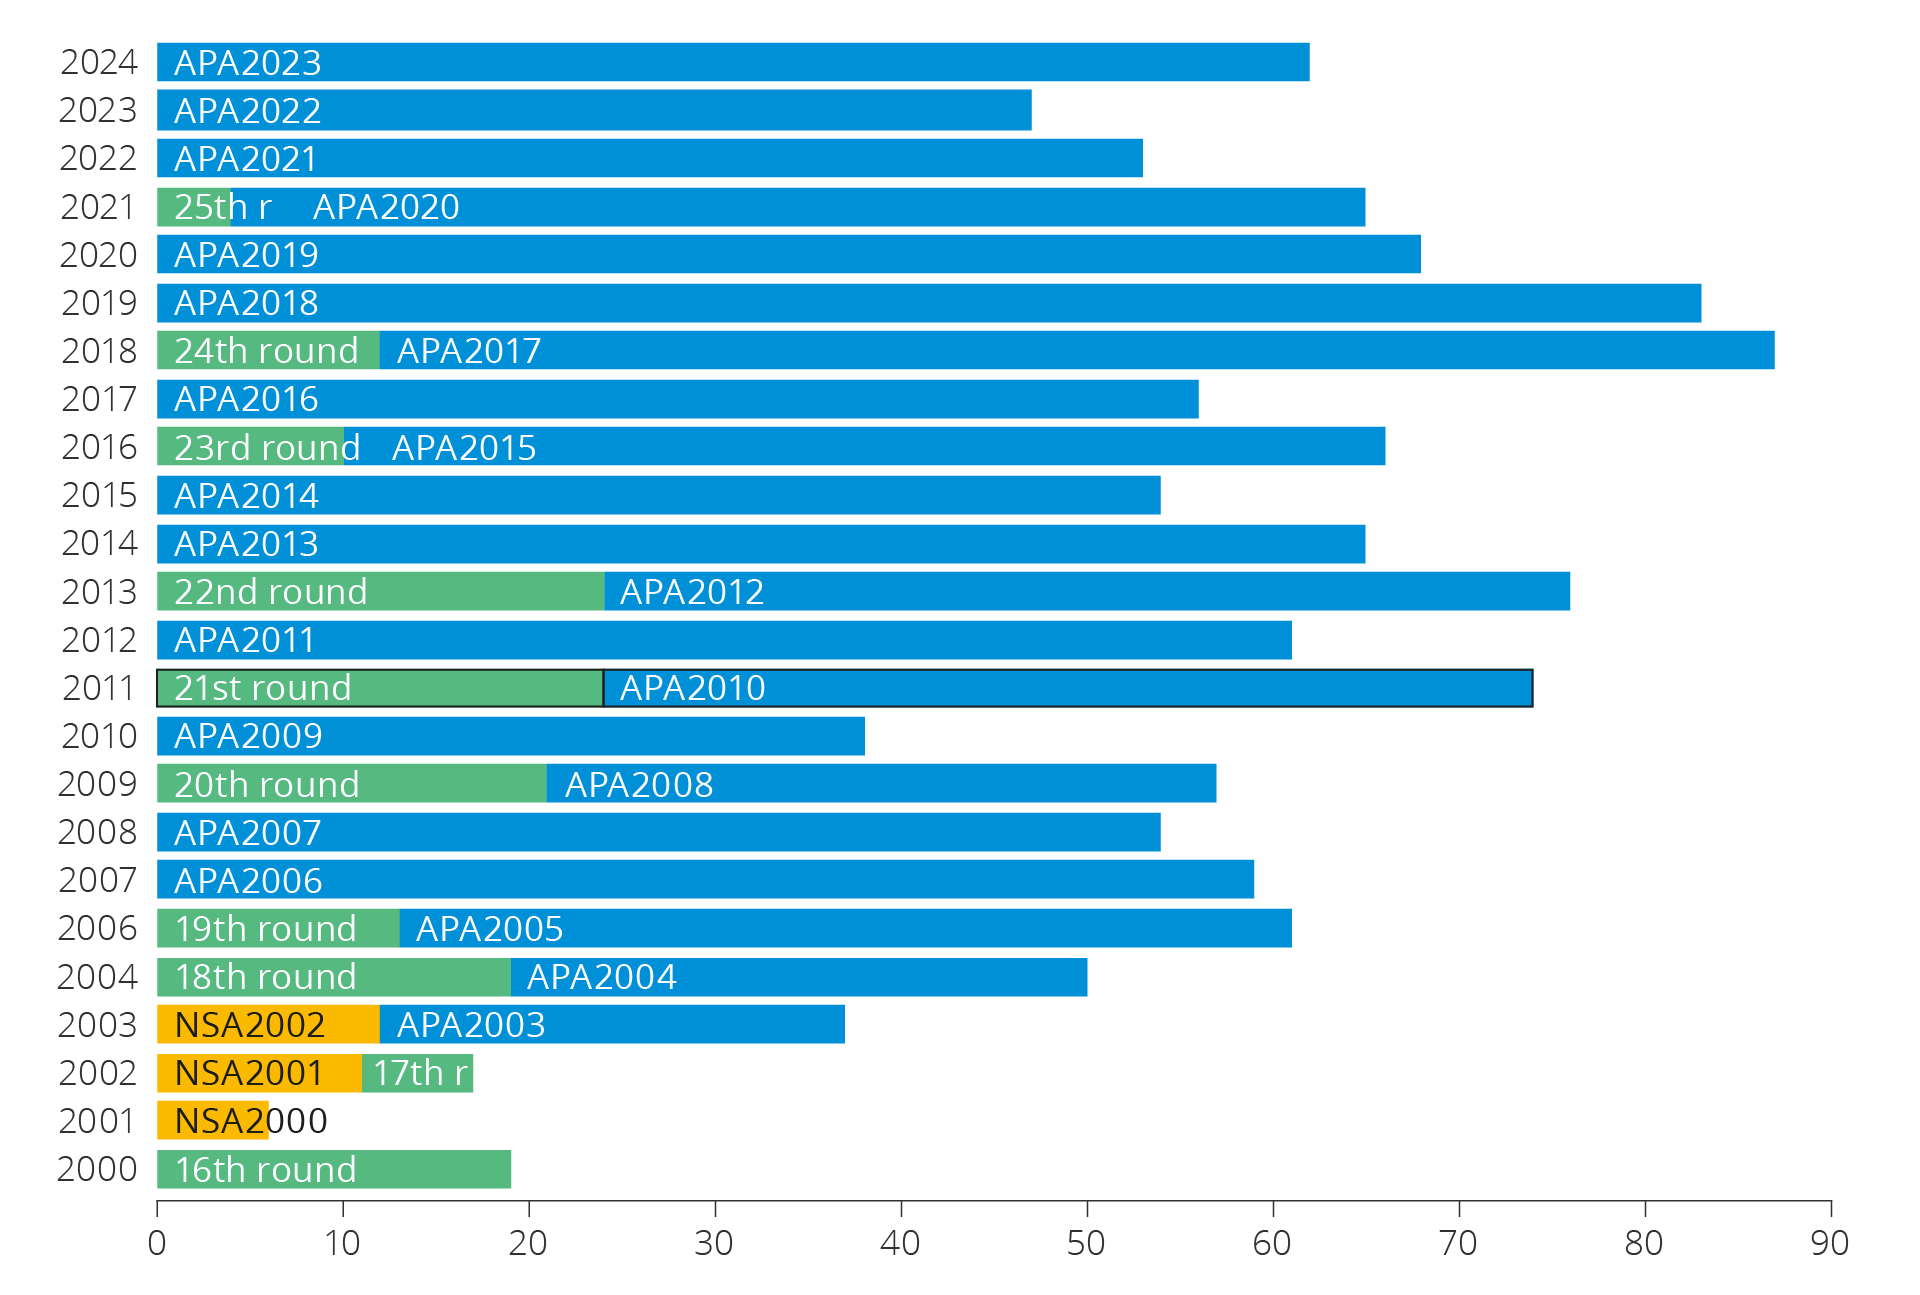
Figure 5.20 Number of production licences awarded since 2000.
The scope of available acreage is reflected in figure 5.21. This illustrates awarded, licensed and relinquished acreage in 1000 km2 increments.
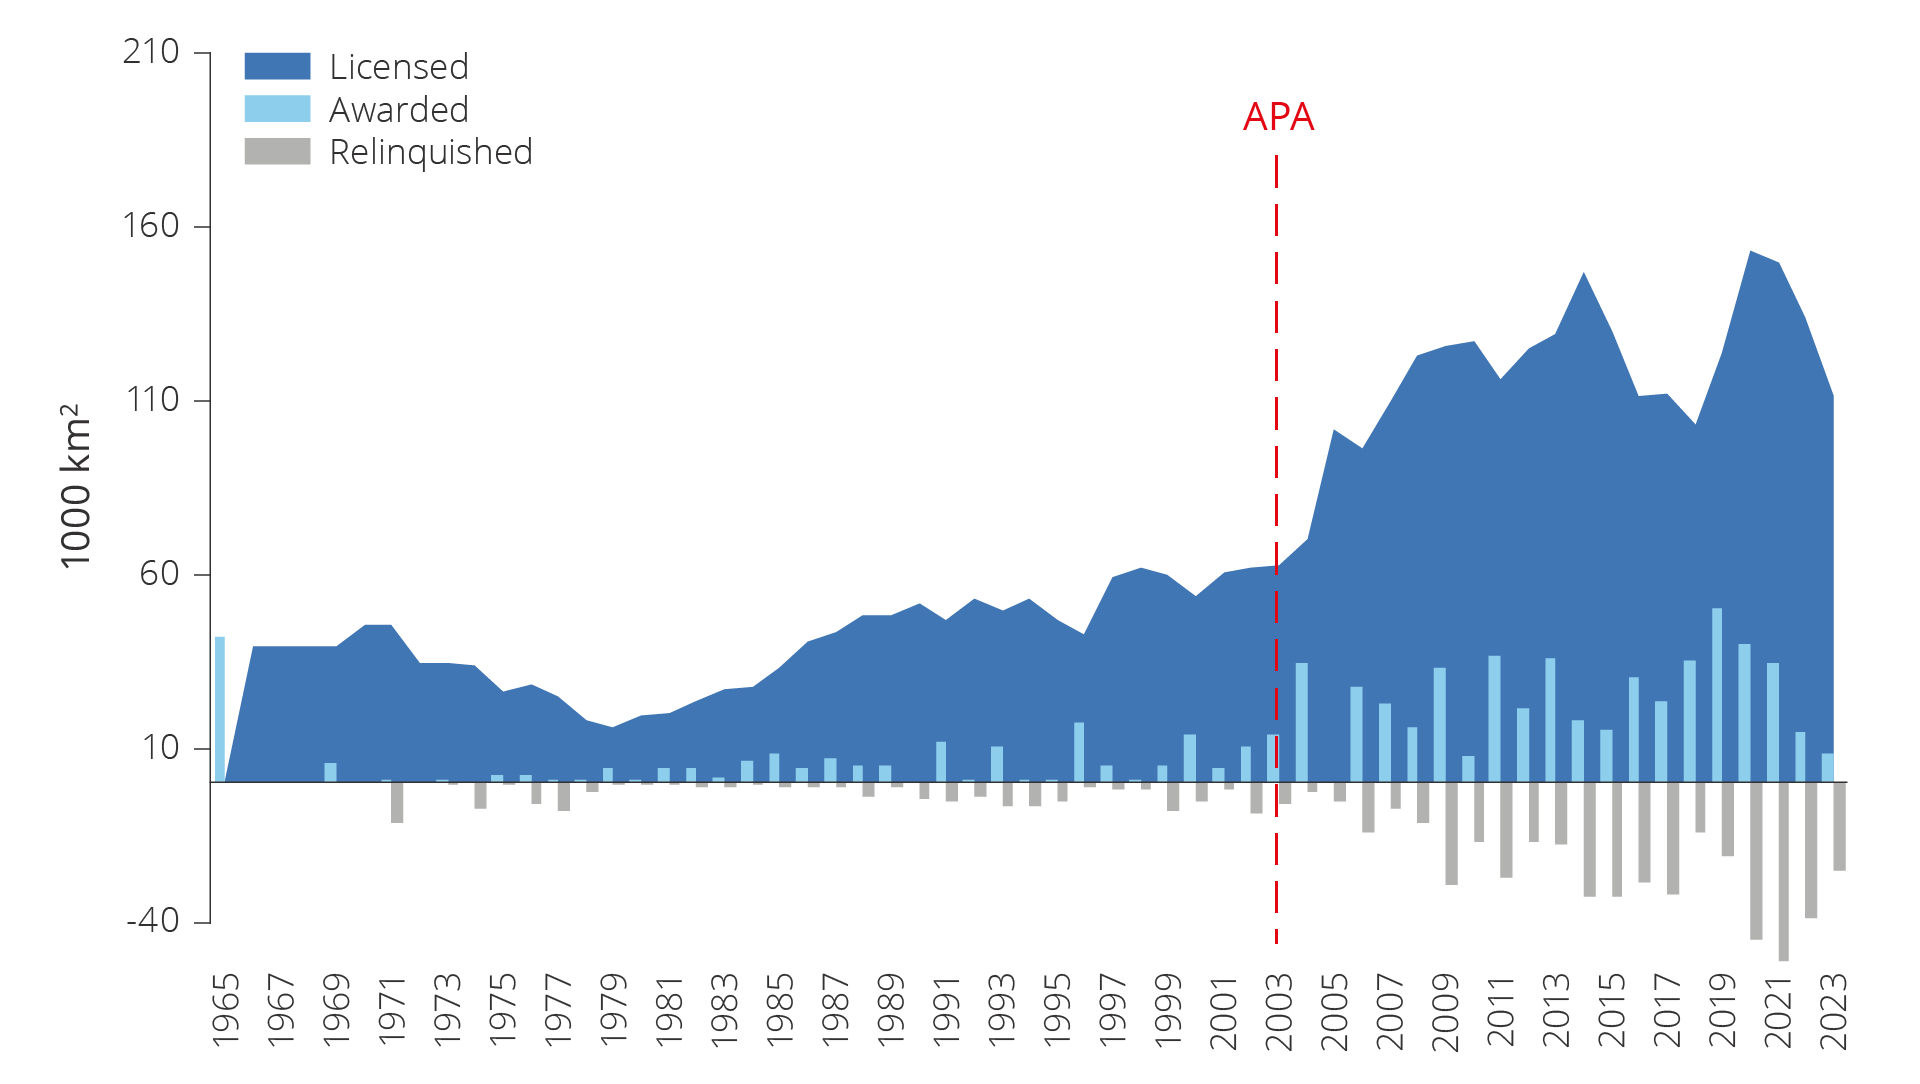
Figure 5.21 Development in available exploration acreage on the NCS.
Exploration trends 2019–2023
150 wildcat wells were completed on the NCS during the 2019-2023 period (see figure 5.22). During the preceding five-year period the number was 156. Between 2014-2023 the annual number of wells completed has been relatively stable at about 30 wells. The number of appraisal wells in 2019–2023 was 43, compared to 73 in 2014–2018. Overall, the number of exploration wells has declined by 16 per cent compared to the preceding five-year period, while the number of wildcat wells has been reduced by 4 per cent.
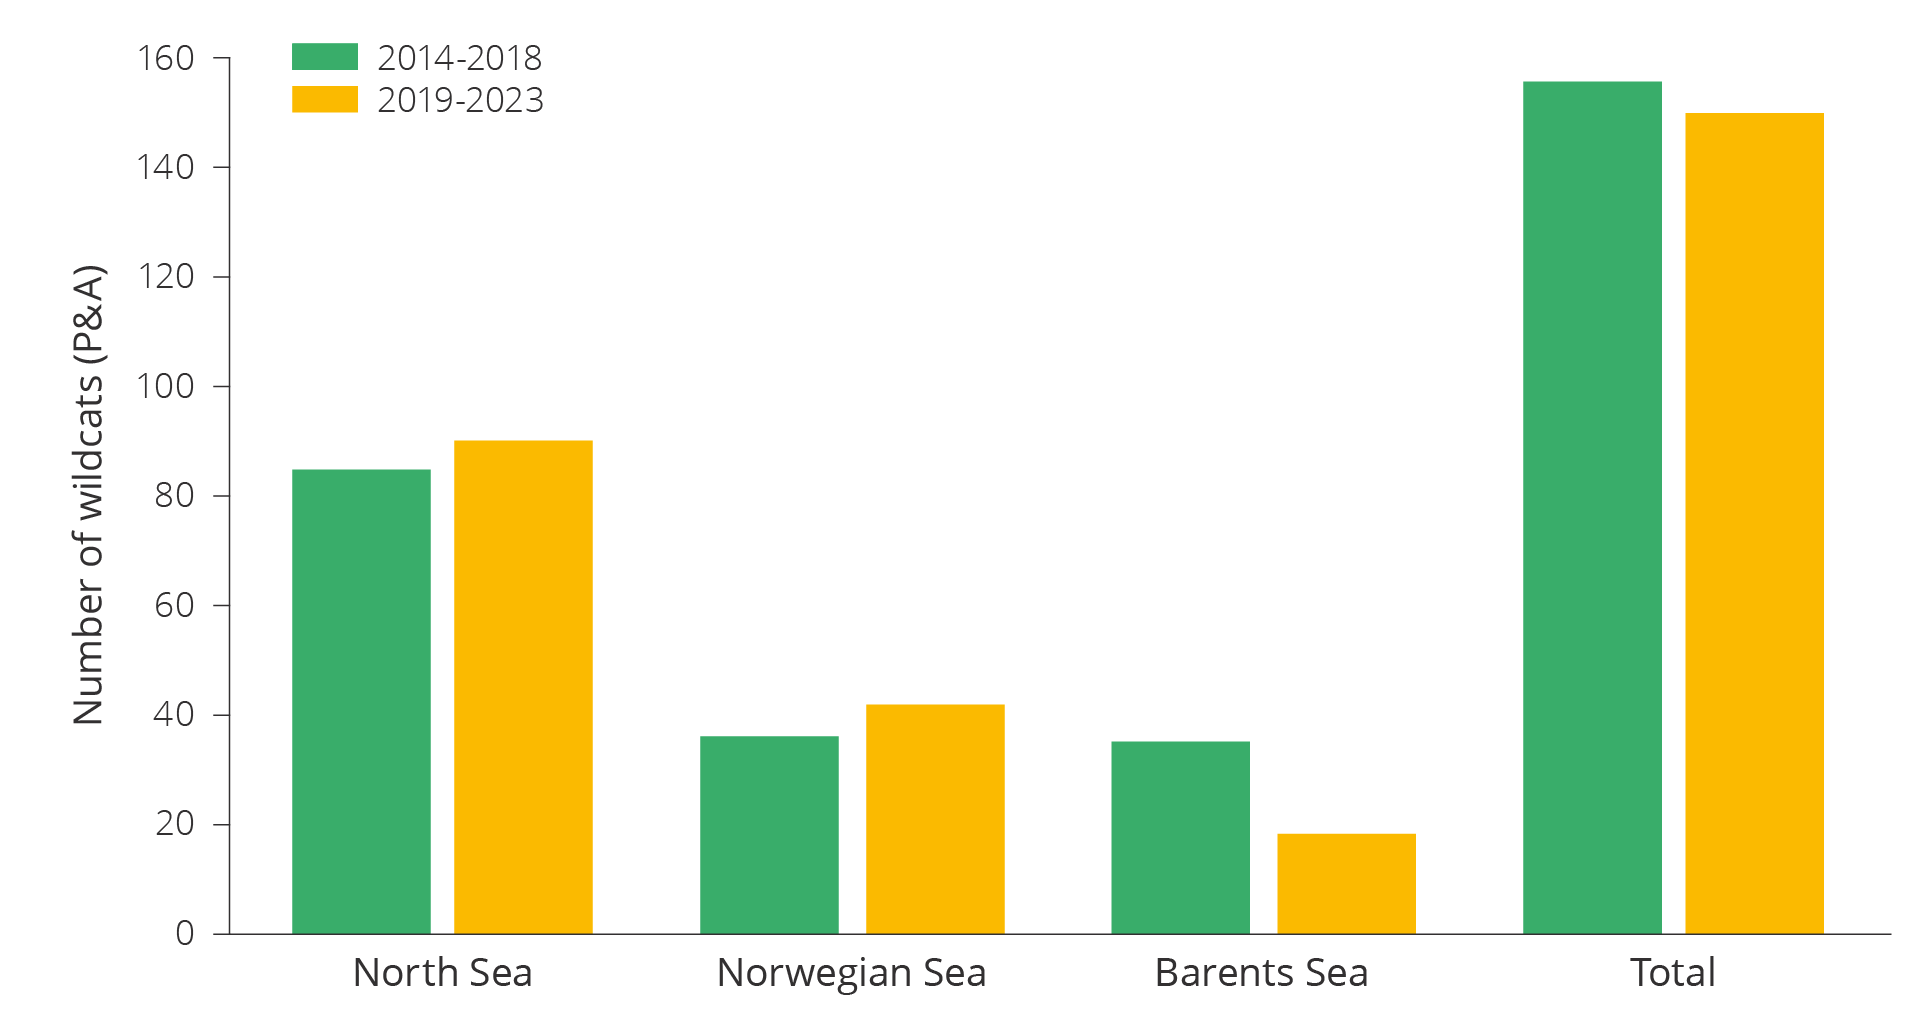
Figure 5.22 Completed wildcat wells on the NCS during the 2014–2023 period.
The number of wildcat wells in the North Sea has increased from 85 to 90 over the last five years, and from 36 to 42 in the Norwegian Sea, while the number in the Barents Sea has declined from 35 to 18.
76 discoveries were made between 2019–2023 as shown in figure 5.23. This is 2 less than the preceding five-year period. However, overall resources proven in discoveries between 2019–2023 amount to 40 million scm more than in the previous five-year period, totalling 290 million scm. It is particularly the North Sea where exploration has led to increased resource (see figure 5.24).
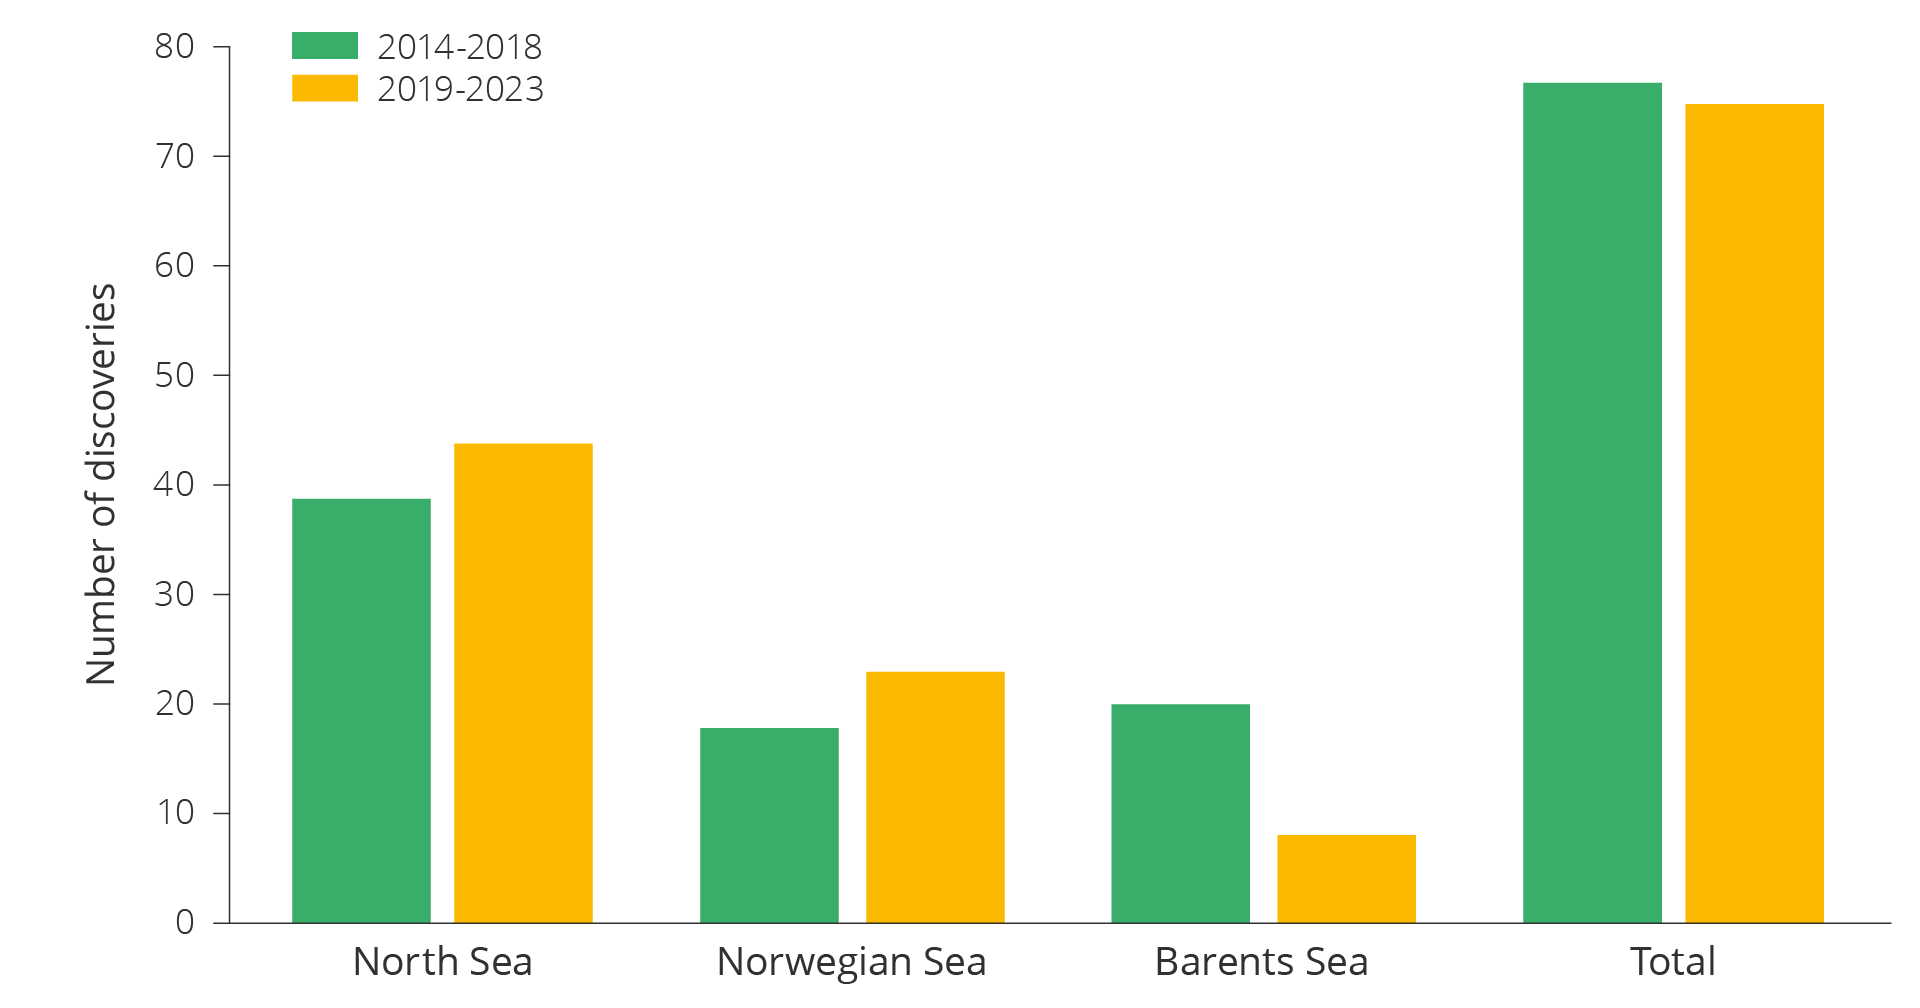
Figure 5.23 Number of discoveries on the NCS in 2014–2023.
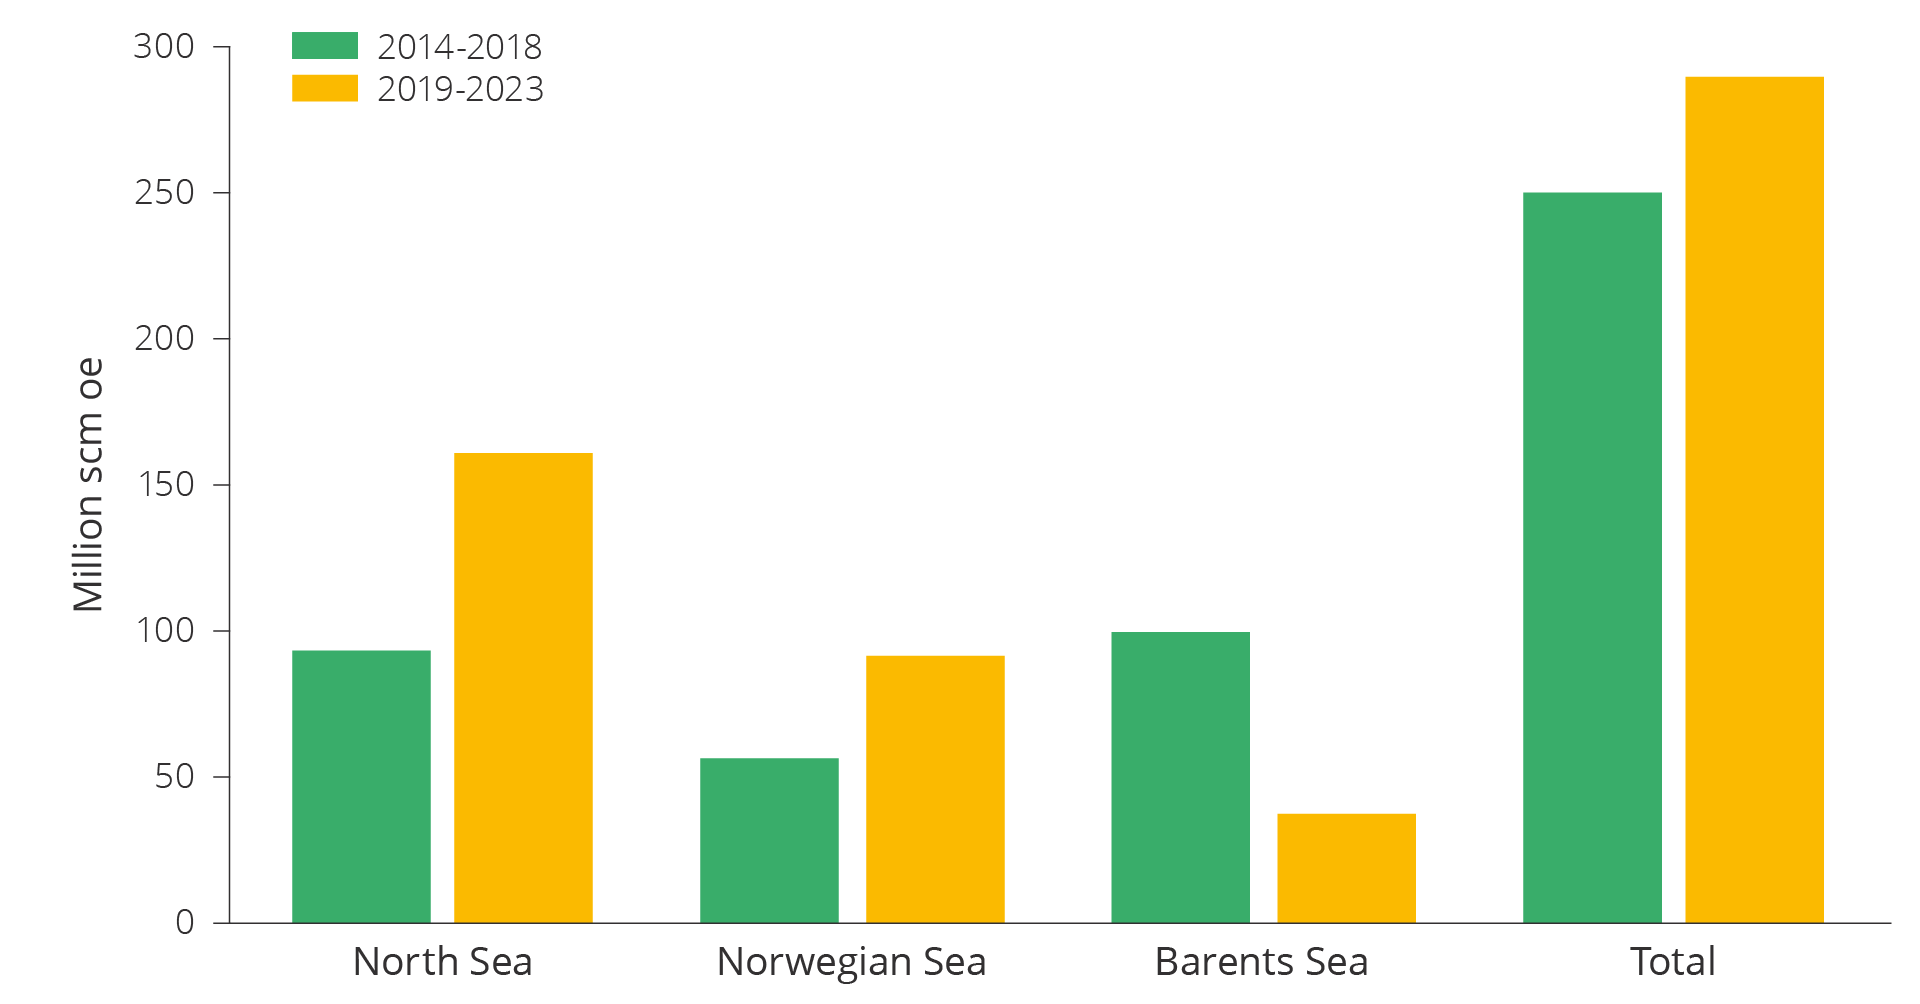
Figure 5.24 Resources in discoveries on the NCS in 2014–2023 (including resources in resource class 6).
Wildcat wells between 2019 and 2023 were largely drilled in known areas. The map on the left of figure 3.25 illustrates the density of wells drilled between 1966 and 2023.
There is a high concentration of wells in the Central Graben in the southern part of the North Sea, to the north in the Viking Graben, on the Tampen Spur and the Horda Platform in the middle and northern part of the North Sea. In the Norwegian Sea most wells were drilled on the Halten and Dønna Terraces. The Barents Sea sees the highest density in and around the Hammerfest Basin, also further north over the Loppa High and in the Johan Castberg area.
The map on the right in figure 5.25 shows that activity in the period between 2019–2023 is concentrated in the same areas as in the map on the left, with the exception of the southern part of the North Sea. There are few wells outside these areas. In the Norwegian Sea, the wells are concentrated on the Halten and Dønna terraces, with only few exceptions. During the first part of this five-year period multiple wells were drilled in less explored areas in the Barents Sea, while most wells were drilled in the Johan Castberg area toward the end of the period.
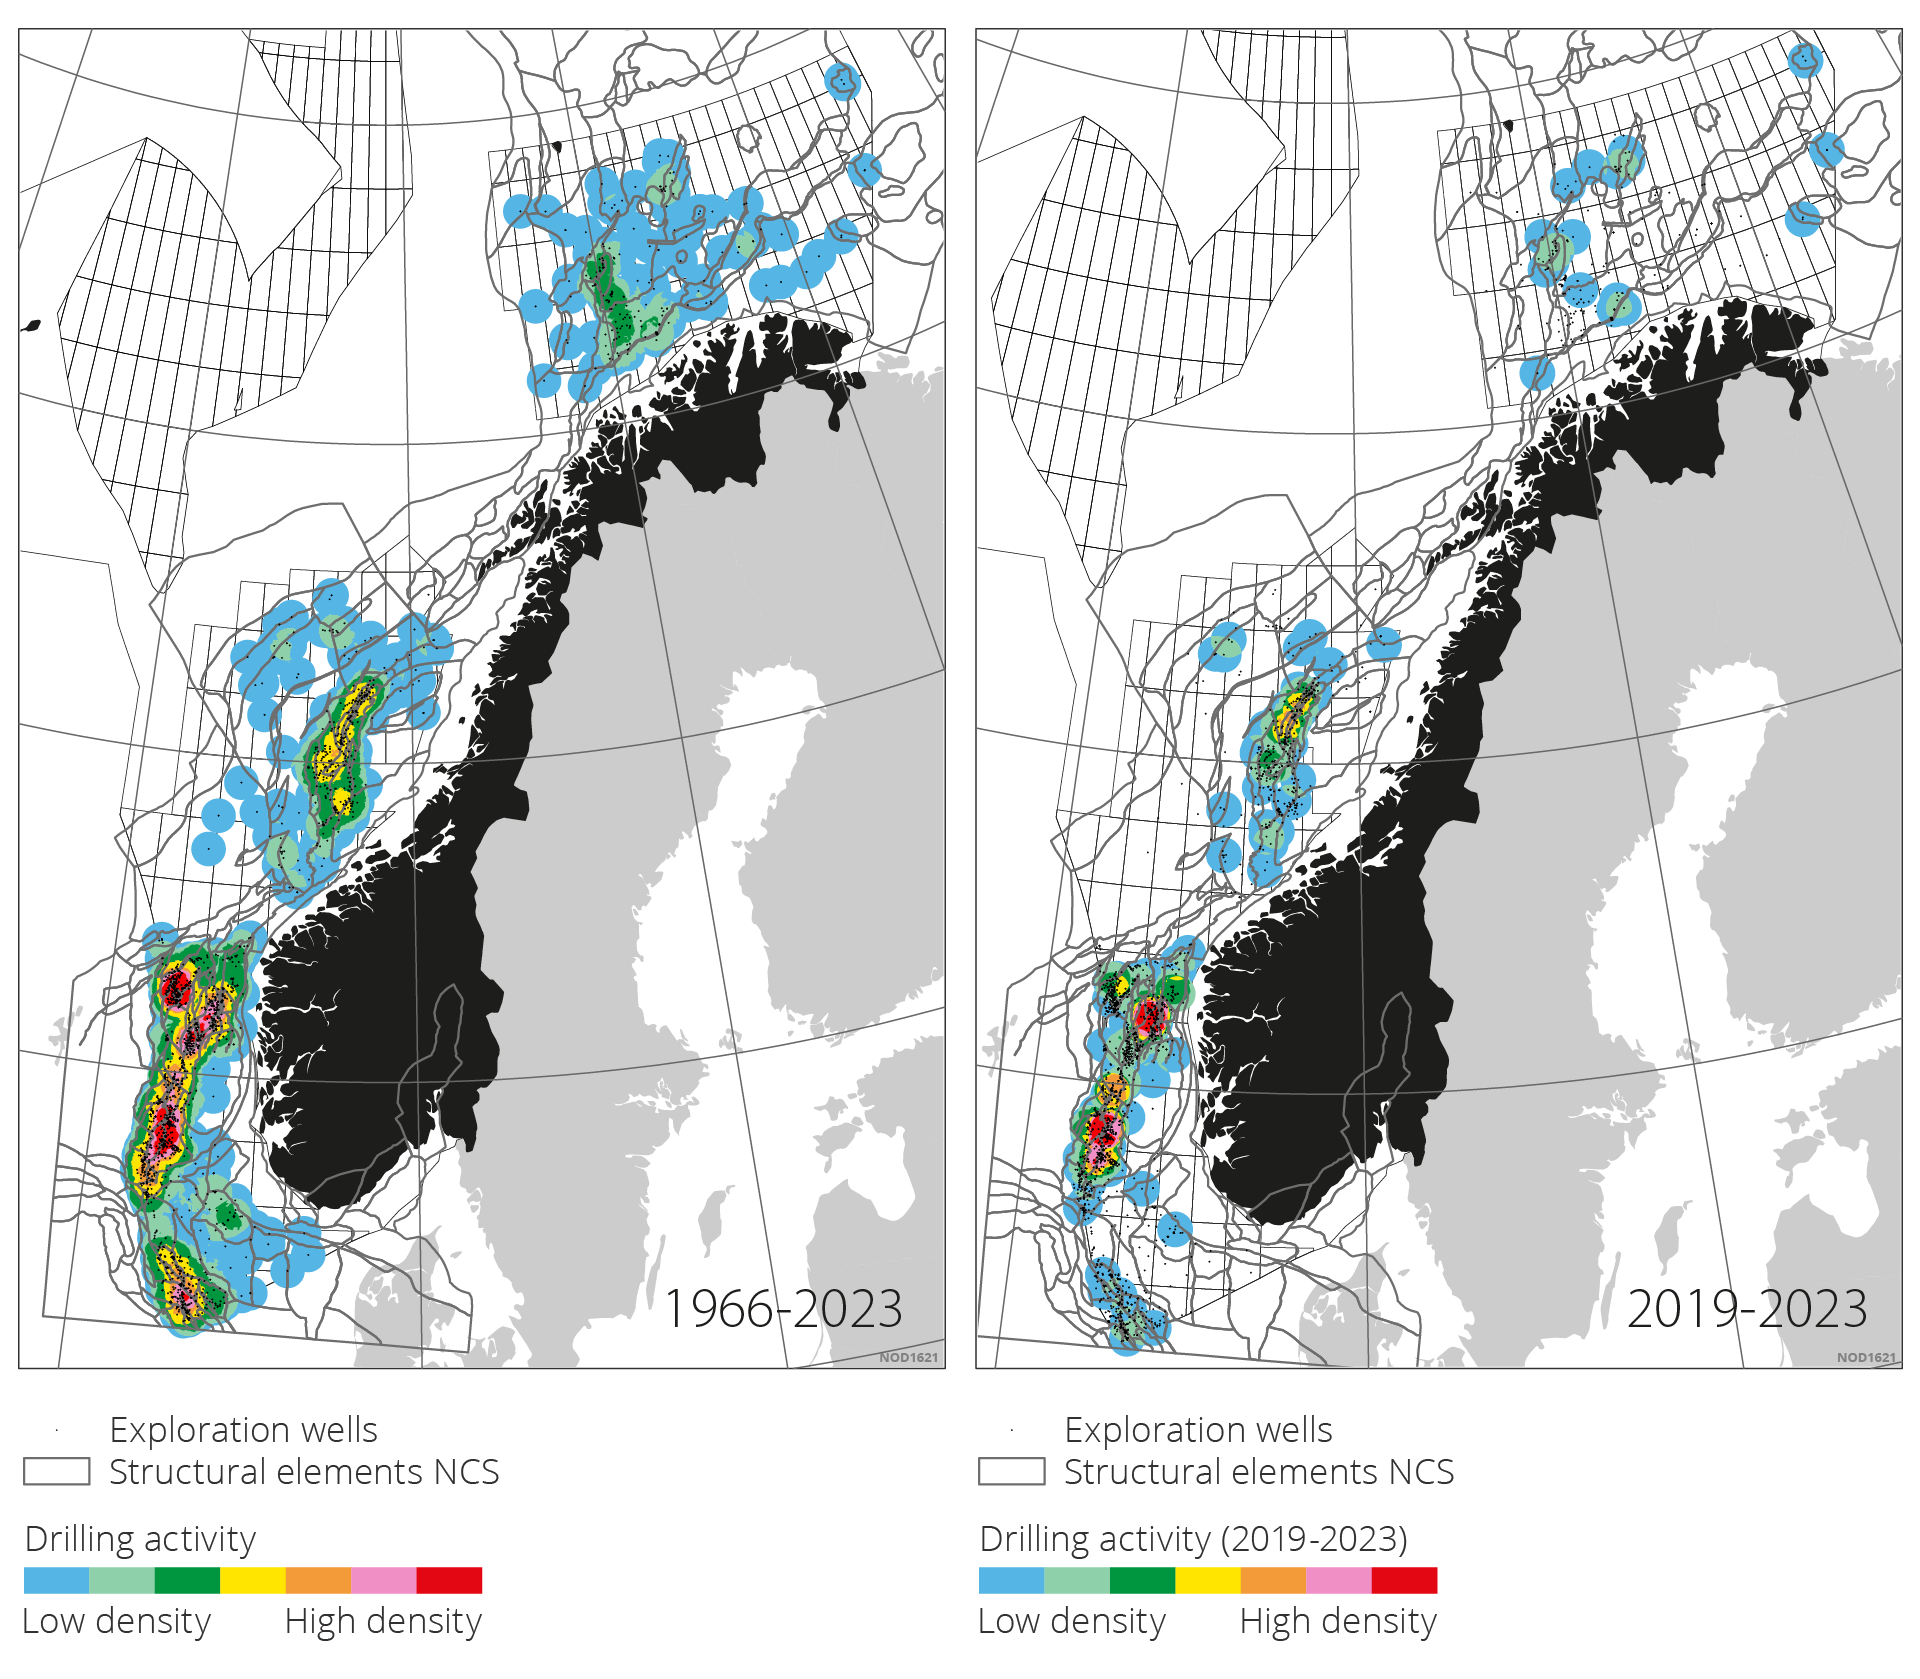
Figure 5.25 The maps illustrate well density. Areas with few wells are shown in blue. Areas with a high number of wells by area (high well density) are illustrated in red. There is a 30-kilometre buffer zone around the wells.
North Sea
Exploration activity in the southern-most part of the North Sea has been relatively low with 11 wildcat wells between 2019 and 2023. Results from these 11 wells turned out to be 3 minor discoveries, 2 of which are classified as resource class 6 (recovery unlikely). Exploration activity was also low in 2014–2018 with 10 wildcat wells, but results were better due to the 2/4-23 S (Julius) discovery in 2015, which is now part of the Fenris field. This field is under development.
The central part of the North Sea has seen high activity between 2019 and 2023 with 34 wildcat wells, compared with 25 in the previous five-year period. 8 of the wells were drilled on the Utsira High. The other wells were drilled in the Viking Graben and terraces leading up to the Utsira High. Discoveries have been made in 19 of the 34 wells, the largest of which were 25/8-20 B in 2021 (now included in the Balder field) and 25/7-11 S (Norma) in 2023.
The northern part of the North Sea has seen the most activity with45 exploration wells drilled in between 2019–2023 This is a reduction from 50 compared to the previous period. 22 of the wells were classified as discoveries. The three largest discoveries were 35/10-10 S (Carmen) in 2023, 30/2-5 S (Atlantis) in 2020 and 31/2-22 S (Blasto) in 2021. Exploration activity has been particularly high in the area west of the Fram field and towards the west flank of Troll (Lomre Terrace) with 15 of the 45 wells drilled in this area.
Norwegian Sea
42 wildcat wells were drilled in the Norwegian Sea between 2019–2023. This is 6 more wells drilled than between 2014–2018. 25 of these wells were drilled on the Halten and Dønna terraces. Discoveries were made in 19 of these wells, resulting in a technical discovery rate of 76 per cent.
In addition were 8 wells drilled on the Frøya High, Trøndelag Platform, Sørhøgda and Grønnøy High. One small discovery was made on the Grønnøy High, 6611/1-1 (Toutatis). All other wells were dry. A further 8 wells were drilled in the basins and synclines west and northwest of the Halten and Dønna terraces. Three minor gas discoveries were made here.
Barents Sea
Exploration activity was nearly cut in half between 2019–2023 compared to the previous five-year period. 18 wildcat wells were drilled in total, with only 1 in 2023. 8 discoveries were made.
The last wells, which the companies had committed to drill in the south-eastern part by the Barents Sea in the 23rd licensing round, were drilled in this period. This resulted in 2 dry wells on the Signalhorn Dome in 2019, 1 dry well on the Haapet Dome in 2020 and 1 minor gas discovery on the Fedynsky High in 2021. This discovery was made in a previously unproven play with reservoirs in carbonates in the Ørn Formation from the Late Carbon to Early Permian.
During the last part of this period 5 exploration wells were drilled around the Johan Castberg, Snøhvit and Goliat fields. Discoveries were made in all wells. The largest discovery was 7122/9-1 (Lupa), which was made in late 2022. Three discoveries were made in the Johan Castberg area that could provide considerable additional resources for the field, the largest of which were 7220/7-4 (Isflak) and 7220/8-2 S (Snøfonn Nord).
Significance of exploring for future production
Total resource growth and the number of discoveries from exploration activity since 2000 is shown in figure 5.26.
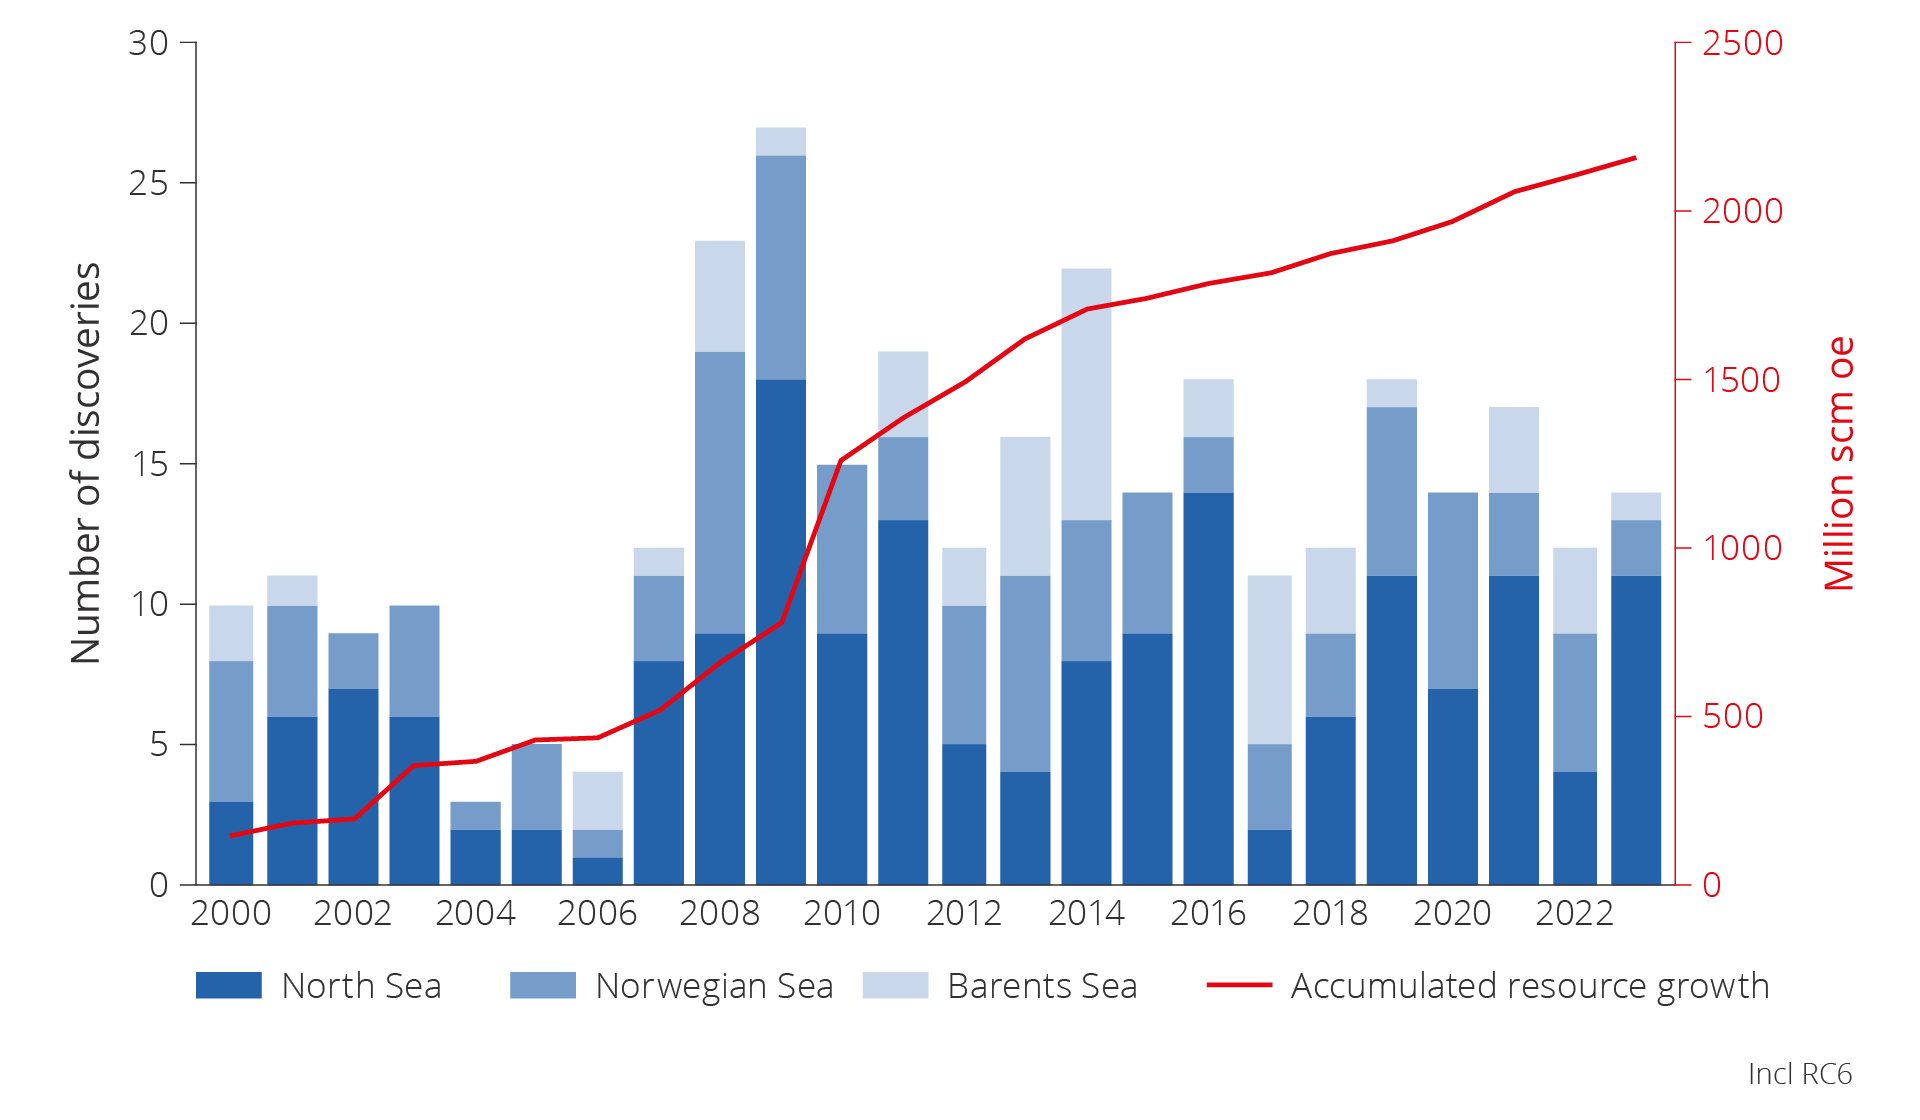
Figure 5.26 Number of discoveries per NCS area and total resource growth, 2000–2023.
Even though exploration activity remains relatively stable and discoveries are being made, resource growth falls short of counteracting the effect of declining production from existing fields after 2027. Figure 5.27 illustrates the effect that exploration activity over the last 20 years has on total production (in dark purple). The new discoveries have helped slowing the decline in production from 2017 and are expected to keep production relatively stable, before it declines rapidly after 2027–2028.

Figure 5.27 Effect of exploration activity over the last 20 years on historical and future total production.
The discoveries made are consistently small. Multiple wildcat wells need to be drilled annually to slow the decline in production compared to the average drilled since 2016. More and larger discoveries will have to be made. The opportunity to make major discoveries is greatest in less explored parts of already opened areas, as well as areas that have not yet been opened for petroleum activities.
Smaller discoveries
International experience shows that major discoveries are made early in the exploration phase in a new petroleum province, and that the discovery size declines proportional as petroleum provinces mature. This also applies on the NCS as shown in figure 5.28.
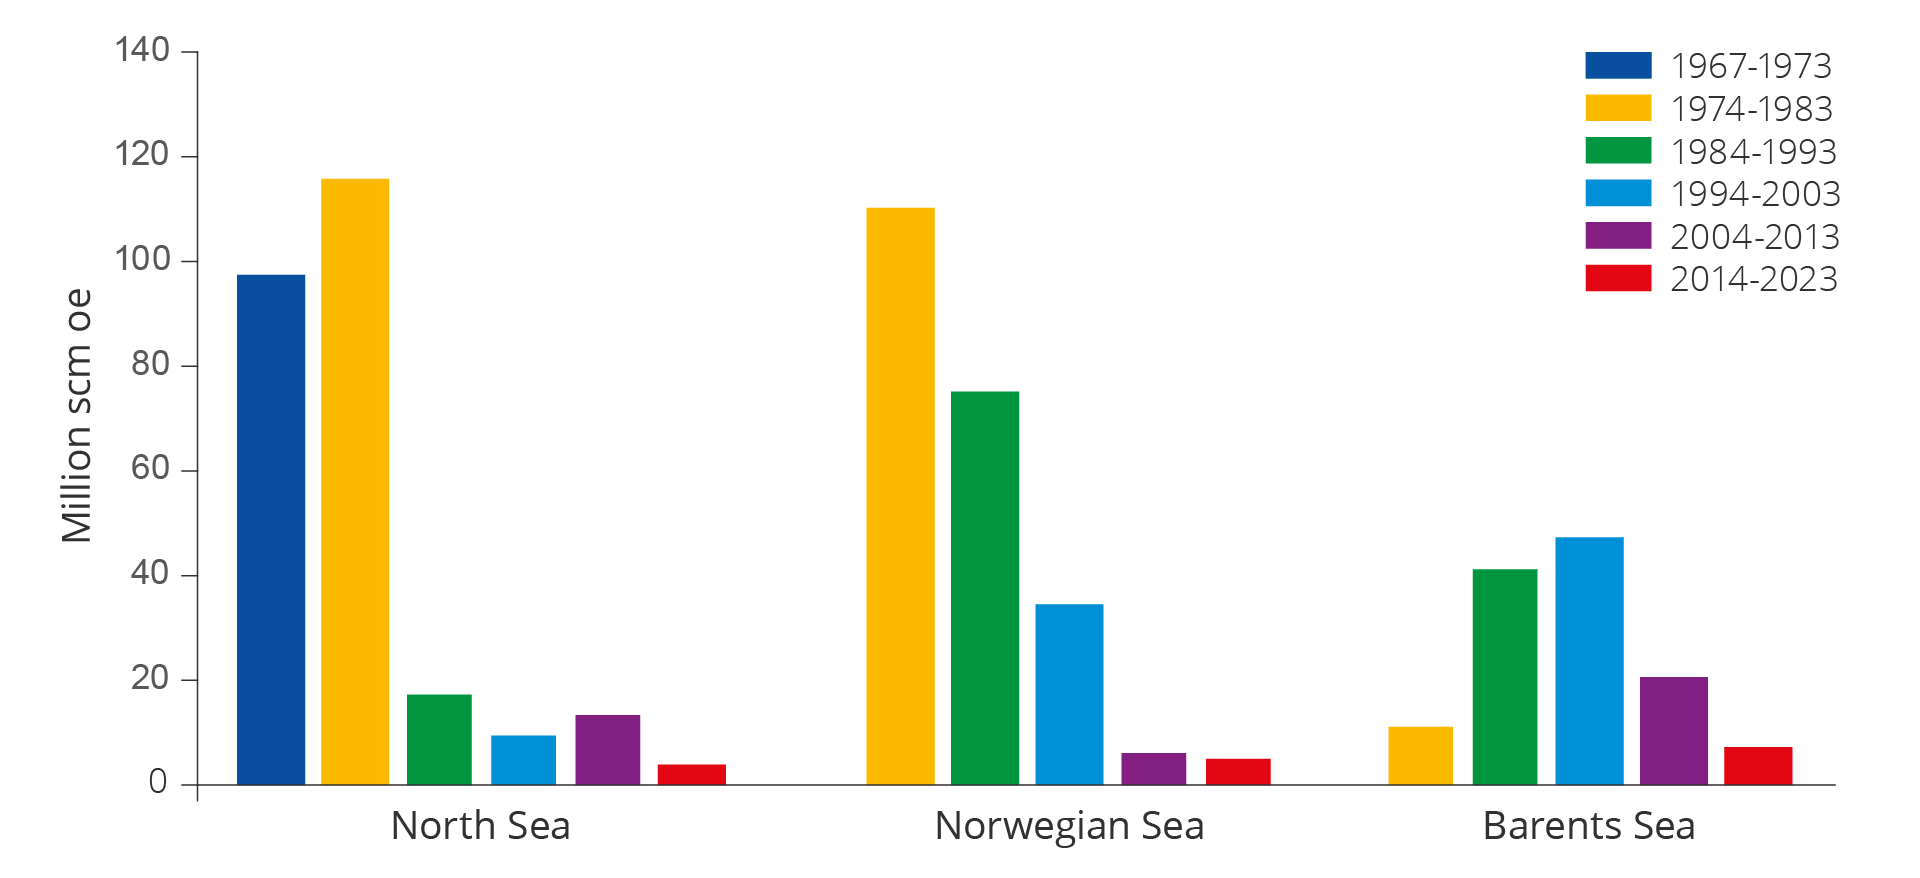
Figure 5.28 Average discovery size distributed across areas and periods (without resource class 6).
The largest discoveries, with the exception of Ormen Lange in 1997 and Johan Sverdrup in 2010, were made in the 1970s and 1980s. The average size of discoveries over the last ten years has totalled about 5.2 million scm oe on the NCS, with 3.5 in the North Sea, 4.8 in the Norwegian Sea and 7.2 in the Barents Sea.
The decline in average discovery size reflects a natural evolution for a mature petroleum province where no new areas are opened. With a decline in discovery size, production from the major fields needs to be replaced by multiple small discoveries. This development, with the number of producing fields and production per field, is shown in figure 5.29.
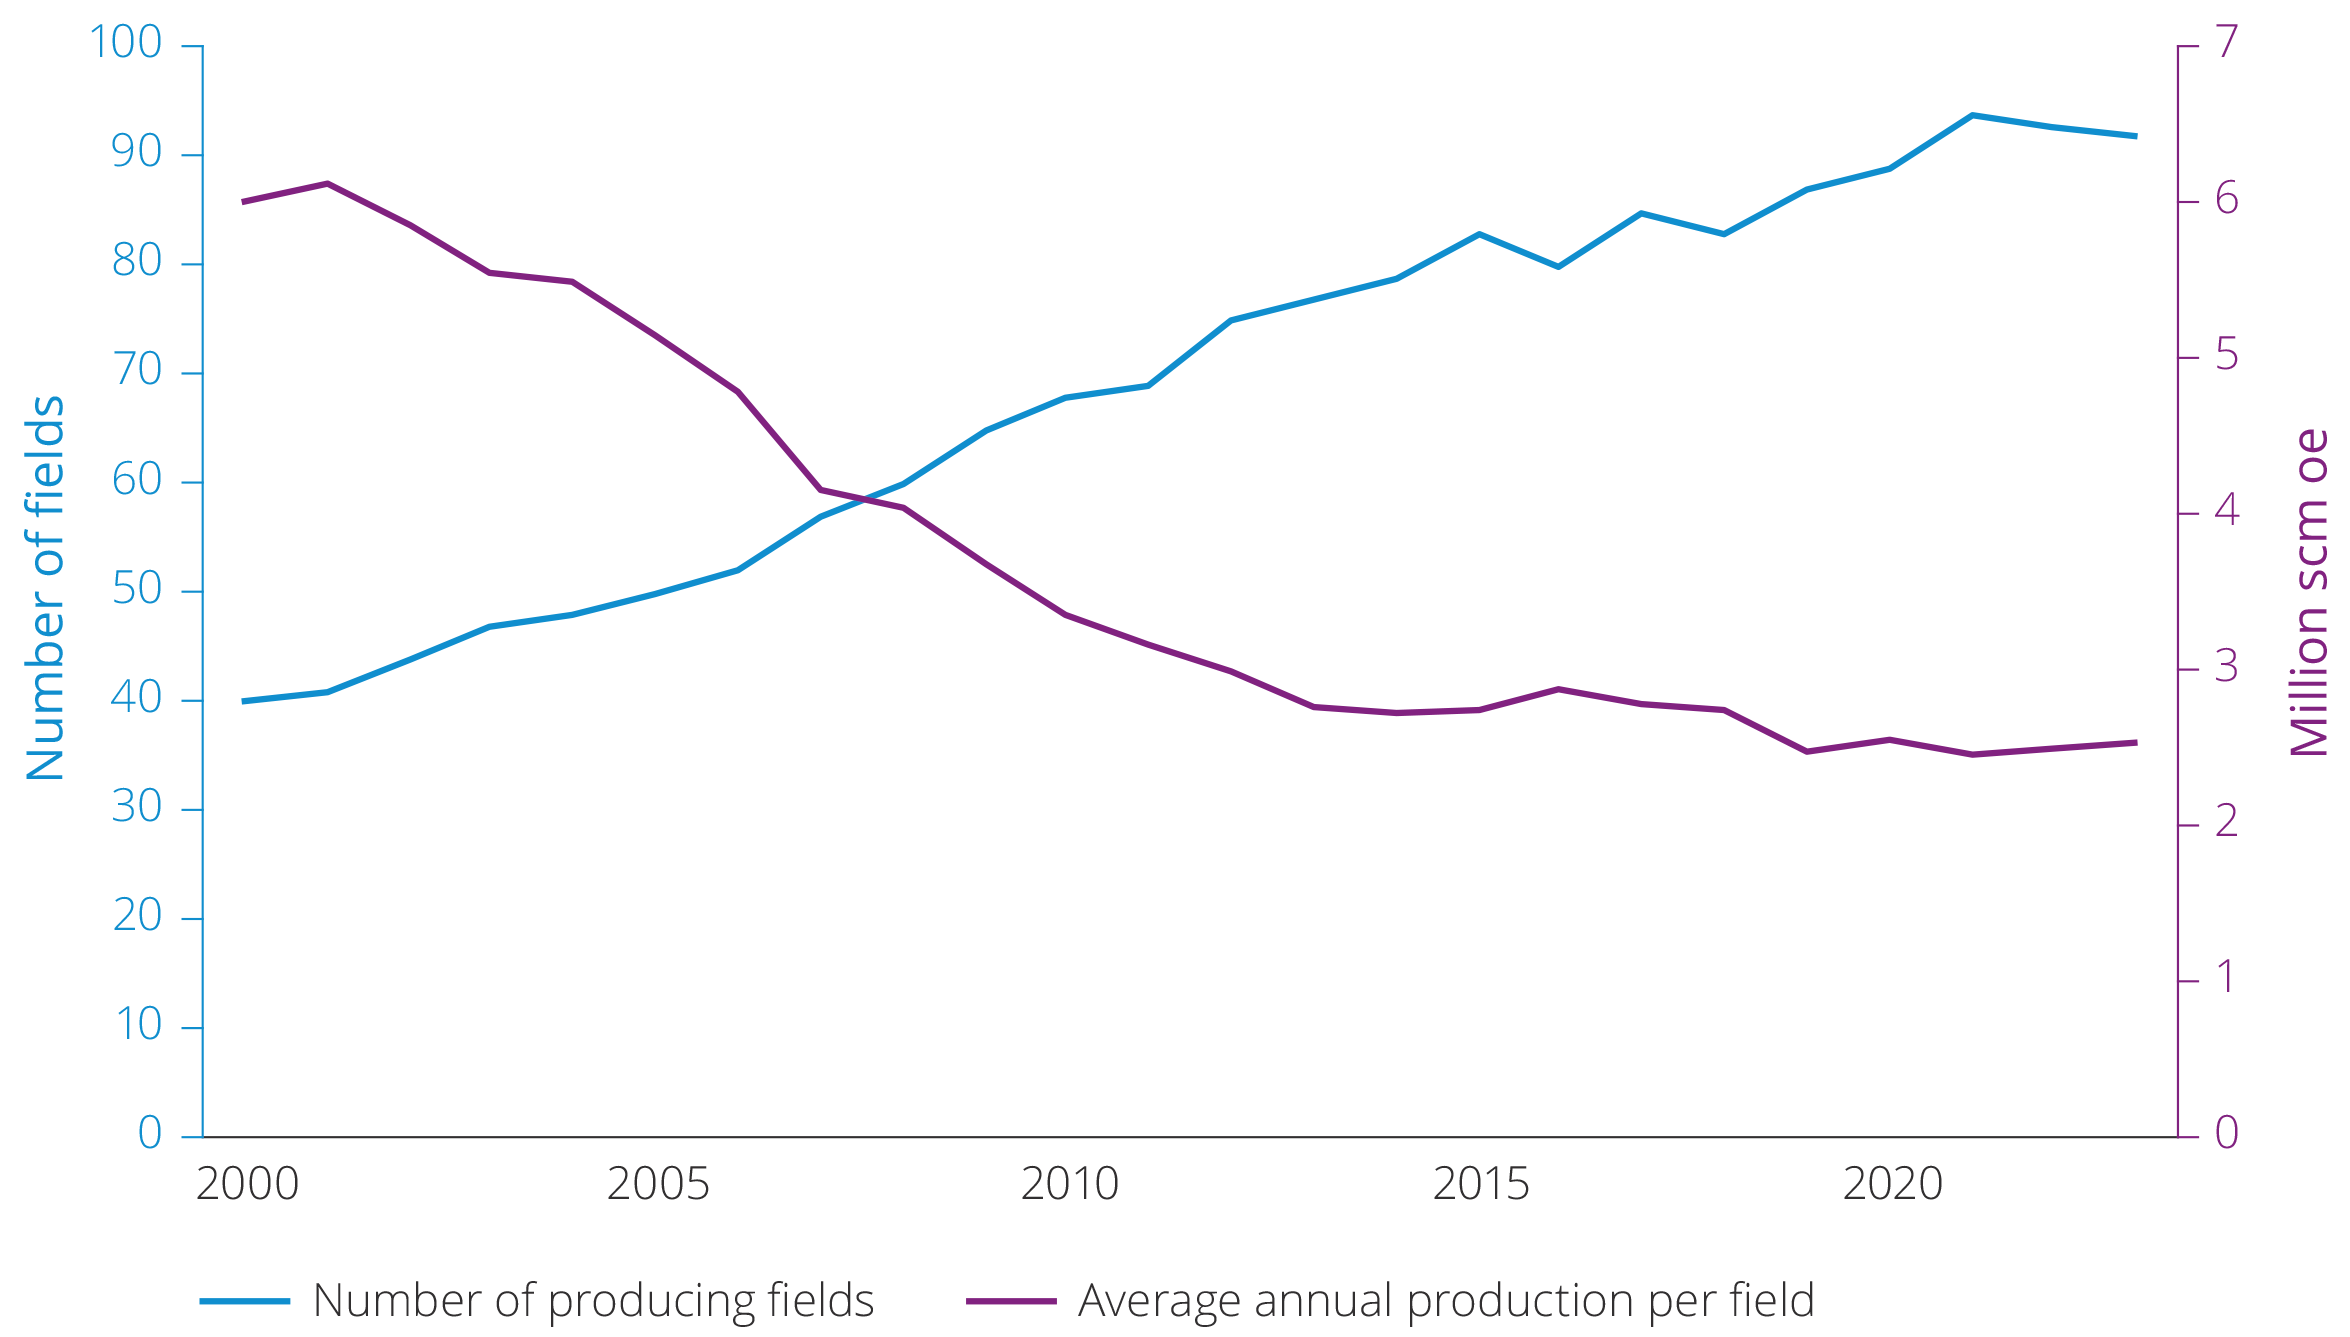
Figure 5.29 Development in number of producing fields and production per field, 2000–2023.
Annual resource growth from exploration has been lower than annual production, with the exception of Johan Sverdrup in 2010, as highlighted in figure 5.30.
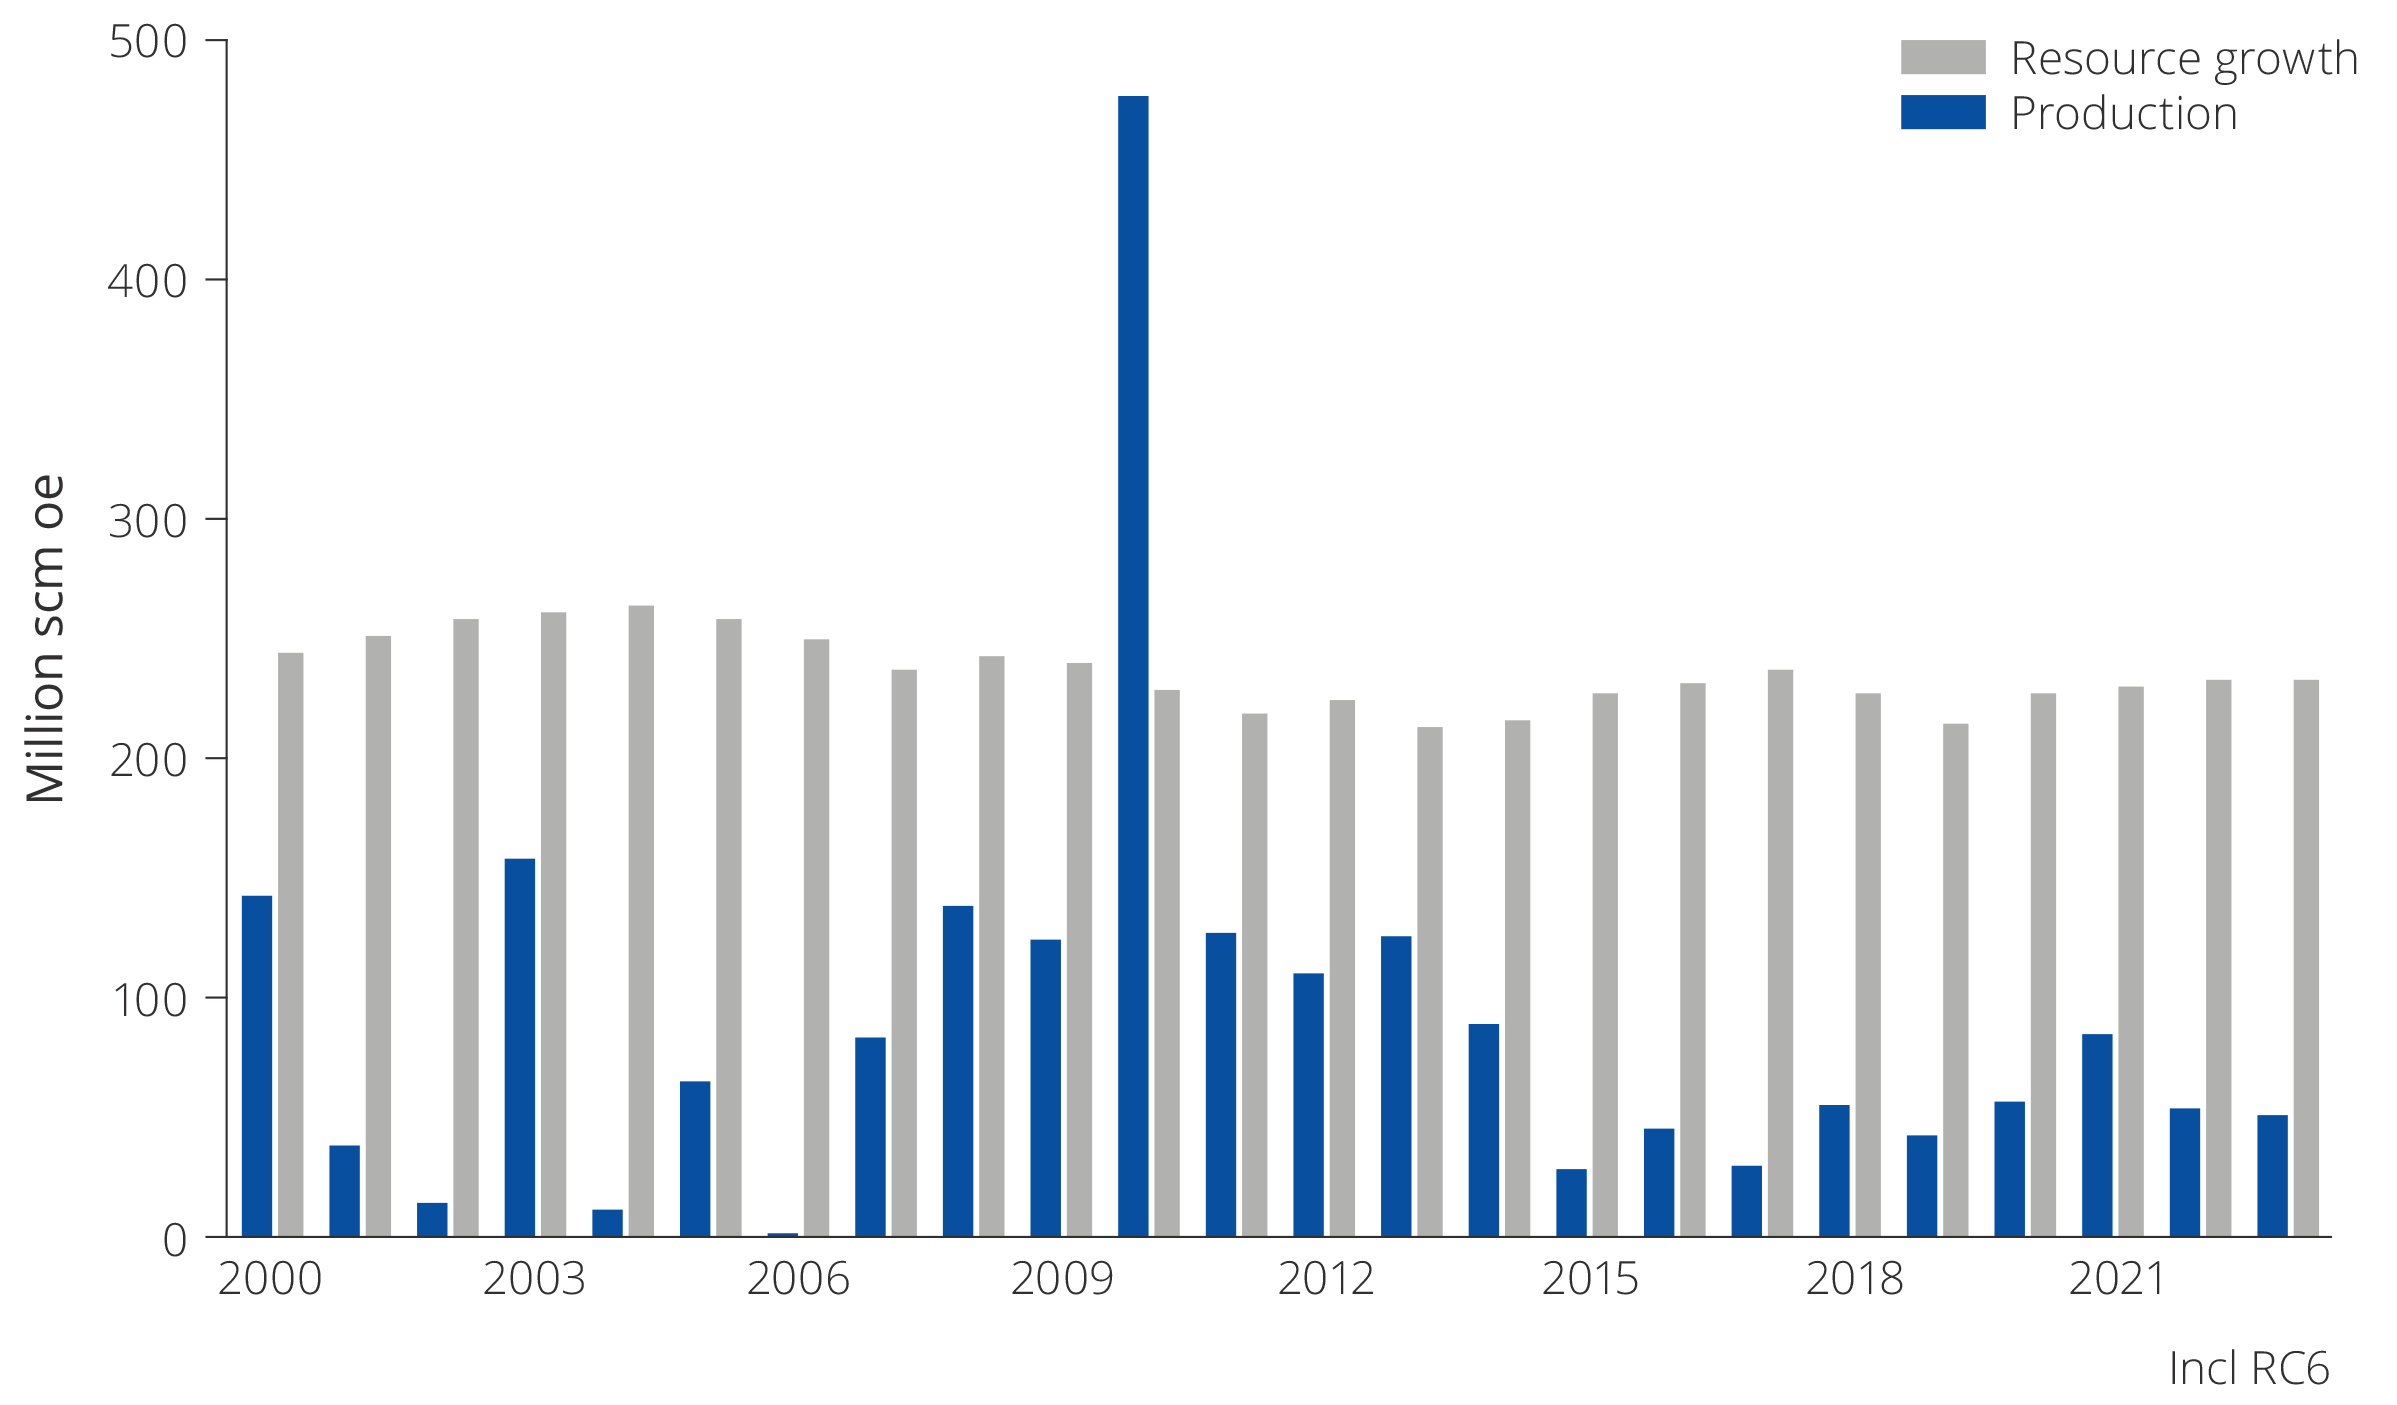
Figure 5.30 Annual production and resource growth from exploration, 2000–2023 (including resource class 6).
Maintaining the success rate despite smaller discoveries
As a petroleum province matures and the "easy" and major discoveries have been made, fewer significant accumulations be left to find. The average discovery size will decline if nonew prospective areas are opened. This development is clear on the NCS and is illustrated by the blue columns in figure 5.30.
At the same time, knowledge and understanding of the geology in an area will increase due to access to additional and better data. This can be data from exploration wells, collected seismic and improve geological models.
Continuous technological advancements contribute to enhanced mapping, which in turn helps maintain the success rate. The success rate remains high on the NCS, despite it becoming more challenging to find new accumulations and the discoveries are becoming smaller. Developments in the technical success rate are shown in the same figure as the discovery's average size in the figure under.
This reflects the fact that advances in technology, better mapping, more and improved use of data as well as increased understanding of the geology has helped slow the effect of gradually depleting the resources in opened areas(35).
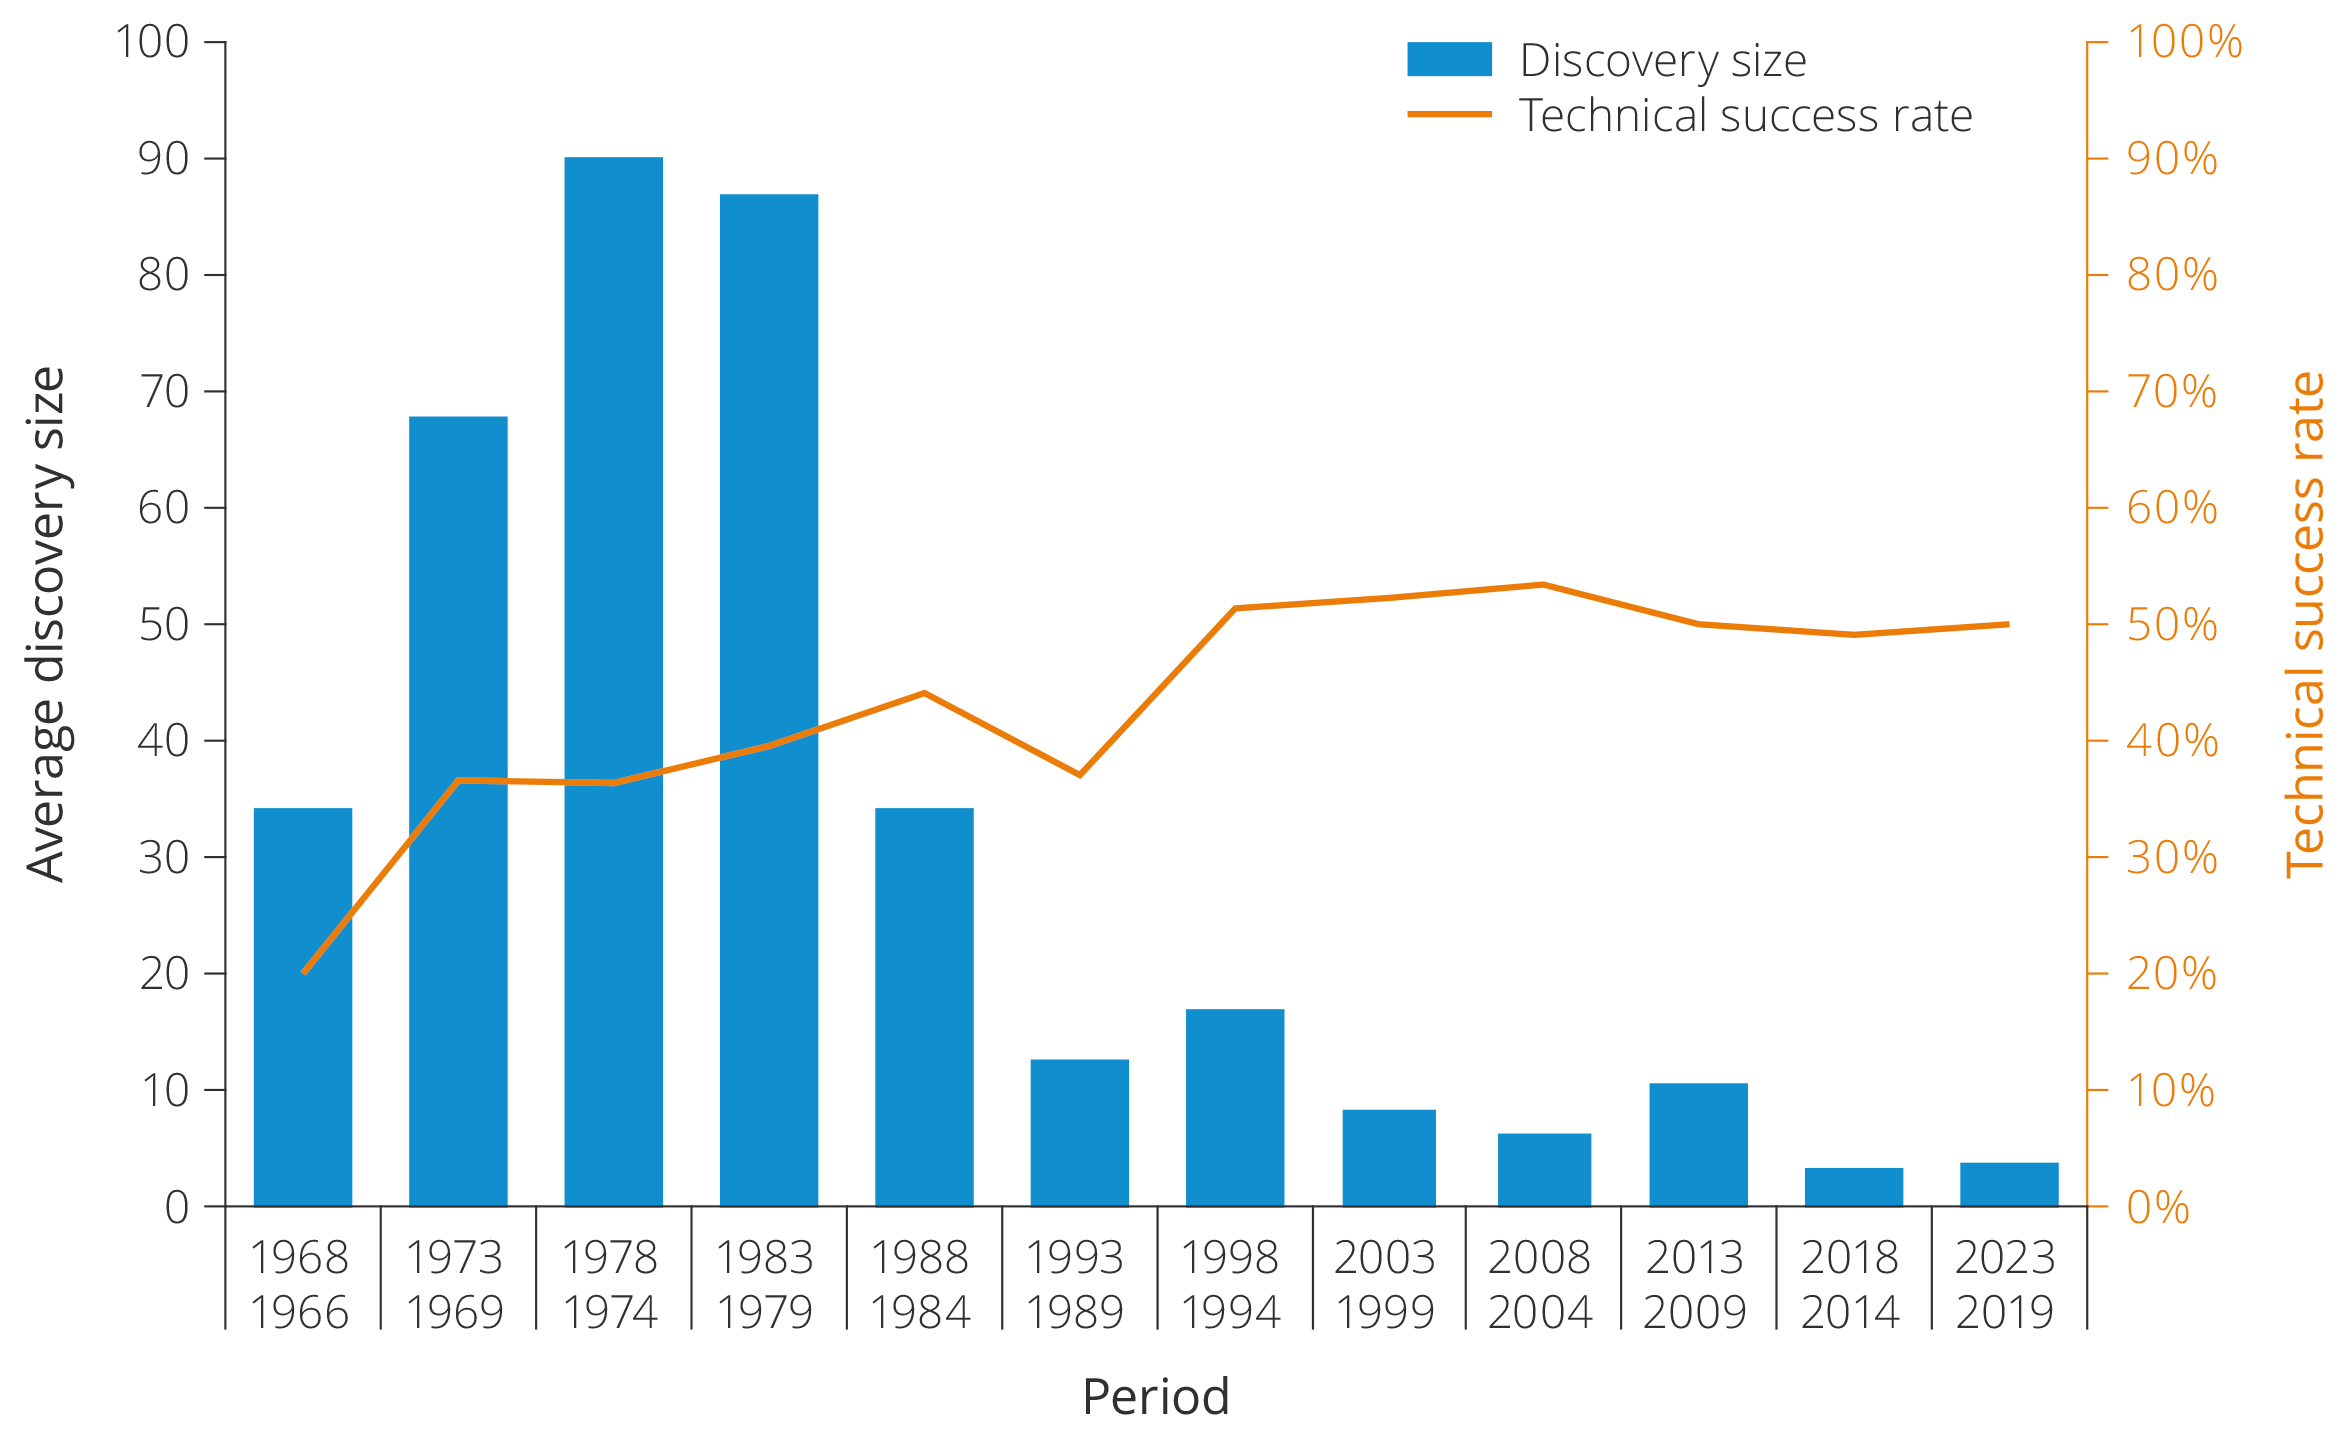
Development in discovery size and success rate, 1966–2023.
Exploration close to infrastructure
Most wildcat wells in the 2000s were drilled close to existing infrastructure, see figure 5.31.
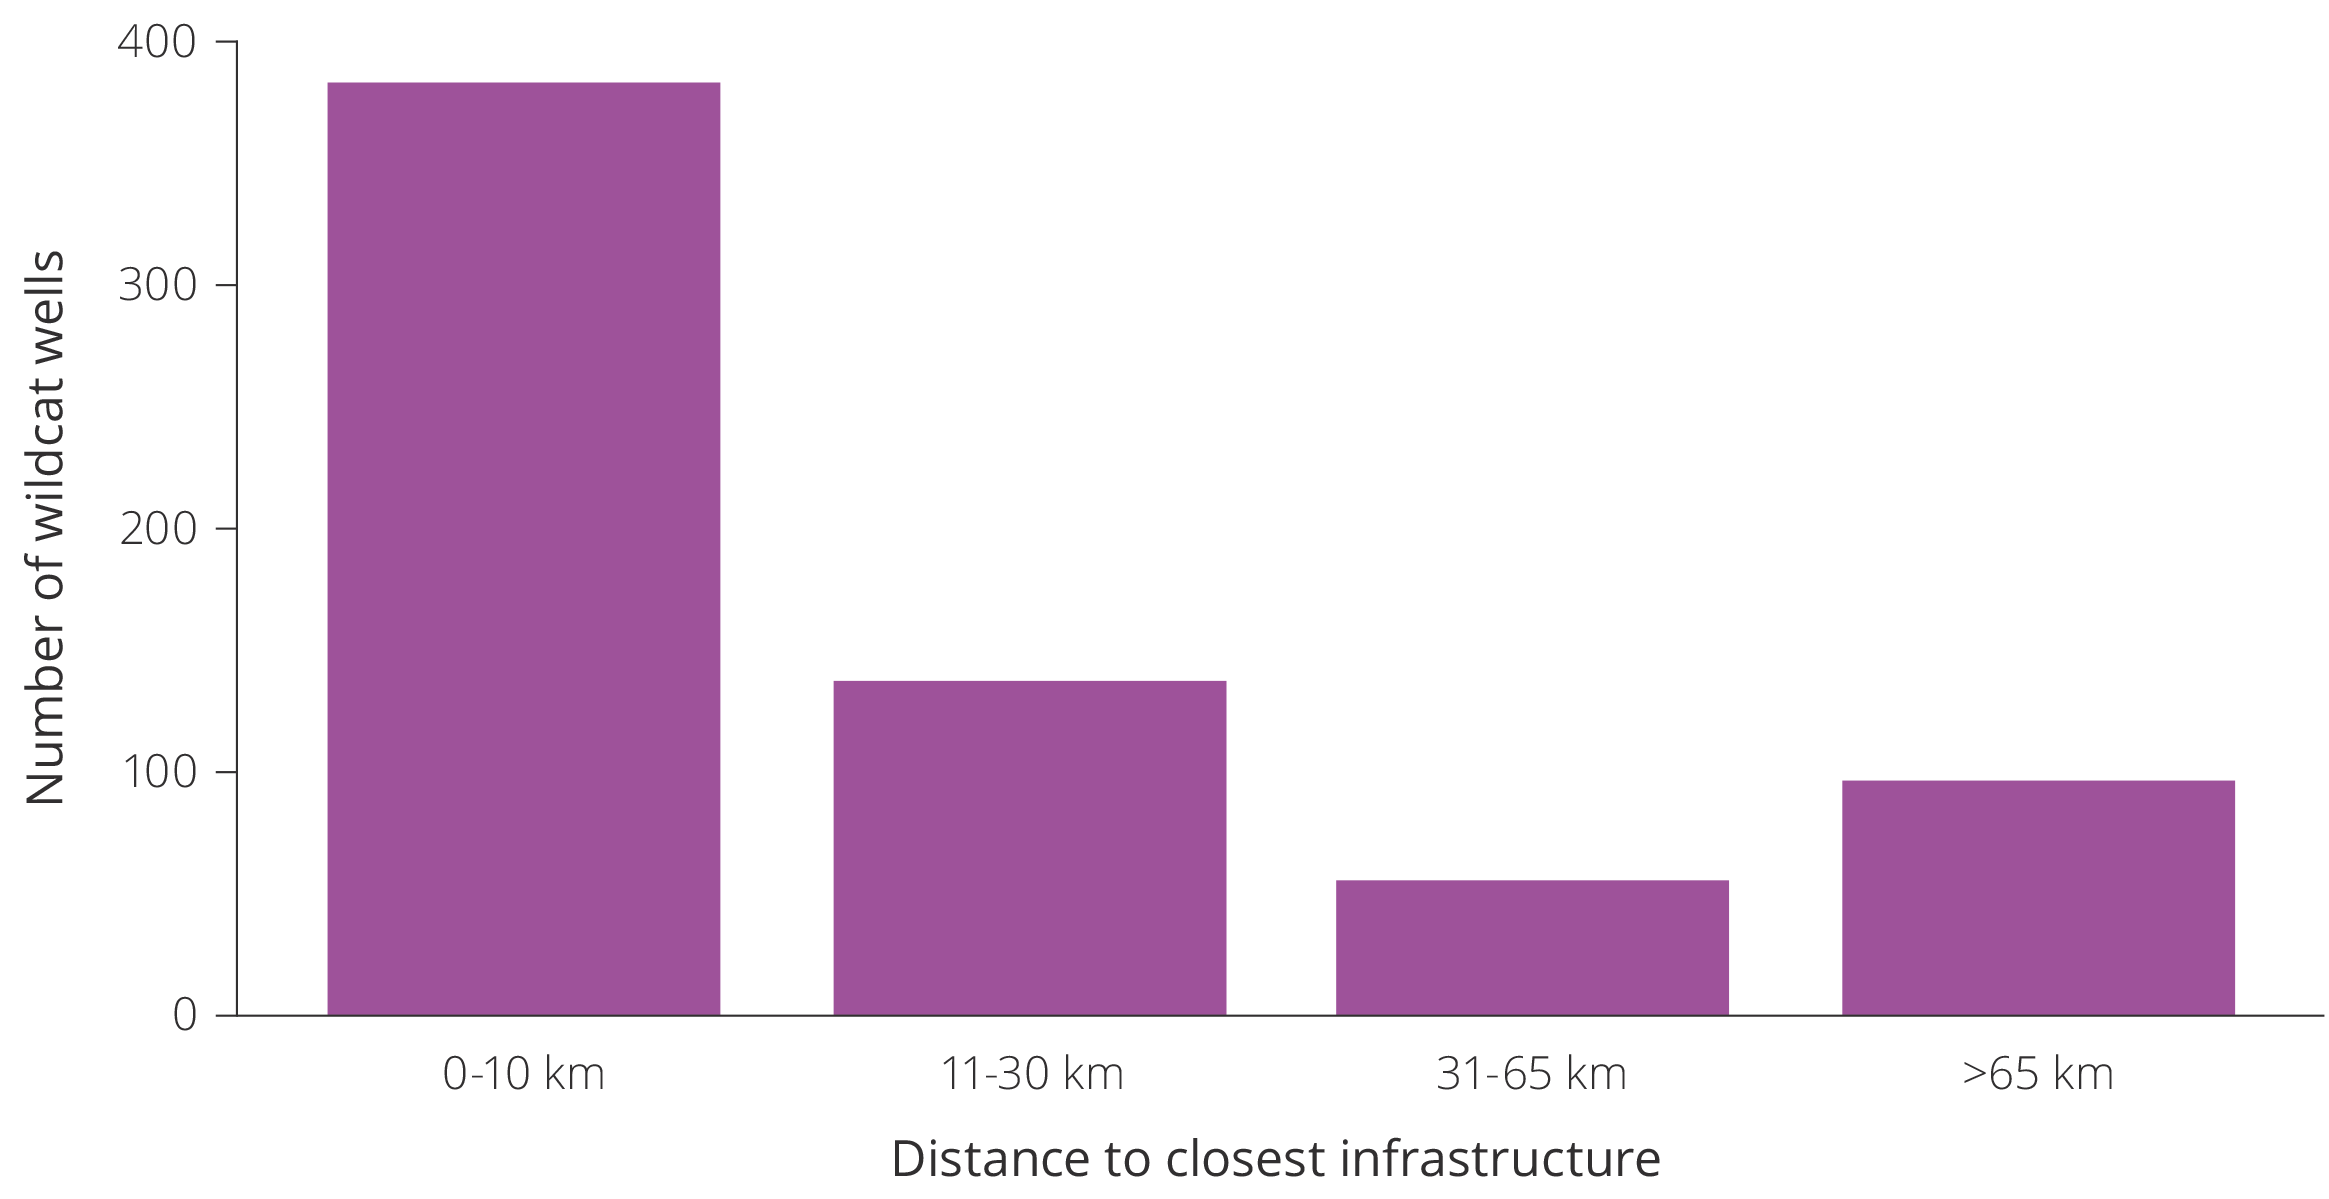
Figure 5.31 Wildcat wells and distance to infrastructure, 2000–2023.
The number of wildcat wells far away from infrastructure appears to follow changes in the oil price. Nevertheless, this trend seems to break after 2020 and fewer wells are being drilled. In 2023 no wells with a distance greater than 65 kilometres from infrastructure were drilled, see also figure 5.27.
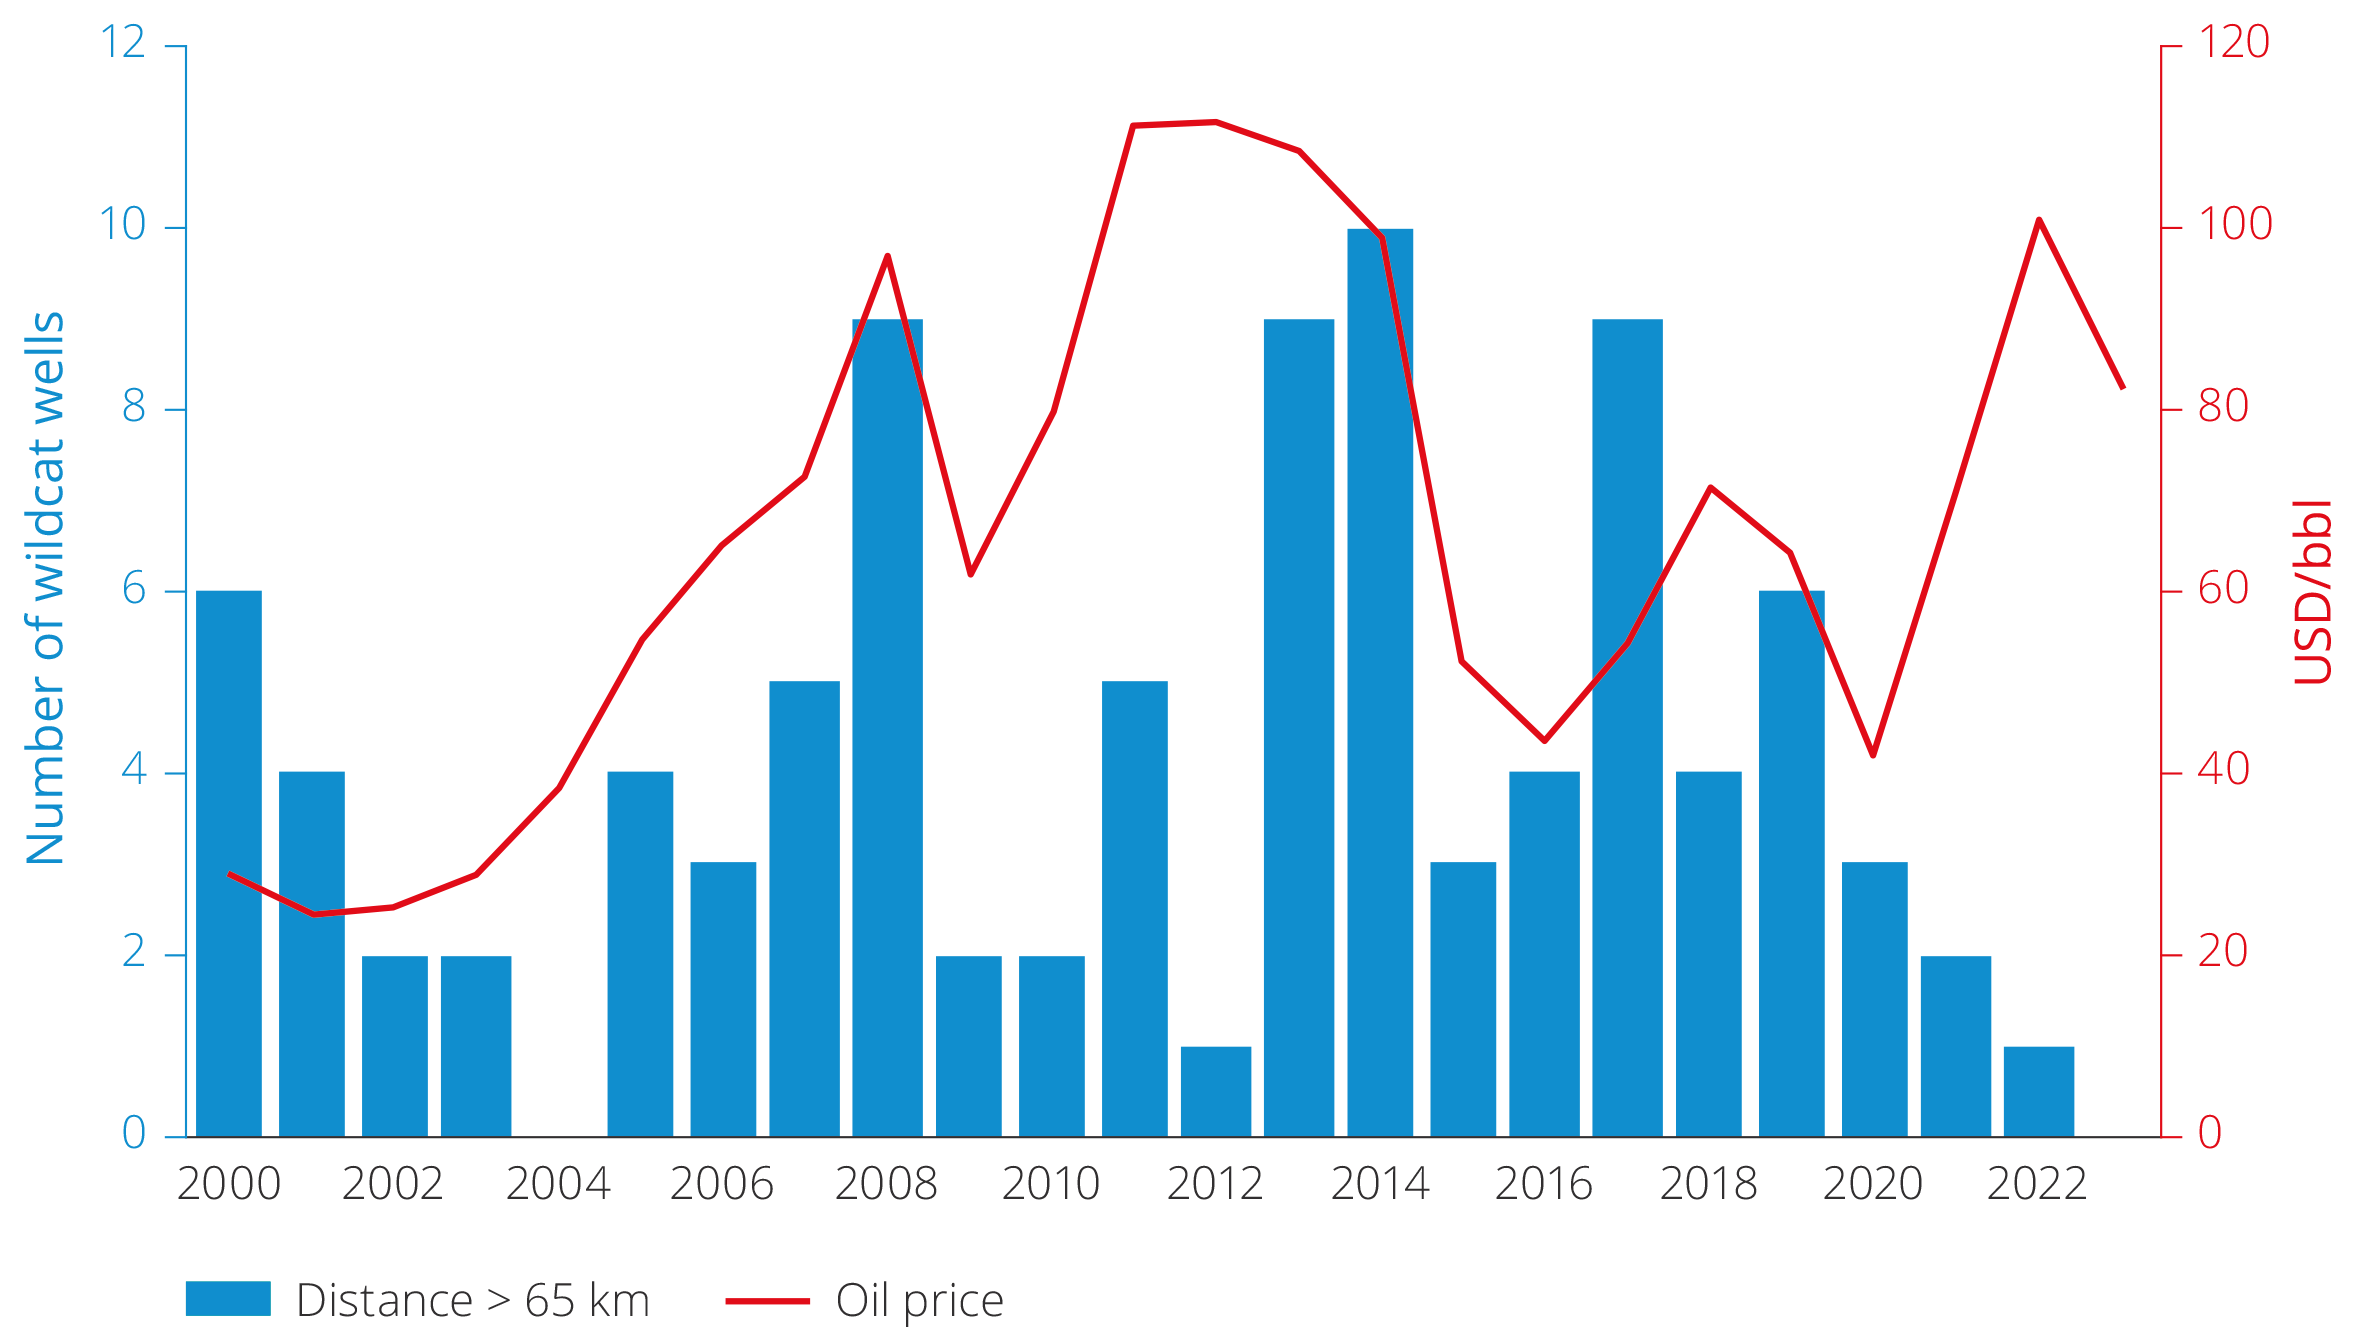
Figure 5.32 Oil price and percentage of exploration wells more than 65 kilometres from the closest infrastructure, 2000–2023.
Exploration in known exploration concepts
Exploration activity has also been increasingly focusing on exploration targets in well-established plays. Market failure can be one of several reasons for this development, see fact box on market failure in exploration. A comparison of all exploration targets drilled between 2019–2023 shows that most are located in classic plays in the Triassic and Jurassic.
The companies drill fewer wells in plays that are underexplored or not confirmed. Examples are shown in figure 5.33. This reflects both the NCS' maturity and the industry's current primary strategy to explore close to existing infrastructure.
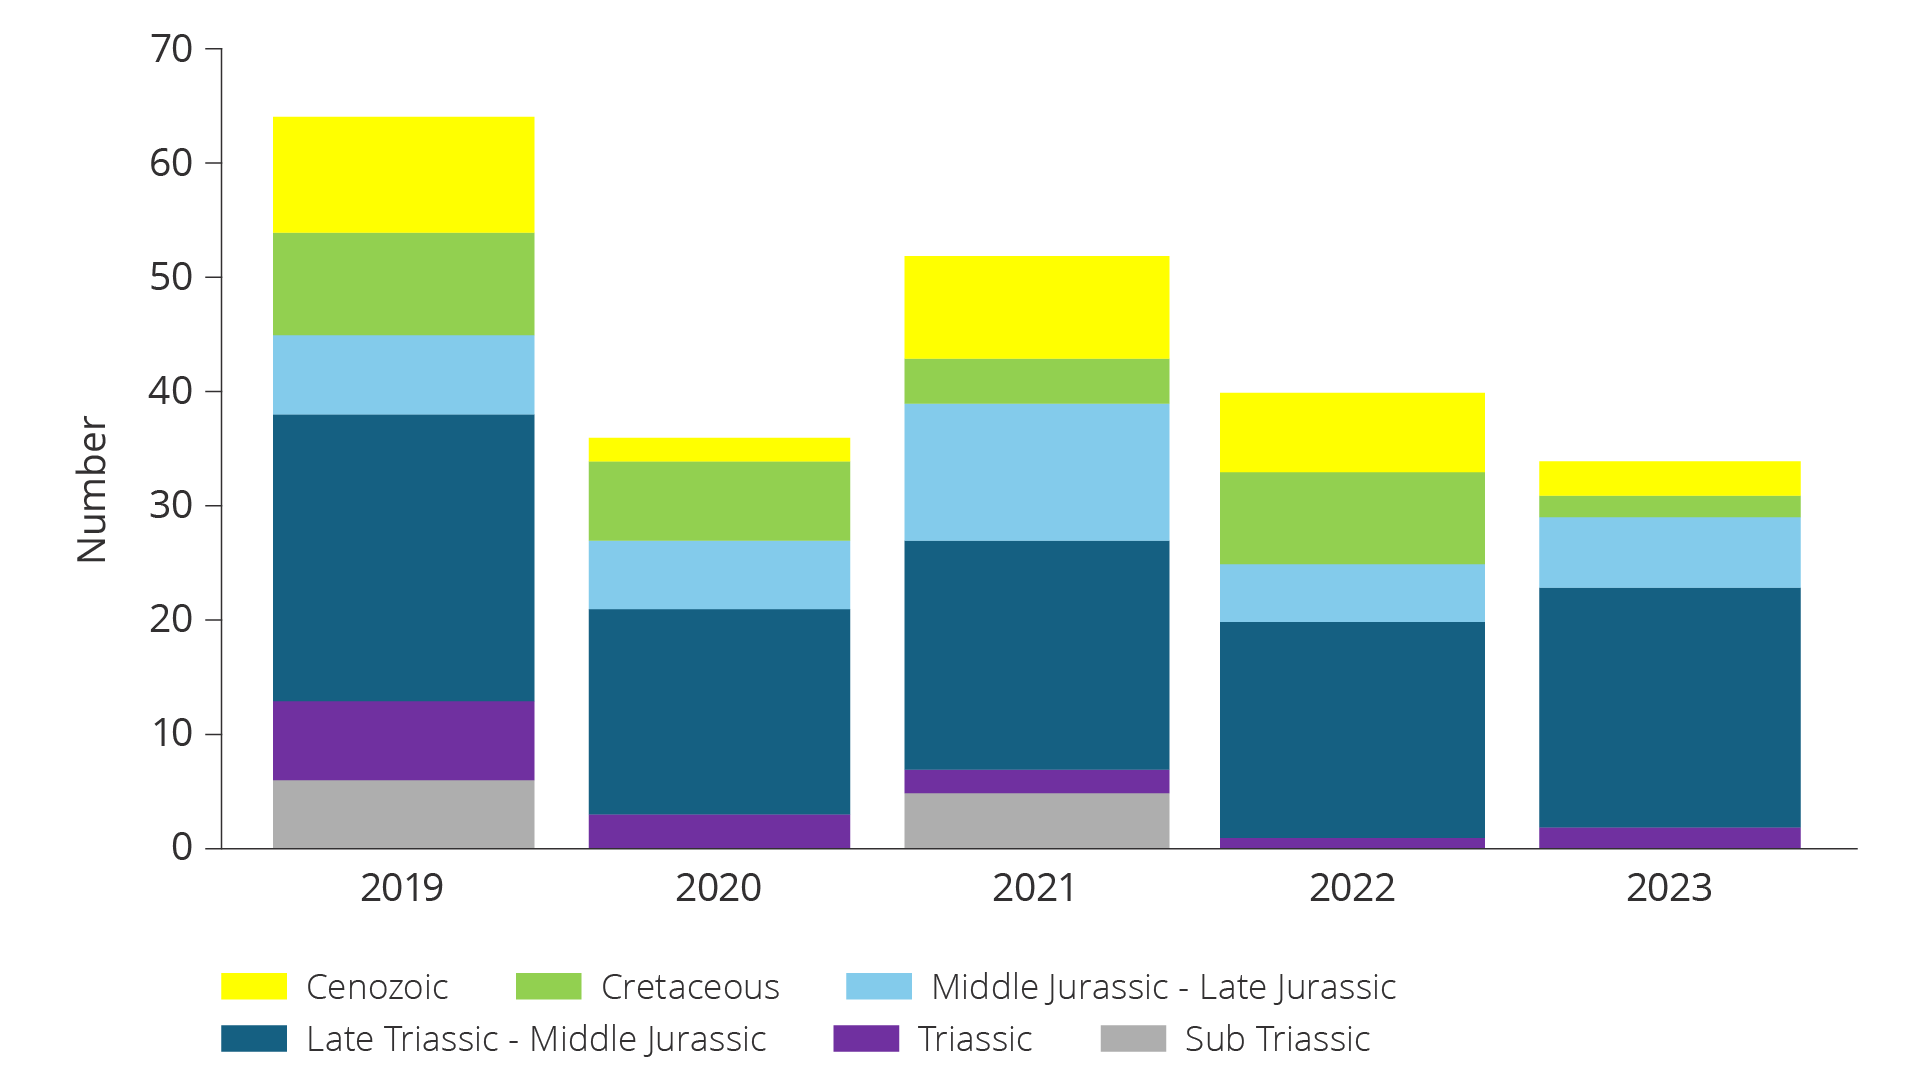
Figure 5.33 Exploration targets drilled in 2019–2023 distributed across geological age.
Larger discoveries will be needed to offset the expected decline in production on the NCS. In other words, exploration in less mature areas and exploration of new concepts is required. The industry has stepped up to address these challenges in the Barents Sea. There has been increased interest in production licences in the area, and the companies are planning a significant increase in drilling activity in 2024 and 2025.
Market failure in exploration
There are multiple forms of market failure in exploration that can result in insufficient exploration. Exploration can be compared with research in the sense that several of the same factors that result in insufficient research also result in insufficient exploration(36). This is linked to the fact that exploration provides information that, in many instances, can be a public good, and where the value of this collective good is higher for society than for the individual company.
Exploration can also have positive external effects in the sense that exploration leads to new knowledge that benefits others without the company receiving compensation for this. This can provide a basis for strategic behaviour that can result in insufficient exploration.
A lack of overlap between the companies' and society's risk assessment can lead to the companies being more impatient than the authorities, and therefore adapt their exploration strategy for more short-term gains. This can result in companies taking less exploration risk.
Several unclarified opportunities in the Barents Sea
8 production licences were awarded in mature areas of the Barents Sea in APA 2023. Most of them are located in the western parts of the Barents Sea, where the youngest plays in the Paleocene and Eocene are most relevant.
Large areas of the Barents Sea South are still underexplored. Exploration has mainly been concentrated on known plays in the Hammerfest Basin and around 7324/8-1 (Wisting) and Johan Castberg.
In central parts of the Barents Sea South, on the Mercurius High and Bjarmeland Platform, are carbonate deposits in the Gipsdalen Group. This play was confirmed with 7234/6-1 (the Stangsnestind discovery), and contains several large structures in the Barents Sea South.
On the Finnmark Platform are structures mapped in the Billefjord Group which is Devonian to Early Carboniferous in age. This play was confirmed with a small gas discovery, 7130/4-1 (Ørnen) in 2016, with reservoir in the Soldogg Formation.
There are also structures mapped in the overlying Røye Formation of Permian age. The Røye Formation can consist of both, silicified carbonates, sandstones and spiculites; see figure 5.34. This play was confirmed with the 7128/4-1 (Omd Vest) discovery as early as 1994, and this discovery was made in a spiculite reservoirs.
There are large quantities of 2D and 3D seismic available for the Barents Sea, and more seismic is being released continuously(37). Better imaging will contribute to increased understanding of the different prospective levels.
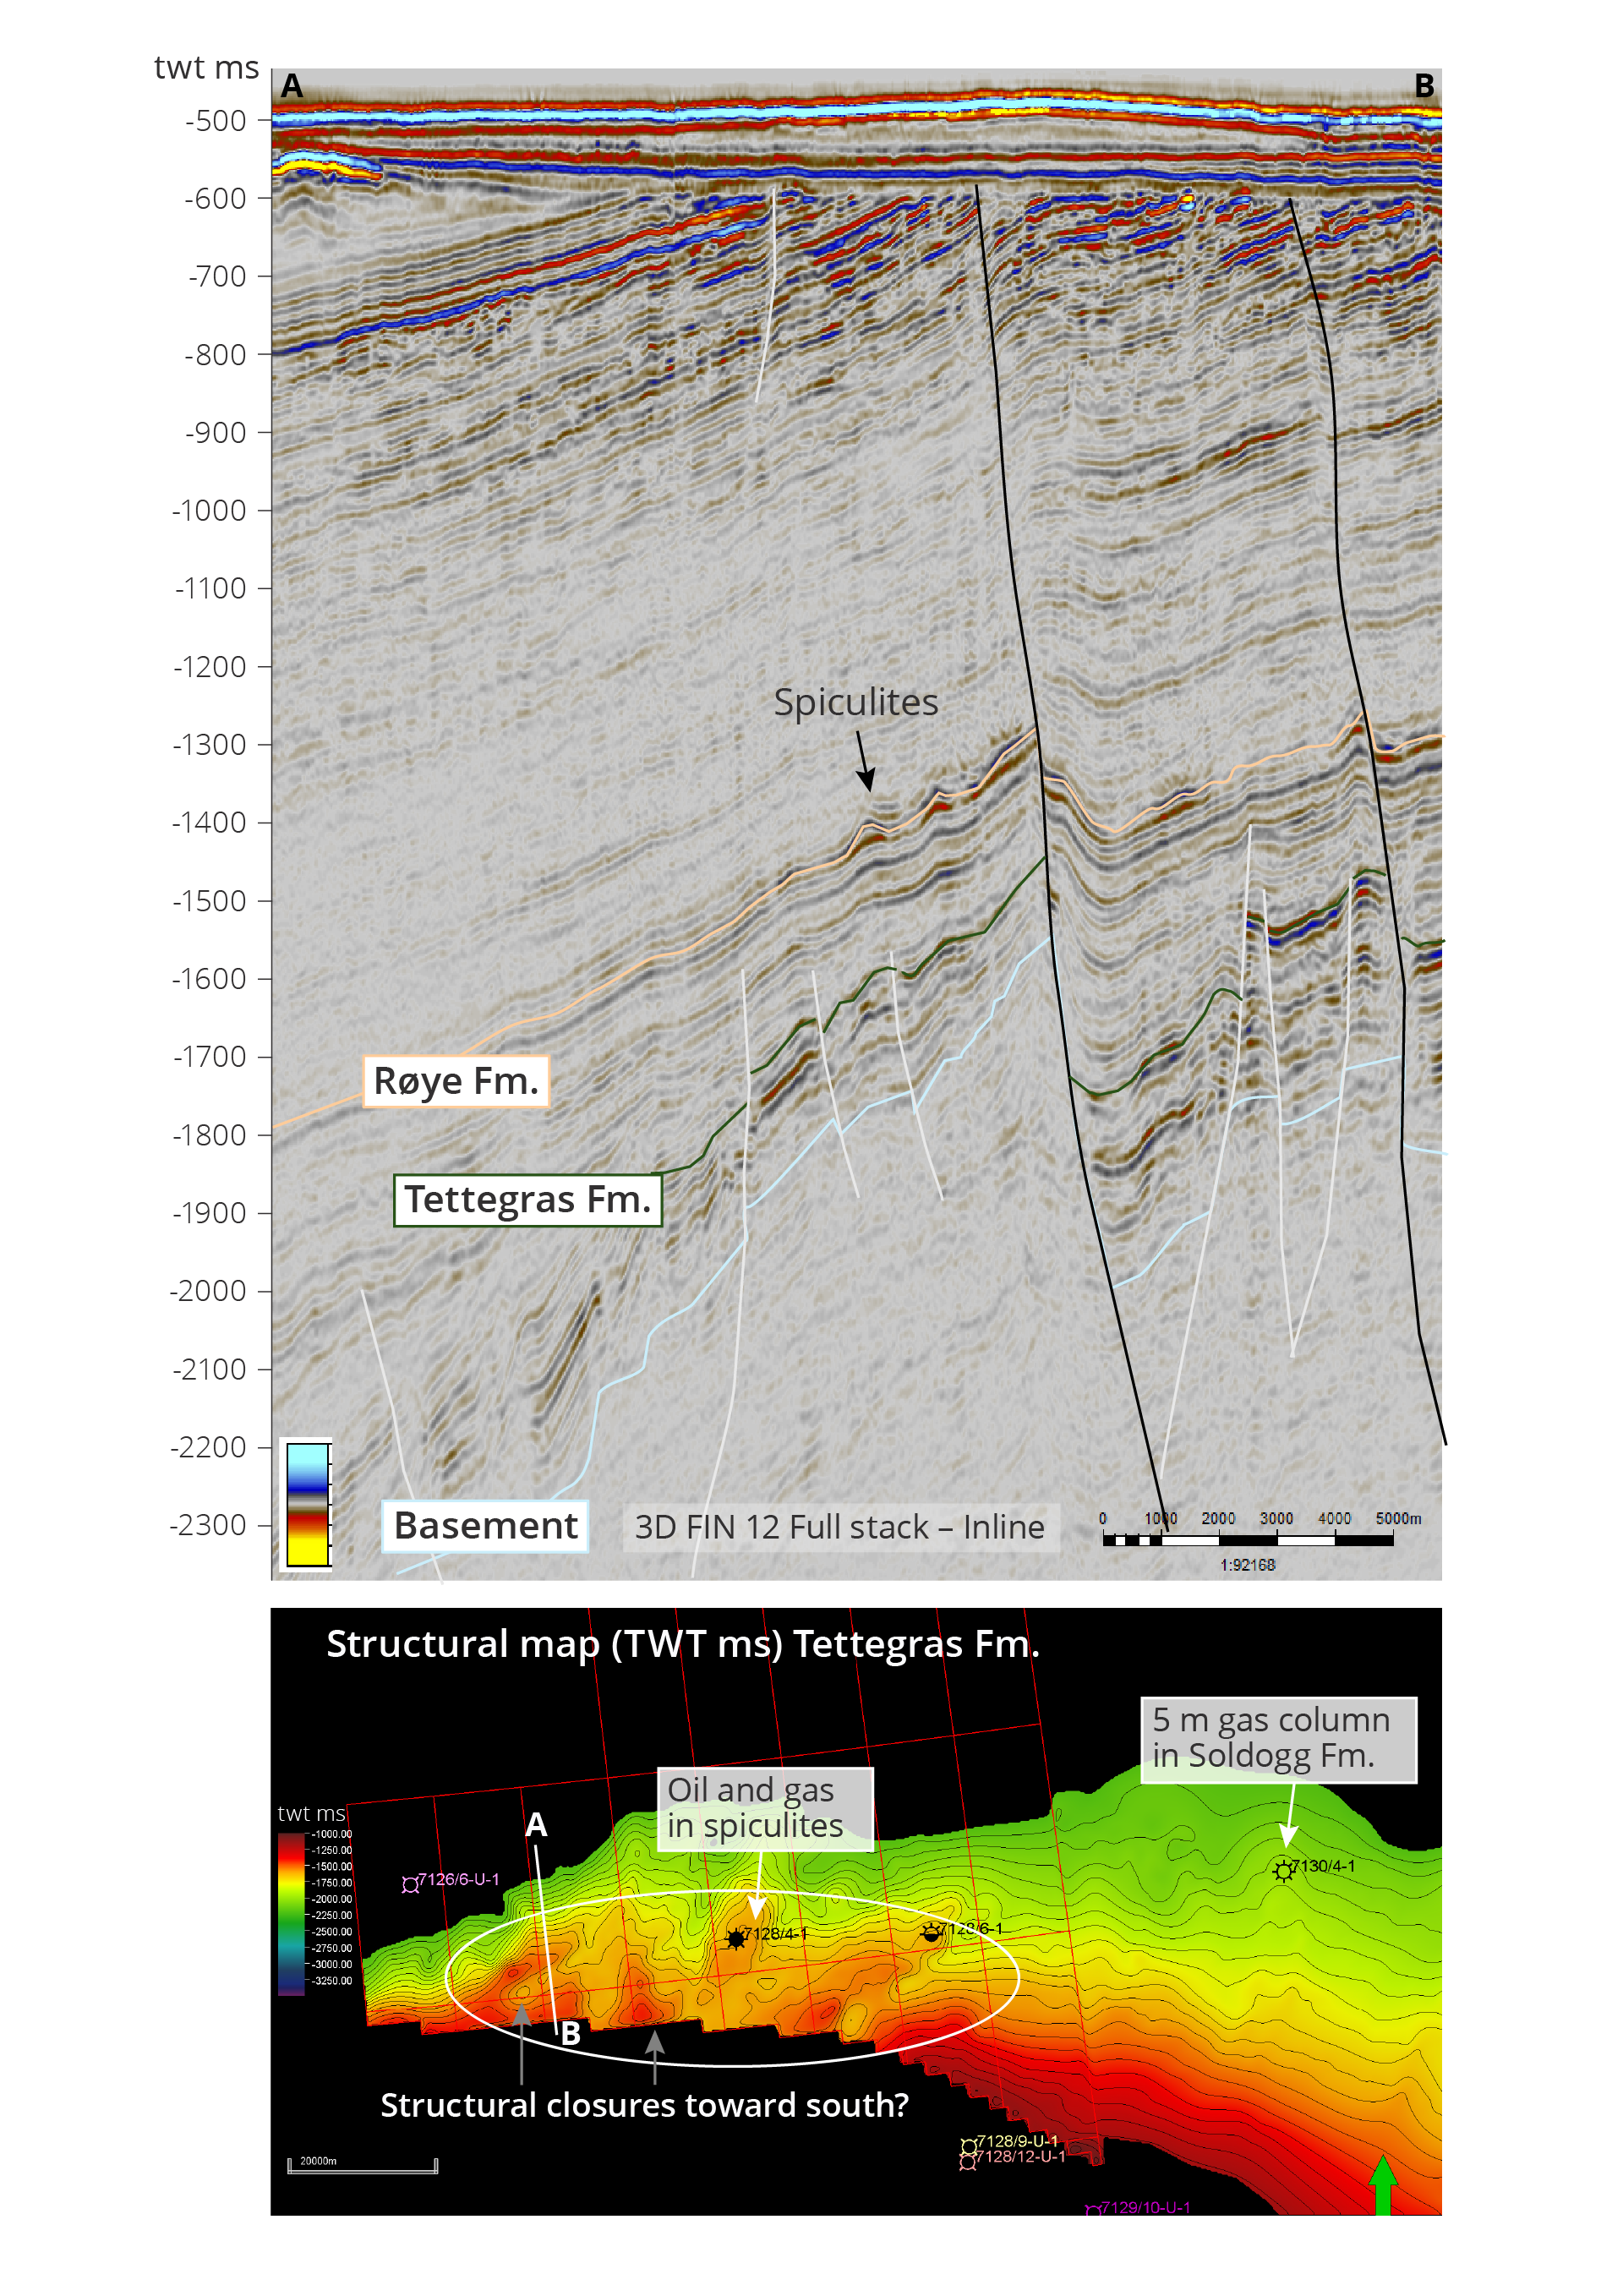
Figure 5.34 The seismic cross-section on top shows the Røye Formation, which can contain spiculites. The orientation of the cross-section is shown on the map at the bottom (white line). The map shows the extent of the mapped Top Tettegras Formation reflector.
Greater hydrocarbon potential than previously presumed in the Barents Sea West
The Norwegian Offshore Directorate has, for many years, been participating in expeditions mapping and sampling natural oil and gas leaks on the NCS.
A new source rock from the Early Miocene was proven in 2023 based on analyses and interpretations of oil samples from these leaks.
The Directorate has partnered with several universities and is participating in ongoing research projects to better understand the evolution of this new source rock. The goal is to investigate whether this source rock is present under the Bjørnøya Fan and in the western part of the Barents Sea, as well as how far it extends southward towards the Vøring Plateau in the Norwegian Sea.
If it is present under the Bjørnøya Fan and to the far west in the Barents Sea, it may significantly impact the prospectivity in this area.
In May 2023, the Norwegian Offshore Directorate participated in a scientific research expedition in the Barents Sea together with the University of Tromsø (UiT). This expedition was particularly focused on documenting natural gas seepages and taking samples for geochemical analyses, and put them in context with samples taken in other areas with the new young source rock. A mud volcano was discovered in the Sørvestsnaget Basin during this expedition. This was the second mud volcano ever discovered in Norwegian areas, and it was named Borealis.
Ten new mud volcanoes were discovered in spring 2024, in an area in the western Barents Sea, which was part of the APA 2023. Several piles on the seabed with interesting seismic imaging had been selected in advance for exploration. The volcanoes were confirmed using multibeam echo sounders and surveys using ROVs (remotely operated underwater vehicles).
The mud volcanoes were discovered by the EXTREME24 expedition with the research vessel RV Kronprins Haakon. The primary objective of this research expedition under the auspices of UiT was to conduct additional studies on the Borealis mud volcano.
Both gas and sediment samples were taken from most of the mud volcanoes. These samples will be subject to biostratigraphic and geochemical analyses to confirm both, the age of the sediment, the source rock that is generating the gas and potentially other hydrocarbons.
Indications of a new source rock and the discovery of multiple mud volcanoes could indicate a greater hydrocarbon potential than previously presumed for the Barents Sea West.
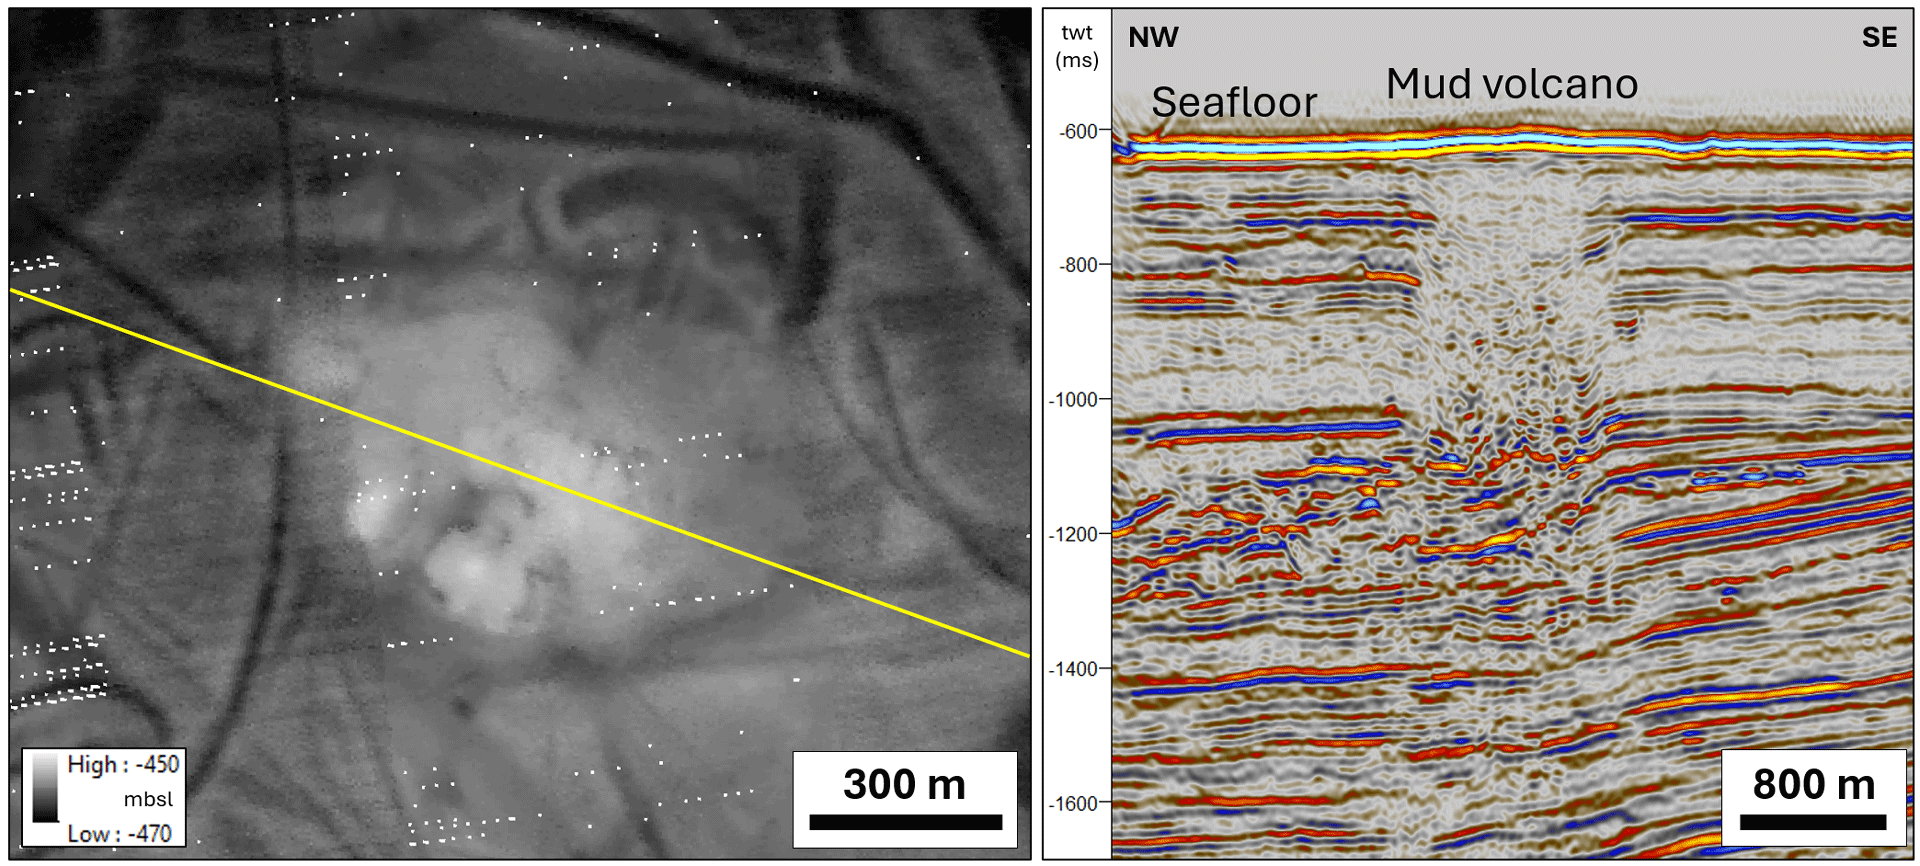
Figure 5.35 The map on the left shows the seabed mapped with echo sounders (unprocessed data, ten-metre resolution). One of the newly discovered mud volcanoes can be seen in the centre of the map (light grey shading). The yellow line indicates the position of the cross-section on the right. The mud volcano is a pile on the seabed with a diameter of about 600-700 metres and a height of up to seven metres over the surrounding seabed. The cross-section through the mud volcano shows clear seismic indications of mud and gas bubbling up in a broad area under the mud volcano, which is indicated here by a chaotic expression in the centre of the image. The source of this mud appears to be shallow, about 400 metres below the seabed.
DownloadDrivers, challenges and opportunities
In this chapter:
- Technological development pushes the envelope
- Exploration creates enormous value
- Gas infrastructure is important for extracting value from remaining resources
- Measures to curb greenhouse gas emissions
- Electrification reduces emissions
Technological development pushes the envelope
Learning and developing new expertise and technology have always been important factors when it comes to finding, developing and producing oil and gas resources on the Norwegian continental shelf (NCS).
Framework conditions that are good, and foremost predictable have stimulated oil companies to commit to research and development (R&D) in Norway. The Ministry of Energy (MoE) also grants substantial public funding for research programs within the petroleum sector.
The MoE established a strategy group called OG21 (Oil and Gas for the 21st Century) in an effort to ensure coordinated, efficient and focused research and technology efforts. The group’s mission is to delineate national R&D strategies for the petroleum sector that can provide guidance for both the industry itself and for the authorities.
OG21 strategy
Research, technological development and innovation within eight specific areas deemed to be of particular importance:
Improved understanding of the subsurface and associated tools are fundamental for the attractiveness and competitiveness of the NCS.
Cost-effective drilling, plugging and abandonment of wells (P&A) target two major cost elements on the NCS.
Efficient use of existing infrastructure will be key for producing remaining reserves in the fields, and to realise contingent resources.
Unmanned installations and subsea tie-back solutions include technologies such as multiphase modelling. These solutions can extend potential tie-back distances and help promote use of subsea processing technologies and unmanned production facilities.
Energy-efficient and cost-effective electrification is a significant factor in achieving the sector’s goal of reducing greenhouse gas emissions by 50 per cent by 2030.
Carbon capture and storage (CCS) is a core technology for reducing CO2 emissions.
Being a world leader within HSE and environment is one of the sector’s fundamental values, and an essential factor in maintaining acceptance from the broader society.
Digitalisation is crucial in achieving faster, better decision processes. It yields lower costs, increased overall resources, reduced greenhouse gas emissions and improved safety.
The OG21 strategy establishes a framework for the Norwegian Offshore Directorate’s initiatives to advance technology development and enhance the utilisation of technology on the NCS.
A strategy has been developed to increase the use of technology on the NCS, based on the Directorate’s mandate and its awareness of where the companies and the market have not facilitated sufficient commitments. This strategy(39) focuses on selected areas of technology aimed at finding more, recovering more and reducing emissions.
Tight reservoirs pose challenges
A tight reservoir is a reservoir with low permeability.
Recovery from tight reservoirs normally entails relatively low production rates spread over a long production horizon. In most cases, this recovery is only profitable if the development is based on tie-backs to existing infrastructure. Hence the importance of bringing developments on stream at a sufficiently early stage to ensure resources can be produced within the lifetime of existing infrastructure, further discussed in chapter 6, the time-critical aspect.
In 2023, the Norwegian Offshore Directorate compiled an overview of all stranded gas discoveries (discoveries that have yet to be developed) and identified alternative solutions that can be implemented to enable recovery of these resources. The study revealed that a great many of the idle gas discoveries in the North Sea and the Norwegian Sea include tight reservoirs in all or parts of the discoveries. Technology that enables higher productivity in tight gas reservoirs is one option that can lead to improved recovery and value creation.
An extensive survey of tight reservoirs on the NCS was conducted and presented in Resource report 2019. This evaluation identified a total of around 2000 million scm oe in place in tight reservoirs, across 42 discoveries and fields. The resources were distributed between around 1200 million scm of oil and 800 billion scm of gas.
The biggest challenge producing from tight reservoirs is low production rates, too low for recovery to be profitable using standard well solutions. This means implementing measures that increase reservoir exposure, and thus the productivity of the well, to ensure better flow of oil and gas. This can be done by fracturing the reservoir near the wells and/or by drilling multiple wellbores in the tight zones.
At present time, various types of fracturing and multi-branch wells are the most relevant methods for recovering resources in tight reservoirs. Fracturing combined with acid stimulation is used on the chalk fields in the southern North Sea.
Slim hole technology is also a relevant alternative in some locations. Many slim boreholes in the same well increase exposure to the reservoir and make it easier for oil and gas to flow into the wells. Fracturing combined with water and gas injection can also contribute to enhanced recovery.
A number of drilling and well technologies exist that are aimed at ensuring good well productivity in tight reservoirs, and thereby possible profitable recovery. Some examples include slim hole drilling, well stimulation and hydraulic fracturing, multi-branch wells and various combinations of the above. Some sporadic testing of these technologies has occurred, but they have rarely been used in tight reservoirs on the NCS.
Improved oil recovery from marginal reservoirs on the Edvard Grieg field
Production well 16/1-A-3 was drilled in the summer of 2023. The objective of the well was to improve the recovery rate in basement and conglomerates on and around the northeastern high on the Edvard Grieg field in the North Sea (Tellus Øst). The well has two branches.
The first branch (basement and conglomerate) was completed with five separate screen sections where different parts of the reservoir are isolated with intumescent seals. The second branch (conglomerate) was completed with so-called Fishbones, which means that a series of smaller branches are drilled into the formation to provide increased exposure to the reservoir and thus increased productivity in the well.
A total of six separate controllable production stations (Manara) were installed in the well. Five of the stations are situated in the first branch to enable monitoring and balancing production between the various zones in conglomerate and basement. The sixth and last zone controls production from the entire second branch.
Clean-up of this well, where production rates in certain periods exceeded 1500 scm of oil per day, shows good flow potential. However, production has been held back after the well came on stream, while waiting for seals to set. The objective is to prevent excessive early water break-through.
In the spring of 2024, the well produced around 250 scm per day with a total water cut of approximately 10–20 per cent.
The ability to monitor development and control production along the wellbore and between the branches is important for optimising total resource utilisation on the field, as well as to collect data that provides more precise understanding of how the various types of basement reservoirs behave over time.
The expectation is that large volumes of oil are present in the basement rock around Edvard Grieg. However, due to the unconventional nature of the reservoir, exactly how much can be produced from this reservoir remains uncertain. In this context, data and experience gained from 16/1-A-3 will constitute a small but important step in the ongoing work to develop a strategy for future utilisation of these resources.
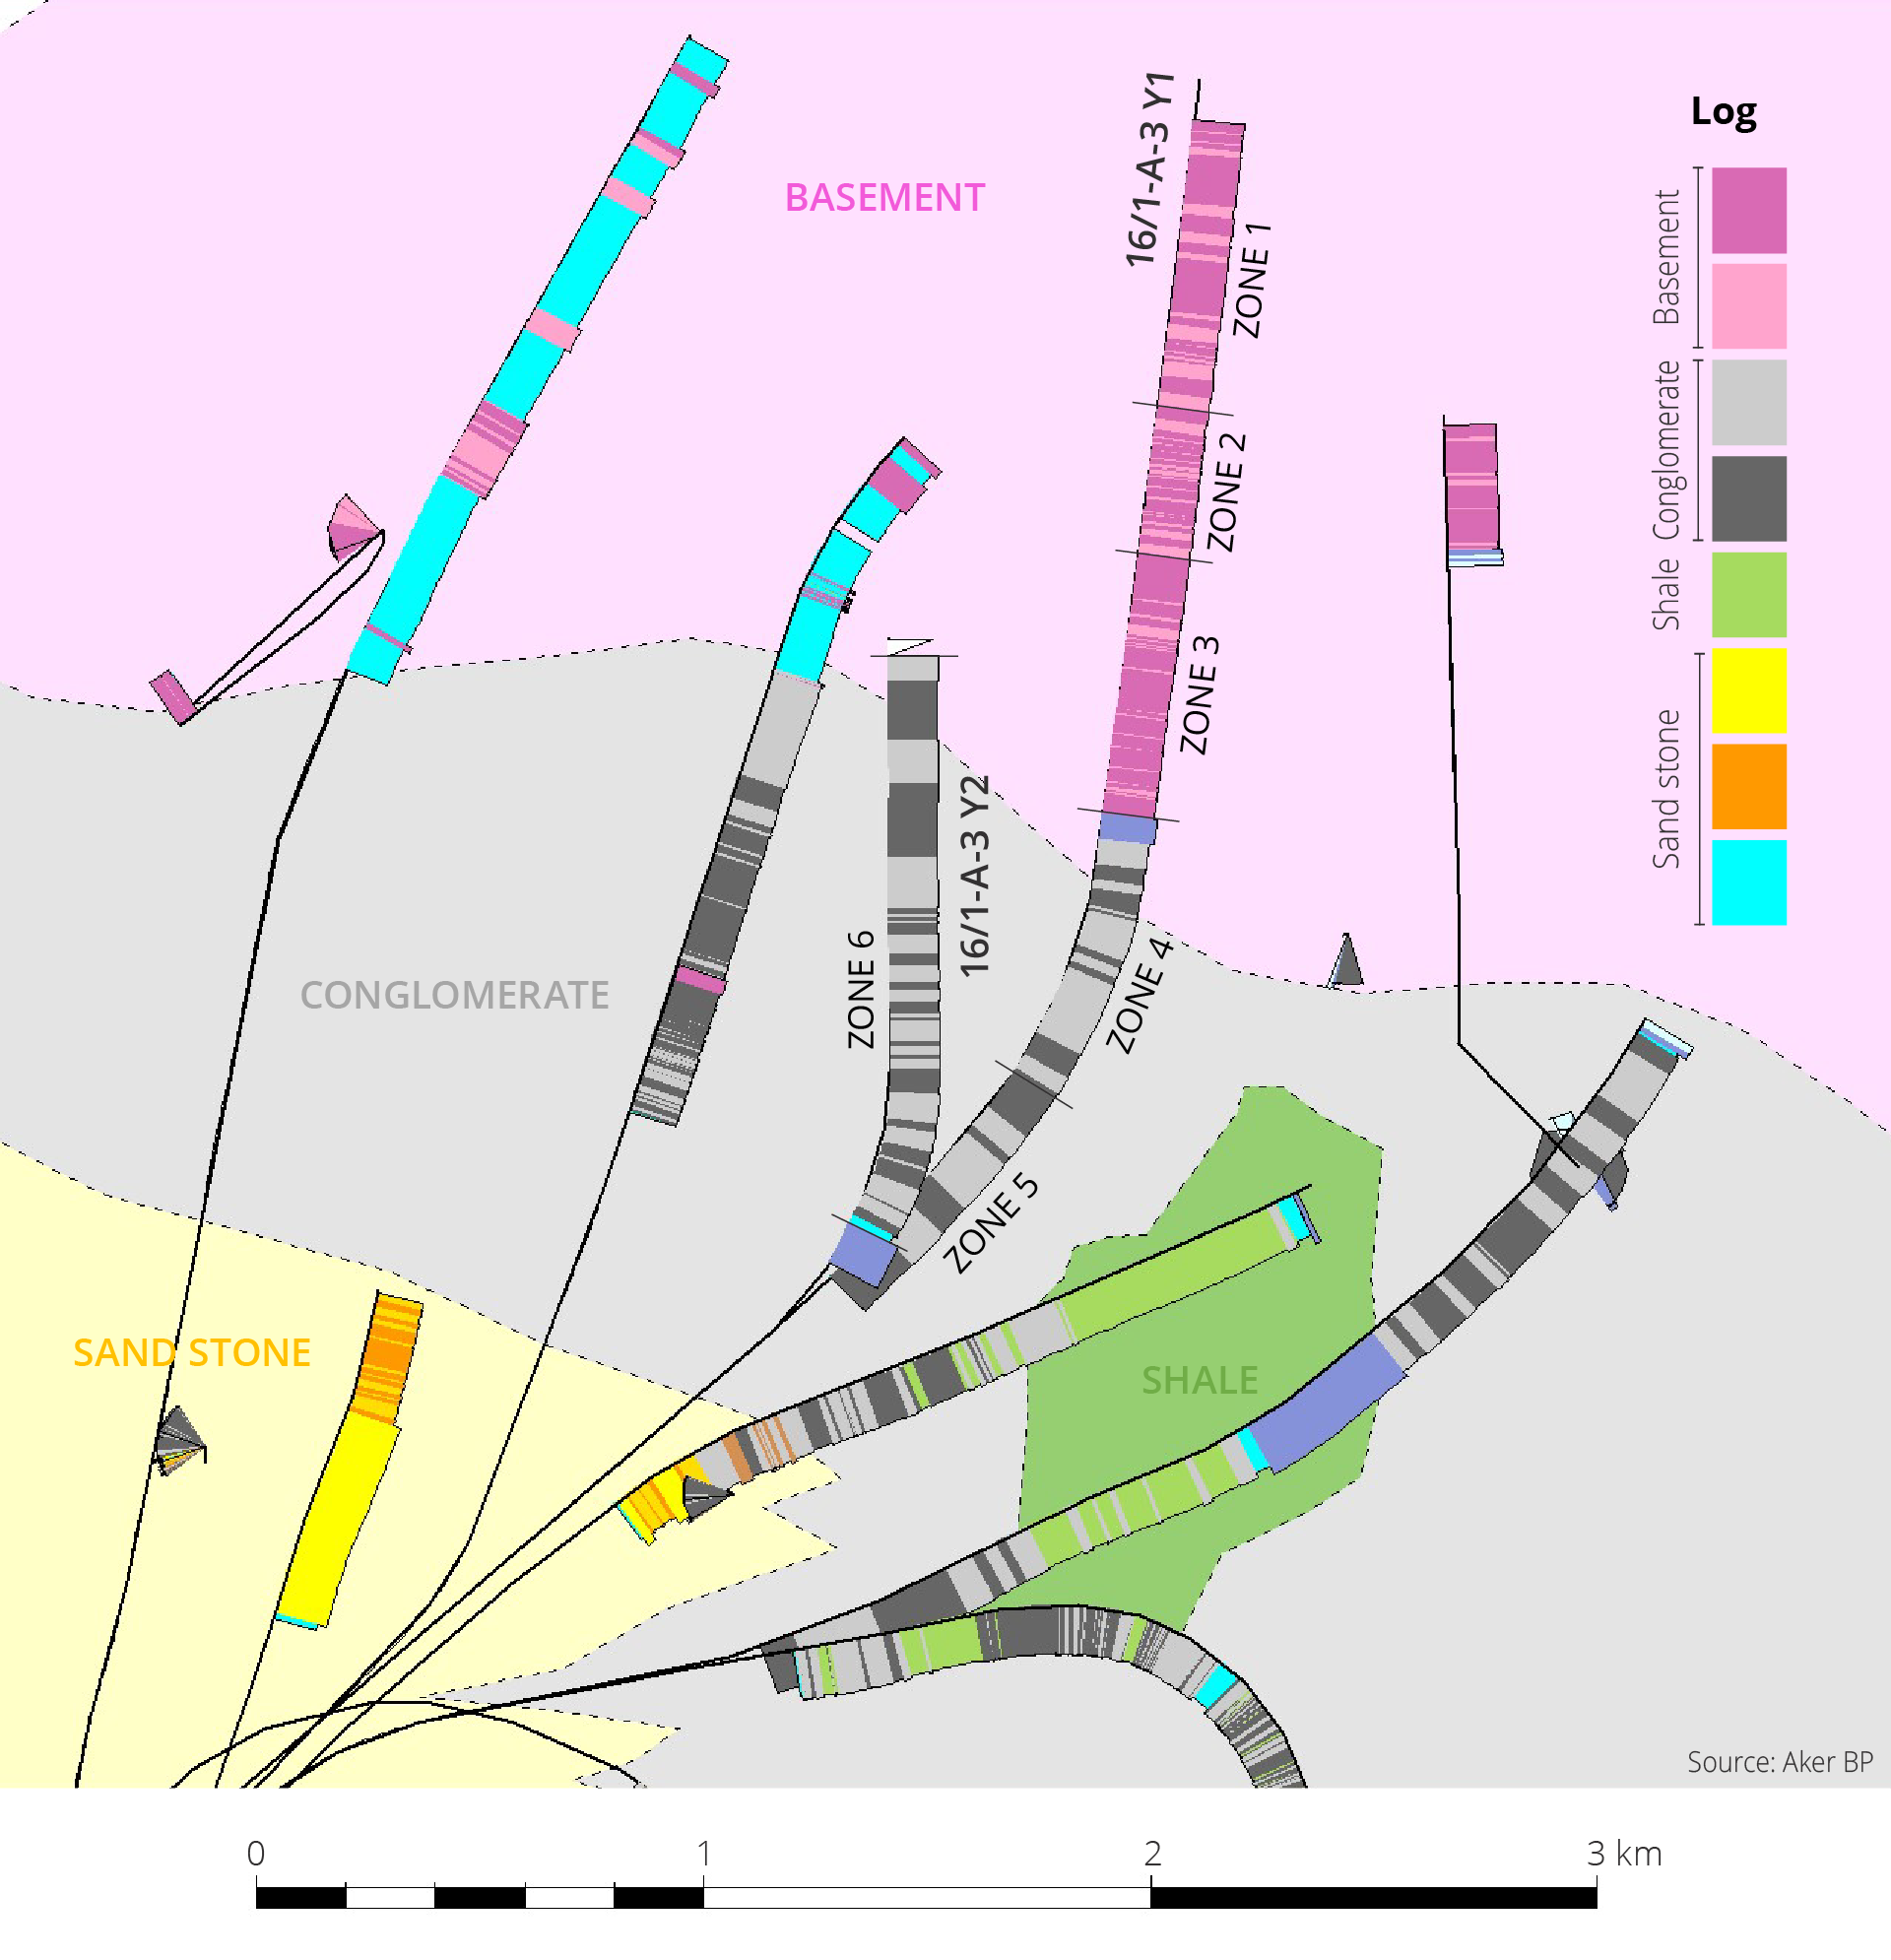
Map section of Edvard Grieg field showing location of the wellbores and division into production zones (figure from Aker BP).
Advanced methods for enhanced oil recovery (EOR)
Most oil fields on the NCS rely on injecting water, gas or a combination thereof to improve recovery. This maintains pressure while also pushing oil through the reservoirs and towards the production wells. Despite these efforts, a substantial volume of oil is left behind, that cannot be recovered using this method as shown in chapter 5, figure 5.7.
Resource report 2019 highlights significant potential associated with EOR and the need for field pilots. The report estimates that around half of the oil left behind after the field is shut down is immobile. More advanced methods than water and gas injection are needed to recover some of this oil.
Water-based EOR – injection of low salinity water on Ekofisk
Many studies and laboratory tests have been conducted, involving various enhanced recovery methods (EOR). Field testing of these methods has nevertheless been limited to date. A test involving injection of low salinity water was initiated in the spring of 2024 on the Ekofisk field in the North Sea.
Laboratory experiments have shown that injection of low salinity water, as compared with injection of seawater, can yield improved oil recovery. The extra oil can be recovered as a result of chemical reactions between the low salinity water and the surface of the rock that can unlock more oil for production. In laboratories, the remaining oil saturation in the reservoir is reduced by four to eight per cent when low salinity water is injected, as compared with seawater.
The pilot on Ekofisk is being conducted in a well that has already injected seawater for years, and where extensive data was collected when it was drilled. Equipment has been installed to remove salt, reverse osmosis, and filters to remove particles. The plan is to start by injecting low salinity water, then drilling a sidetrack around 30 metres from the injection well to collect data, including cores.
Data from the injection well and the sidetrack will be analysed to determine the impact of low salinity water on recovery. Whether or not the pilot can be declared a success depends on both successful technical execution and documentation of improved oil recovery. Results from the Ekofisk pilot are expected to be ready in 2025. Large-scale implementation of the method will be assessed later.
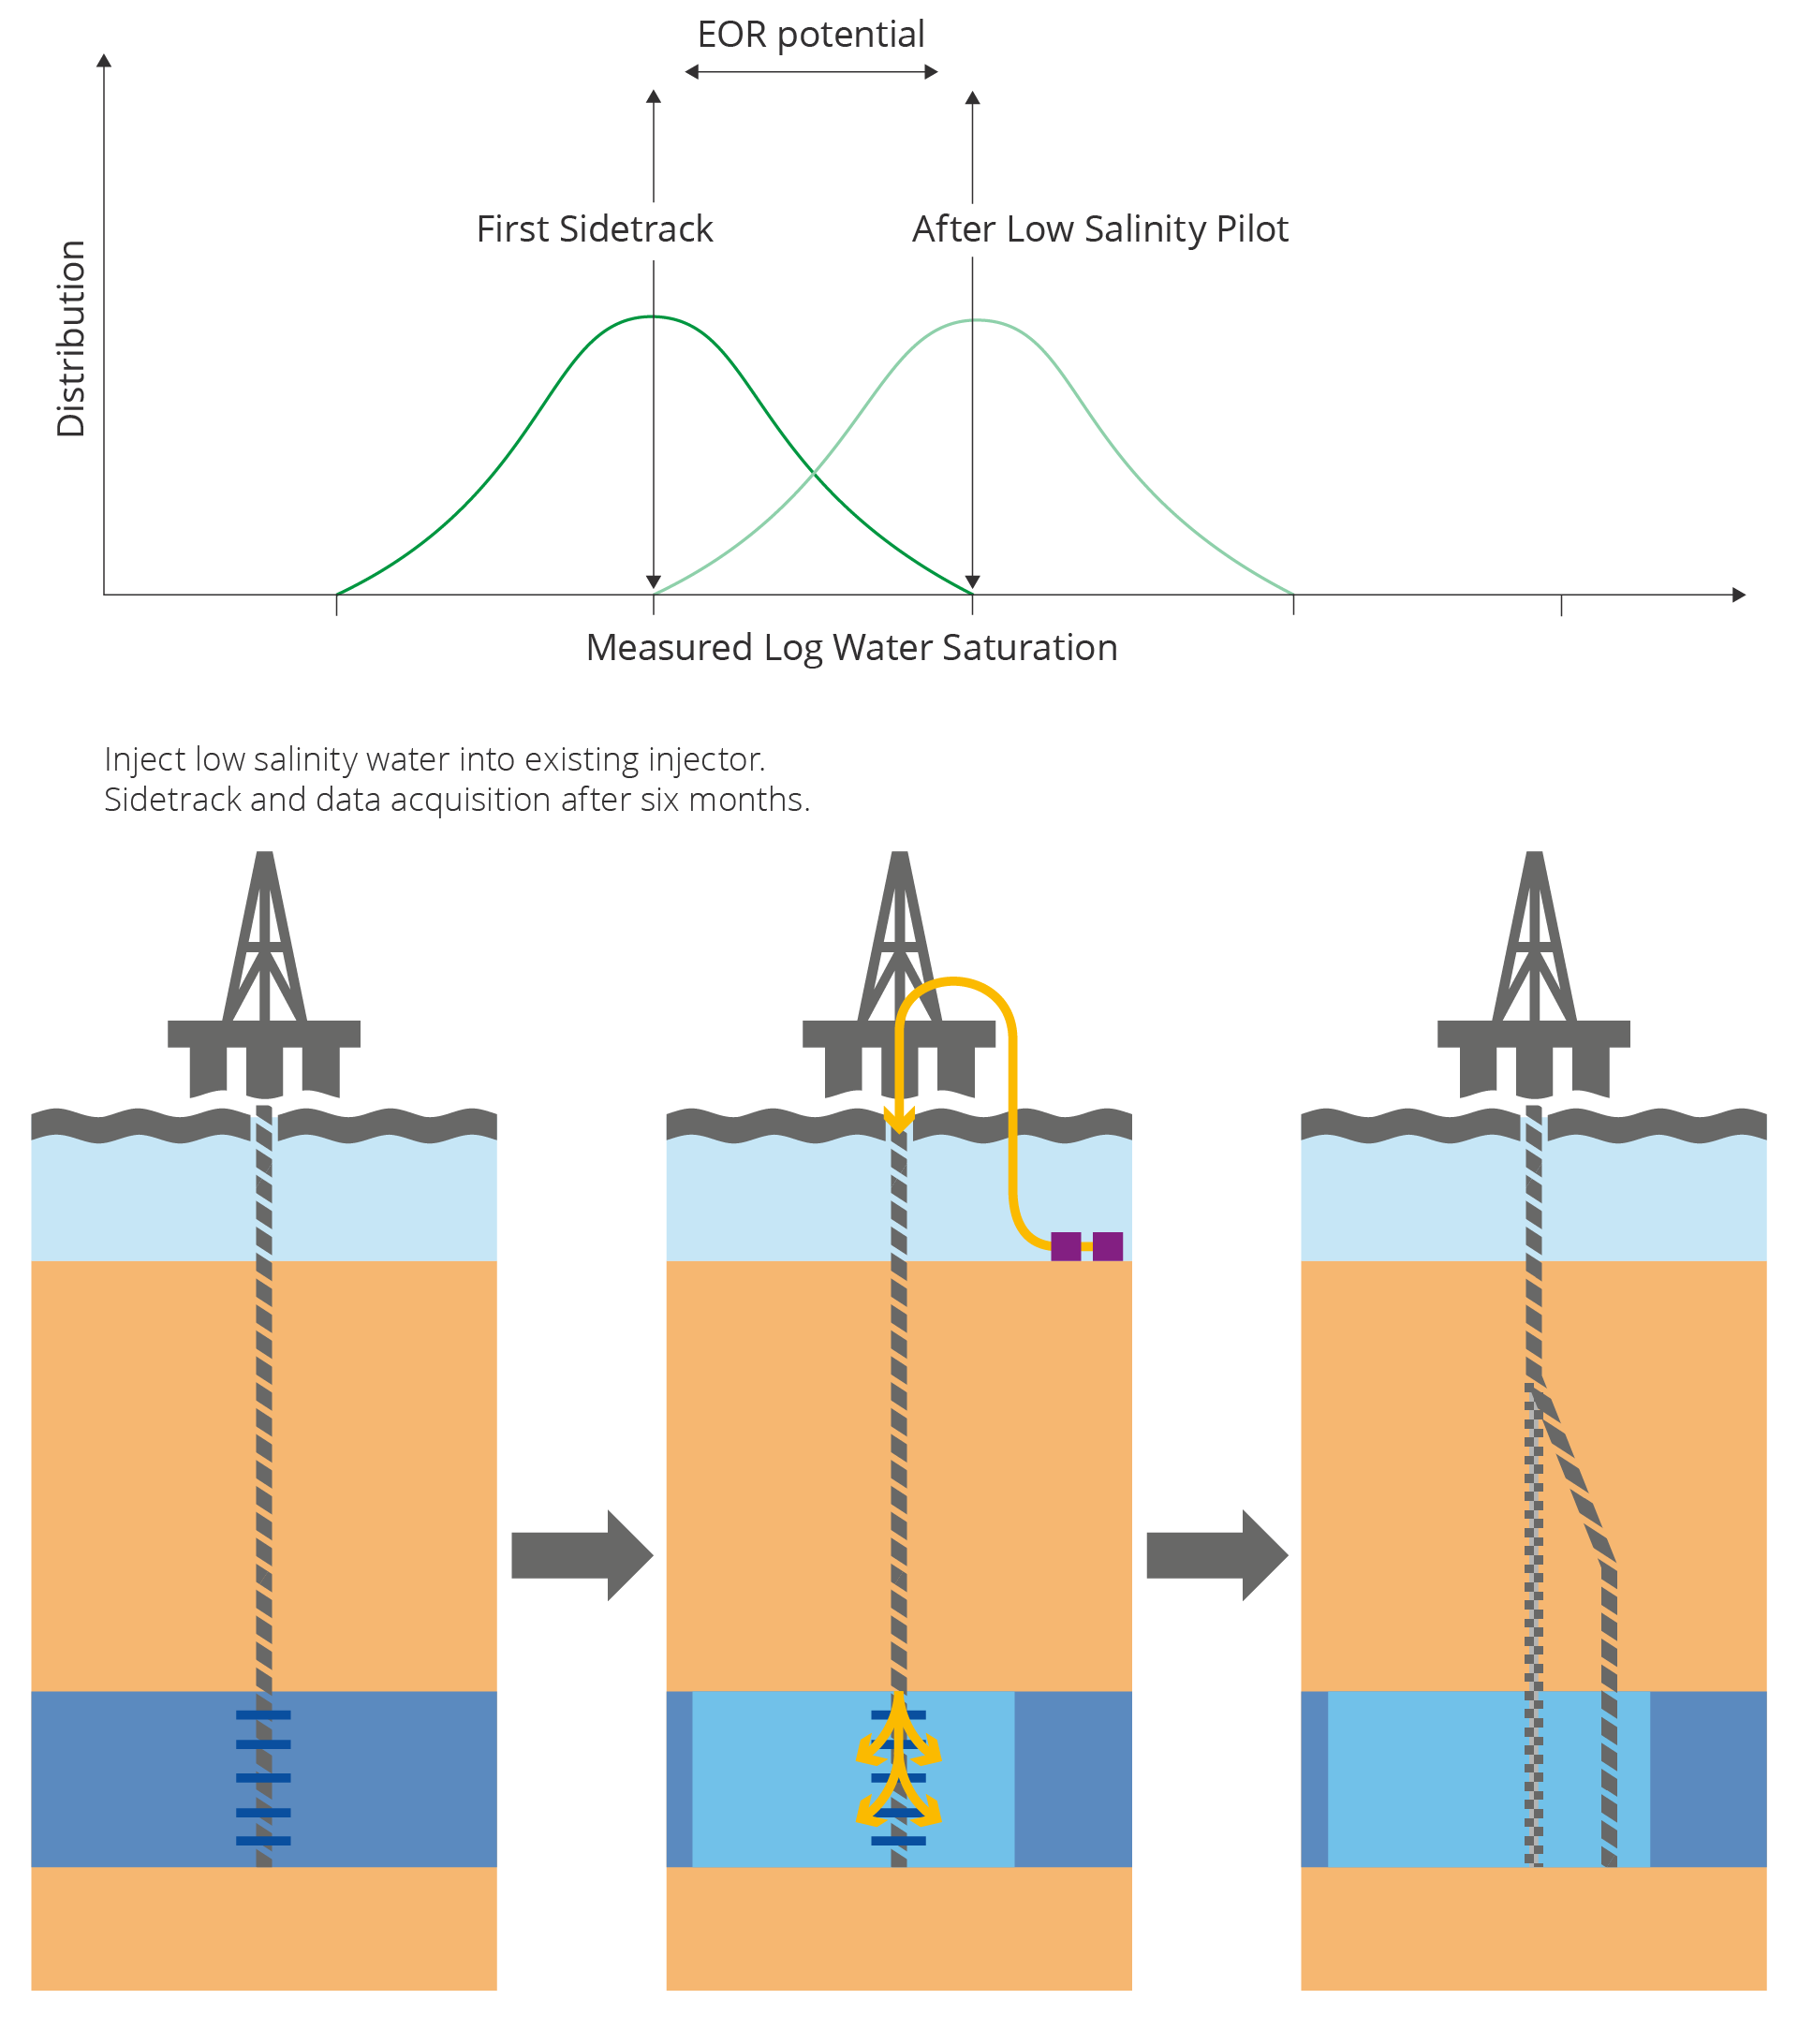
The figure and diagram describe the pilot project on Ekofisk. The plan is to inject low salinity water in an already existing injection well, after which a sidetrack will be drilled 30 metres away from the latter. Data and cores will be collected from the sidetrack. Water saturation will be measured via well logs.
New methods yield better subsurface data
Good imaging of the subsurface is essential in order to identify and describe oil and gas accumulations. This is achieved through geophysical measurement methods where seismic imaging is crucial, while electromagnetic methods and other technology can be valuable supplements.
Good subsurface imaging and the ability to monitor changes over time are important to achieve efficient recovery of hydrocarbons. 4D seismic is carried out to evaluate whether there are changes in the reservoir as a consequence of production or injection over time. Technological development within 4D seismic is contributing to more effective reservoir monitoring, including permanent reservoir monitoring technology.
4D seismic can be carried out in three different ways: Cables with acoustic sensors (and fibre) that are either permanently placed (PRM), temporarily deployed seabed nodes or streamers that are towed through the upper layers of water. During data collection, vessels are used to tow airguns (sound sources) over the area.
The new methods collect data with denser sensor coverage that yields better imaging. The seismic images are available faster thanks to more powerful computing and better processing solutions. In 2024, there were seven fields on the NCS with permanent reservoir monitoring installed, including Grane.
Permanent reservoir monitoring on the Grane field
Permanent reservoir monitoring (PRM) on the Grane field started in 2014. The seismic cables are buried in the seabed at 300-metre intervals and are placed close up to the production platform. One disadvantage of towed cables (streamers) is that they need to maintain a certain distance from installations, which means poorer data coverage in an area around the installations.
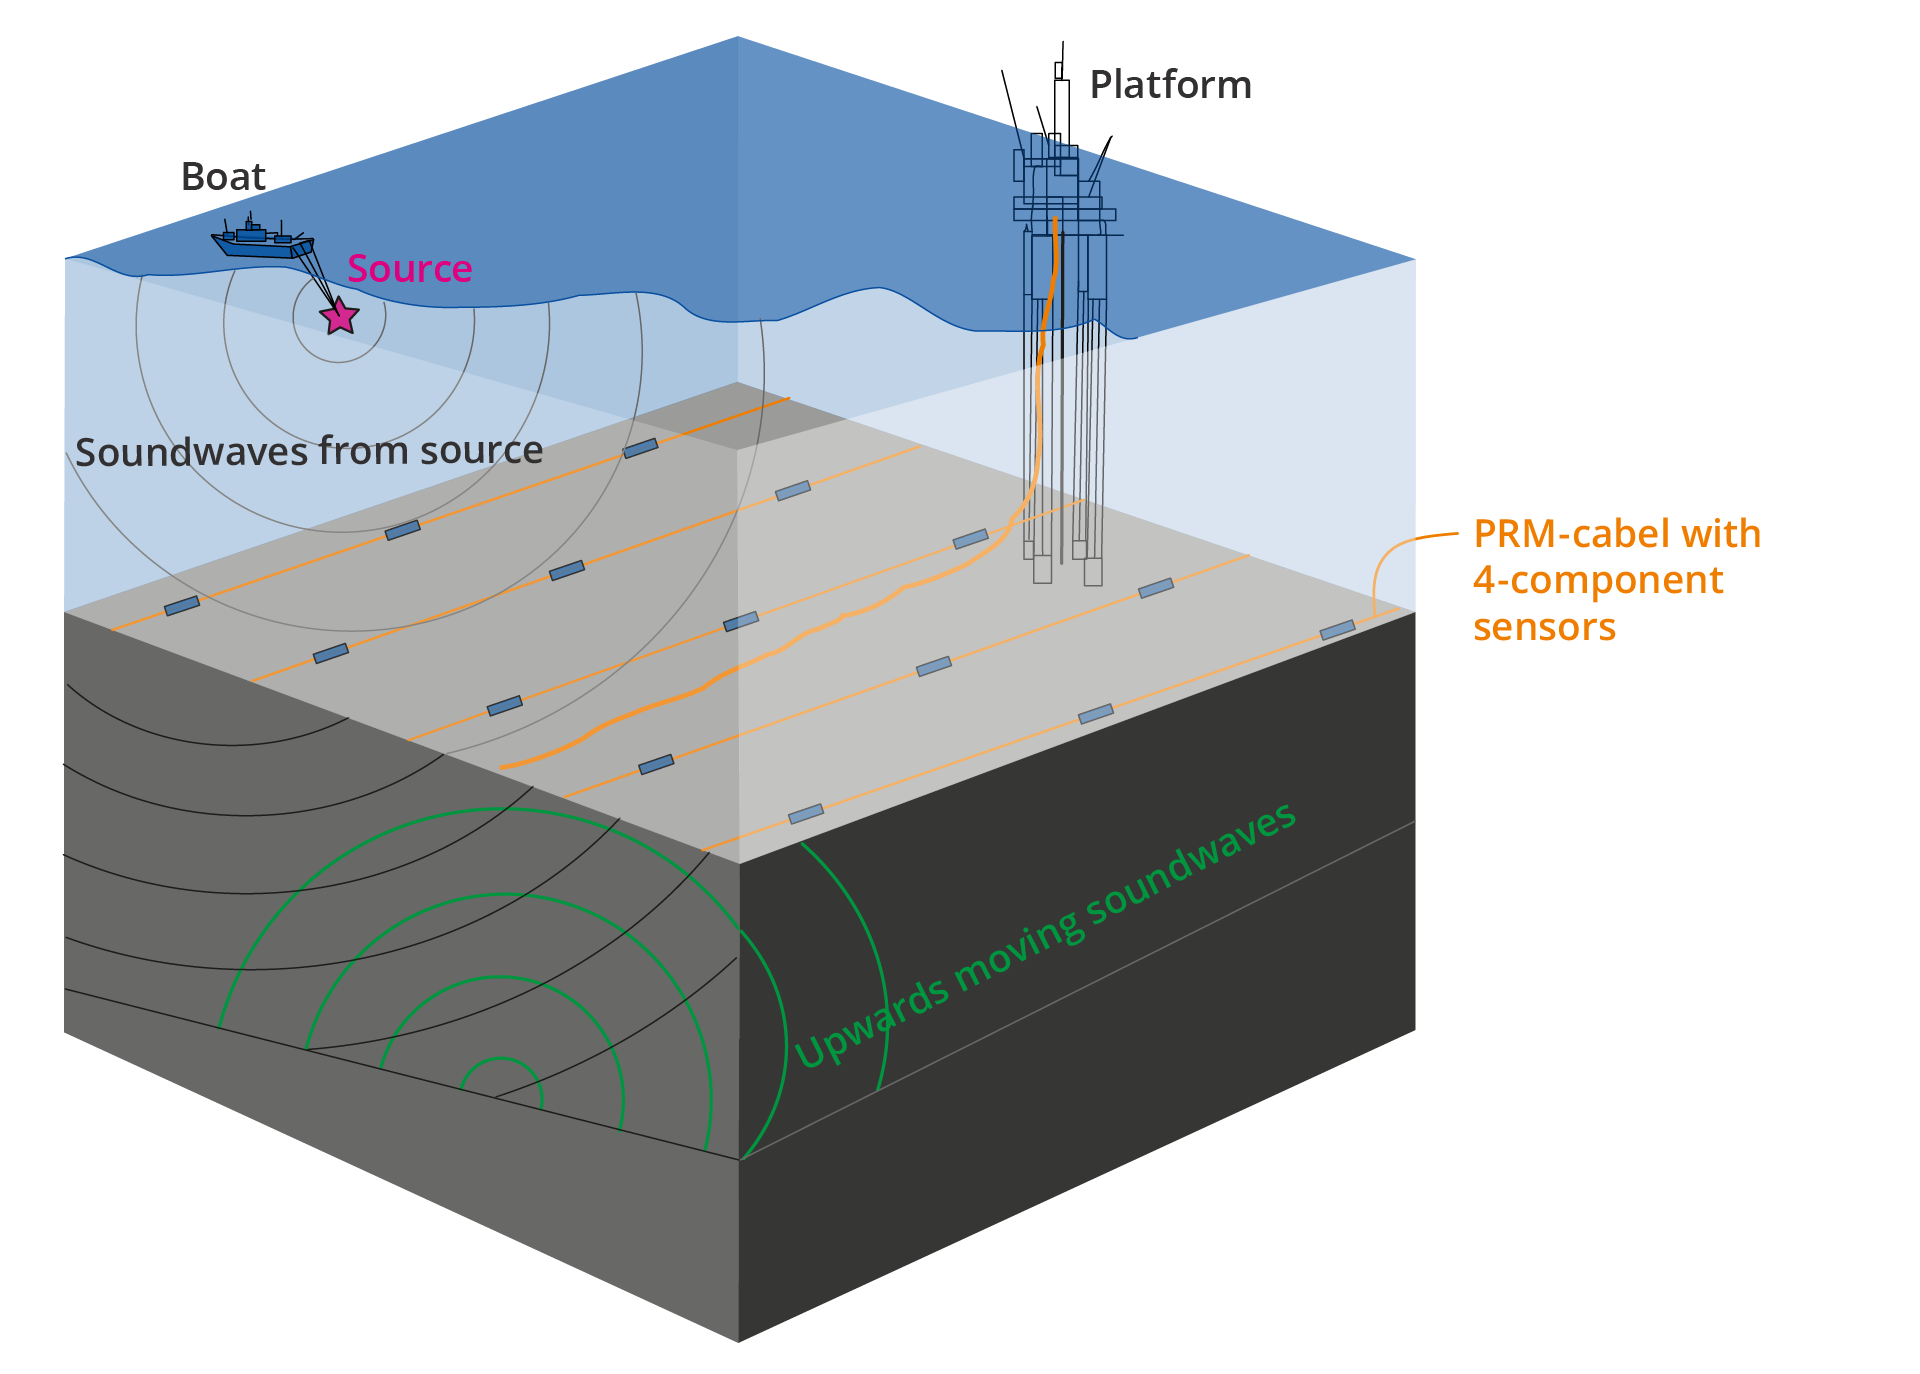
Sketch of the permanent reservoir monitoring setup. The seismic cables with sensors (4C) are buried in the seabed at 300 m intervals between the cables and 50 m intervals between the sensors along the cables. The platform communicates with the seismic cables via a lead-in cable. When seismic is collected, the boat tows a sound source via a pre-determined grid over the area with nodes. The sensors detect reflections from the surfaces in the subsurface reservoir, and forward the signals to the platform.
Next generation production systems
A large number of subsea developments will be phased into existing infrastructure over the next few years. The field developments of the future include unmanned processing installations and subsea developments that require technological development within next generation production systems, including technology for separation, injection, seabed compression and electric underwater systems.
Standardisation of subsea developments by implementing electric vertical Xmas trees (eVXT)
Electrification of Xmas trees has been developed from a long-standing concept to fully developed equipment that is now ready for use in the first field developments. This equipment lowers the threshold for tie-backs to existing fields, as minimal platform modifications are needed to bring the production on board.
Technology
This cutting edge electrical technology reduces infrastructure needs for both subsea installations and platforms. This was achieved by removing the current hybrid solution, which requires both hydraulic and electrical distribution to drive the systems. The technology is based on a fully-electric system, where valves are powered by electric motors/gear systems operated by a control system that uses local batteries as an energy source.
Standardisation
The operators that developed electrically-powered Xmas trees have standardised the technical requirements. The result is an actuation system that can be used on all Xmas tree platforms, regardless of water depth and application.
Project implementation and operation
Fully-electric subsea technology can reduce both development and operating costs, provide increased accessibility, open the door for new operating models and facilitate digitalisation. Implementation of this standard will also result in removing hydraulic systems for operating Xmas tree systems, fewer and planned intervention activities due to higher redundancy and continuous monitoring.
Digitalisation and AI
Incredibly rapid development has also taken place within digitalisation and artificial intelligence (AI). AI can help process seismic data faster, interpret it automatically or analyse enormous volumes of data at super speed. This can be helpful in both analyses and modelling of geological data, further increasing the likelihood of making new discoveries while reducing costs.
The Norwegian Offshore Directorate supports the digitalisation efforts, in part by making it easy to access information and data for all phases of the business. It further delivers facts and expert knowledge to other authorities, the industry and society at large.
Market failure (see chapter 5) could lead to insufficient sharing of data and thus possibly an inability to realise the full value potential that can be achieved by sharing data.
The Directorate’s efforts to collect and make data and information available to the public has given the NCS a competitive advantage compared with many other petroleum producing countries, where access to data is more challenging.
This is also beneficial for the industry at large. A report prepared by Menon Economics(40) on assignment from the Directorate found that licensees and operating companies are achieving annual gains in the order of NOK 1.5 billion through savings in time and resources alone.
Advancements in, and testing of new technology can contribute to more effective utilisation of the extensive database gained from the NCS. The Norwegian Offshore Directorate plays an active role in this work.
AI-Nina
The Norwegian Offshore Directorate has a long-standing desire to explore the potential of artificial intelligence. The technology company Fabriq has developed a pilot that uses the database for relinquishment reports and well results.
AI-Nina was launched in May 2023. This is one of the first solutions targeting the energy industry to use Large Language Models (LLM) to find and use information in documents. AI-Nina uses such an LLM alongside new search technology to get precise answers when users direct questions to this artificial intelligence.
AI-Nina responds to questions in Norwegian or English. The answers are based on the content of the solution’s underlying database. All answers come with references to sources and links to documents containing the origin of the answer. Today, this solution is isolated from other external services such as ChatGPT, which means that the questions asked will remain inside the solution.
The first version of AI-Nina operated with a database containing well data from the Norwegian Offshore Directorate, as well as relinquishment reports. This allows the user to interact with more than 600 relinquishment reports, each of which contains a summary of all the work done in the licence.
A new version of AI-Nina is in the pipeline, with the option of asking more complex questions that cannot be answered with the aid of a single source document. The goal is a solution that can provide users with even more valuable information obtained from unstructured sources.
Significance of digitalised microplankton for both business and academic communities
Equinor has started using "self-supervised learning” on paleontological data to crack the microplankton code. Equinor achieved this with the aid of digital copies of palynology slides the Norwegian Offshore Directorate has made available via the Diskos database(41).
Ever since the first well was drilled on the NCS, the petroleum industry has used microfossils to interpret the age and sedimentary environment of the rocks penetrated by drilling. The Norwegian Offshore Directorate has extensive physical archives of biopolymer-microfossils in the form of more than 100 000 palynology slides. These were produced from samples of drill cuttings and core samples taken from more than one thousand exploration, delineation and development wells.
From the perspective of the companies, there is always a need for new analyses of biostratigraphic data in light of new geological knowledge. This is why the Norwegian Offshore Directorate has lent out parts of its palynology archive to industries and universities since the early 1980s, as part of the Directorate’s mandate to release uninterpreted data.
Sharing palynology slides is a time-consuming and inefficient ways. The Norwegian Offshore Directorate has therefore cooperated with researchers within pathology and cytology, resulting in acquisition of the world’s fastest robot scanner for palynology slides. This was the origin of the Avatara-p project, "Advanced augmented analysis robot for palynology".
Through the Avatara project, the Norwegian Offshore Directorate has realised the world’s first public archive of digital microscope slides for fossil microplankton, pollen and spores. Eventually, it will be possible to download the entire dataset, currently 50,000 slides, from Diskos. With an optical resolution of 4000 pixels per millimetre, access to and analysis of digital microfossils will surpass traditional optical analyses in a few years time.
The significance of the Avatara project for palynological analysis of digital slides is on the rise in Europe. To date, five universities in Northern Europe have started using the digital slides as a basis for teaching palynology as well as research material for master’s and PhD theses. Two operating companies on the NCS and two consultant laboratories have developed machine learning software for electronic analysis and interpretation of the avatar data.
One example is Equinor’s "Scampi" program (Species Classification Automation for Microfossil Photomicrograph Images), which uses artificial intelligence in the form of deep neural networks and content-based image retrieval, to facilitate rapid and reliable identification of microfossils.
Exploration creates enormous value
The Norwegian Offshore Directorate has conducted an analysis of exploration activity over the last 20 years (2004–2023). The study shows that exploration for oil and gas helps create enormous value for the Norwegian society. Exploration activity has been profitable in all parts of the NCS.
All exploration investment from this period has already been offset by the resulting discoveries that have come on stream. They will continue to yield returns as even more fields come on stream. Total net present value from discoveries during this period is estimated at more than three times the initial exploration costs.
Despite fewer major discoveries and lower resource growth in the period from 2014–2023, the study indicates good profitability in this same period. For the last five years in particular, 2019–2023, the value of exploration has increased following good results in areas near existing infrastructure. The analyses also show that, over time, exploration activity is dependent on making major discoveries. Major discoveries provide significant value contributions and are important for establishing new infrastructure in emerging areas, thus making it possible to develop minor discoveries as well.
Method and assumptions
The profitability analysis is based on revenues from discoveries made during the period from 2004 to 2023, excluding all costs. The income base does not include resources in resource class 6, where production is deemed unlikely.
Costs include both exploration that has resulted in discoveries and exploration that has failed to prove resources. The income and cost data are based on historical figures until 2023, while future prices and forecasts are largely based on the 2024 Revised National Budget (RNB).
Revenue and cost flows are discounted to the same year (2024), where a 7 per cent future discount rate has been applied, as well as a 4 per cent historical discount rate (Vista Analyse, historical profitability, 2022(42)).
The profitability analysis shows the direct financial impact of exploration activity. Indirect financial impacts for associated activities and sectors are not included. Indirect impacts are commonly referred to as ripple effects.
Value creation from exploration through extended production on existing fields is not included in the analysis.
Investment in exploration and resource growth
During the period from 2004–2023, around NOK 660 billion were invested in exploration for oil and gas on the NCS, illustrated in Figure 6.1. This has resulted in more than 300 discoveries which in total amount to a resource growth of around 1800 million scm.
Production is considered unlikely for 110 of these discoveries (just over 200 million scm) (resource class 6). In other words, 190 of the discoveries correspond to just under 1600 million scm.
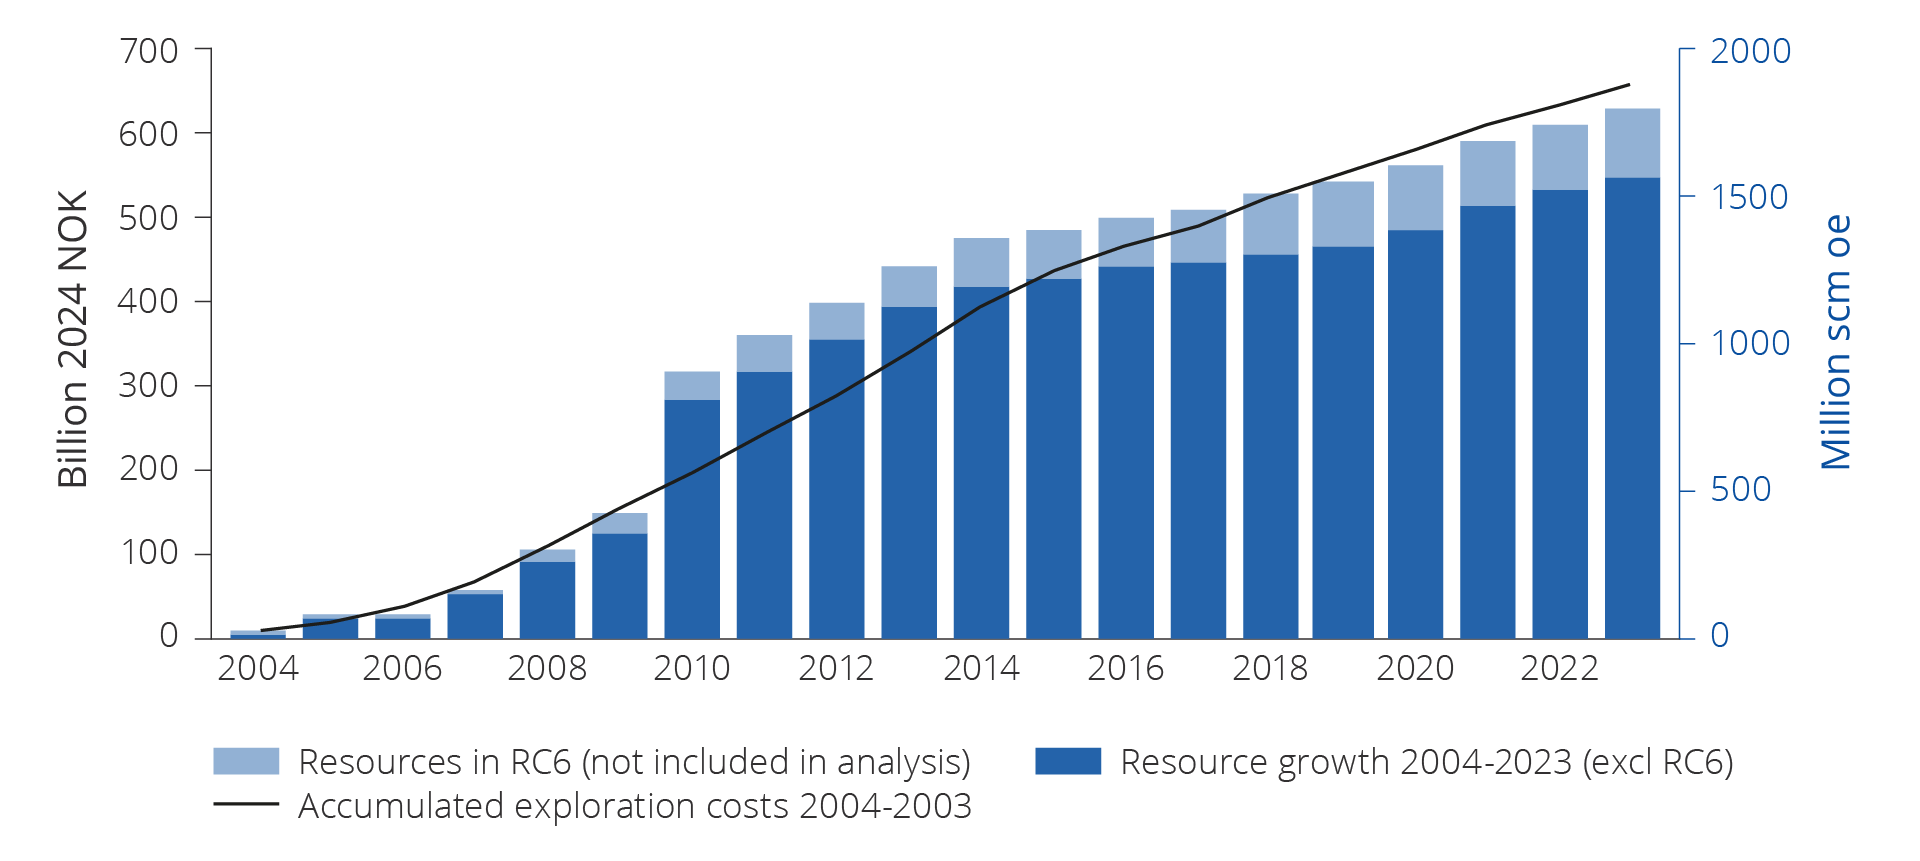
Figure 6.1 Exploration costs and resource growth from 2004 to 2023.
Creating value from exploration
The Norwegian Offshore Directorate has estimated that the total net cash flow for exploration activity in the period from 2004–2023 is around NOK 3800 billion.
Up to 2024, around 50 of the 190 discoveries have been developed and are producing. Revenues from produced volumes to date are higher than all costs incurred, including exploration costs as shown in figure 6.2. About three-quarters of the resources discovered in the period have yet to be produced.
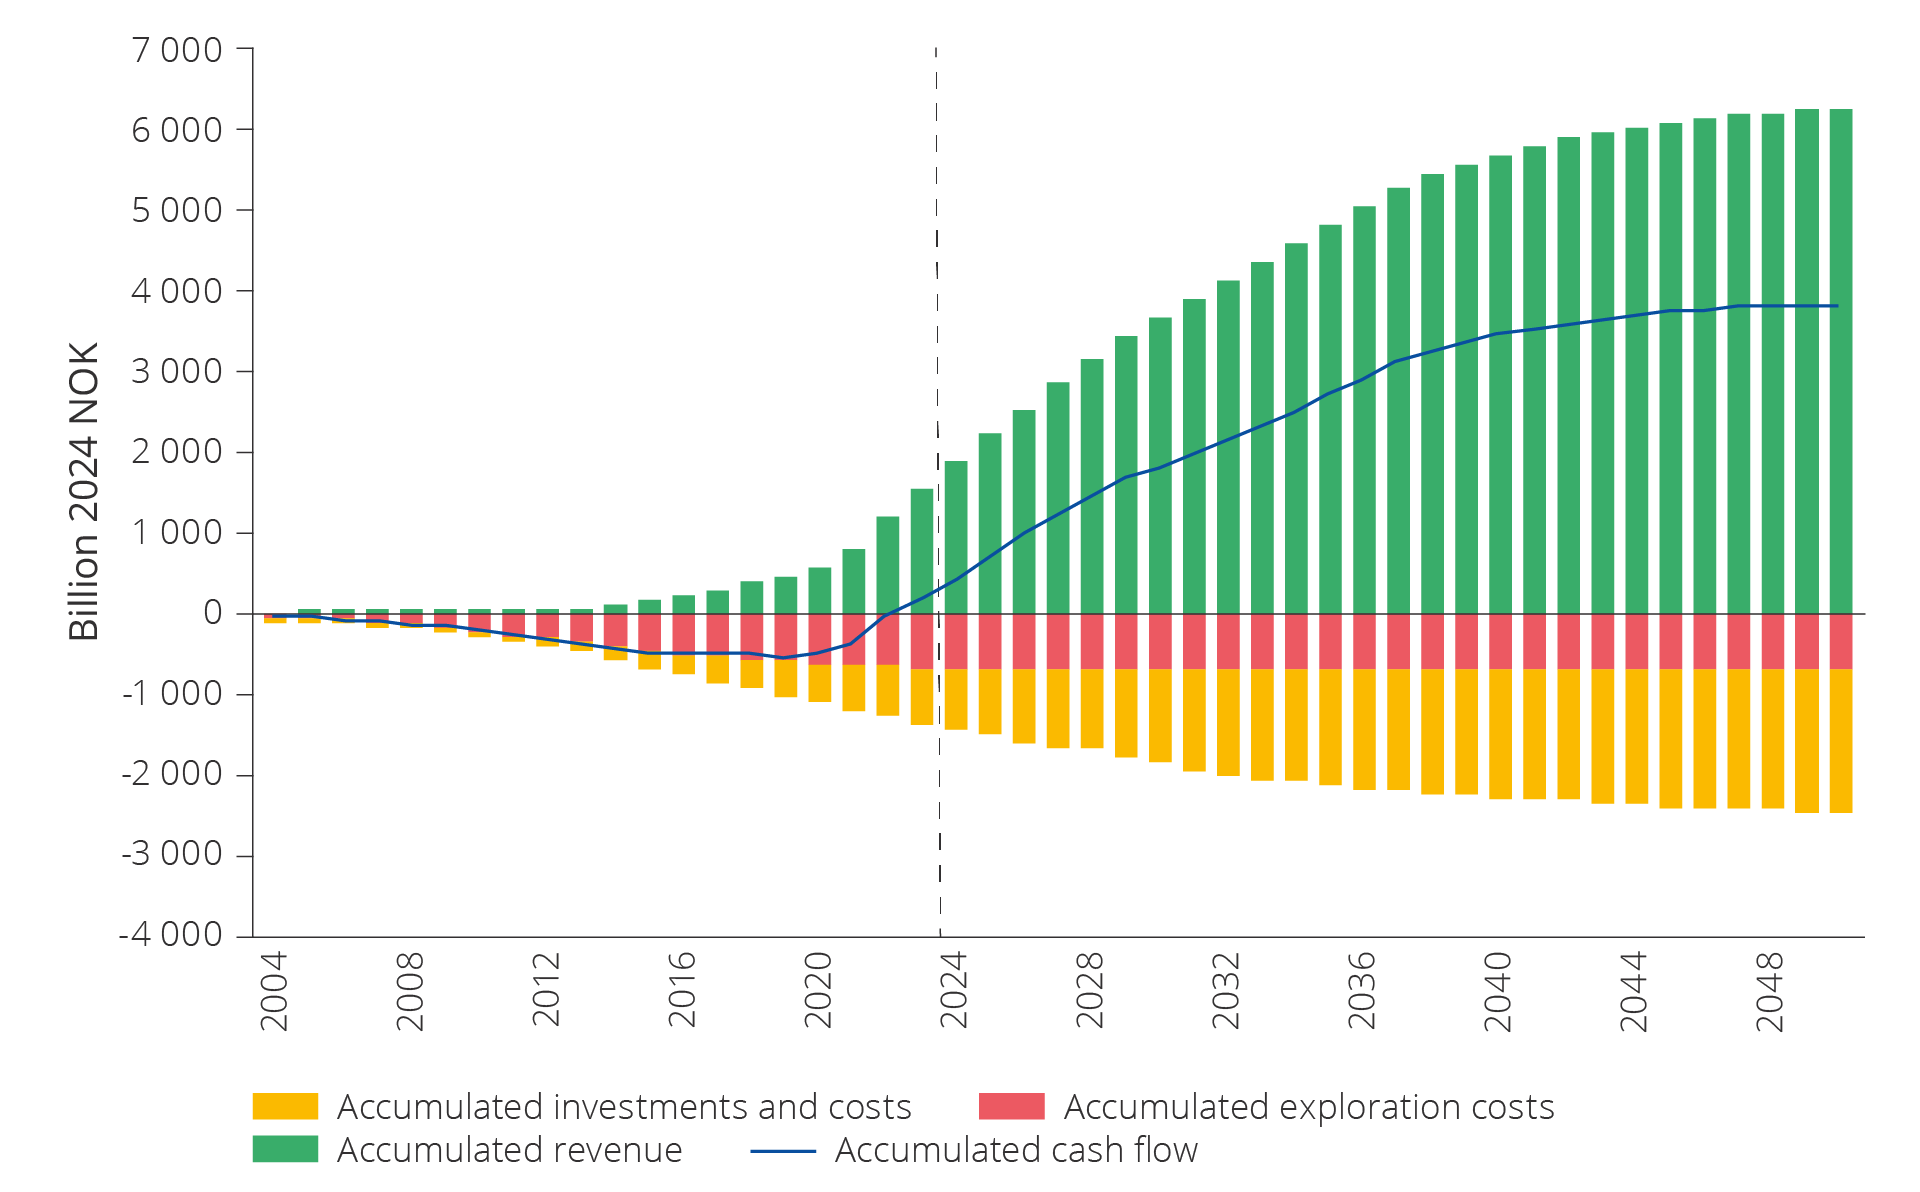
Figure 6.2 Accumulated cash flow up to 2050 from exploration in the last 20 years (2004–2023)
Total investments in development, operation and shutdown in the period from 2004–2050 for discoveries made from 2004–2023 are estimated at around NOK 1900 billion. Total revenues from discoveries during this period are estimated at around NOK 6400 billion.
If exploration costs for the period from 2004–2023 and operating costs for the period from 2004–2050 are deducted, an overall net cashflow of around NOK 3800 billion is realised.
With 7 per cent discount of future cashflow, this yields a net present value of more than NOK 2000 billion as illustrated in figure 6.3.
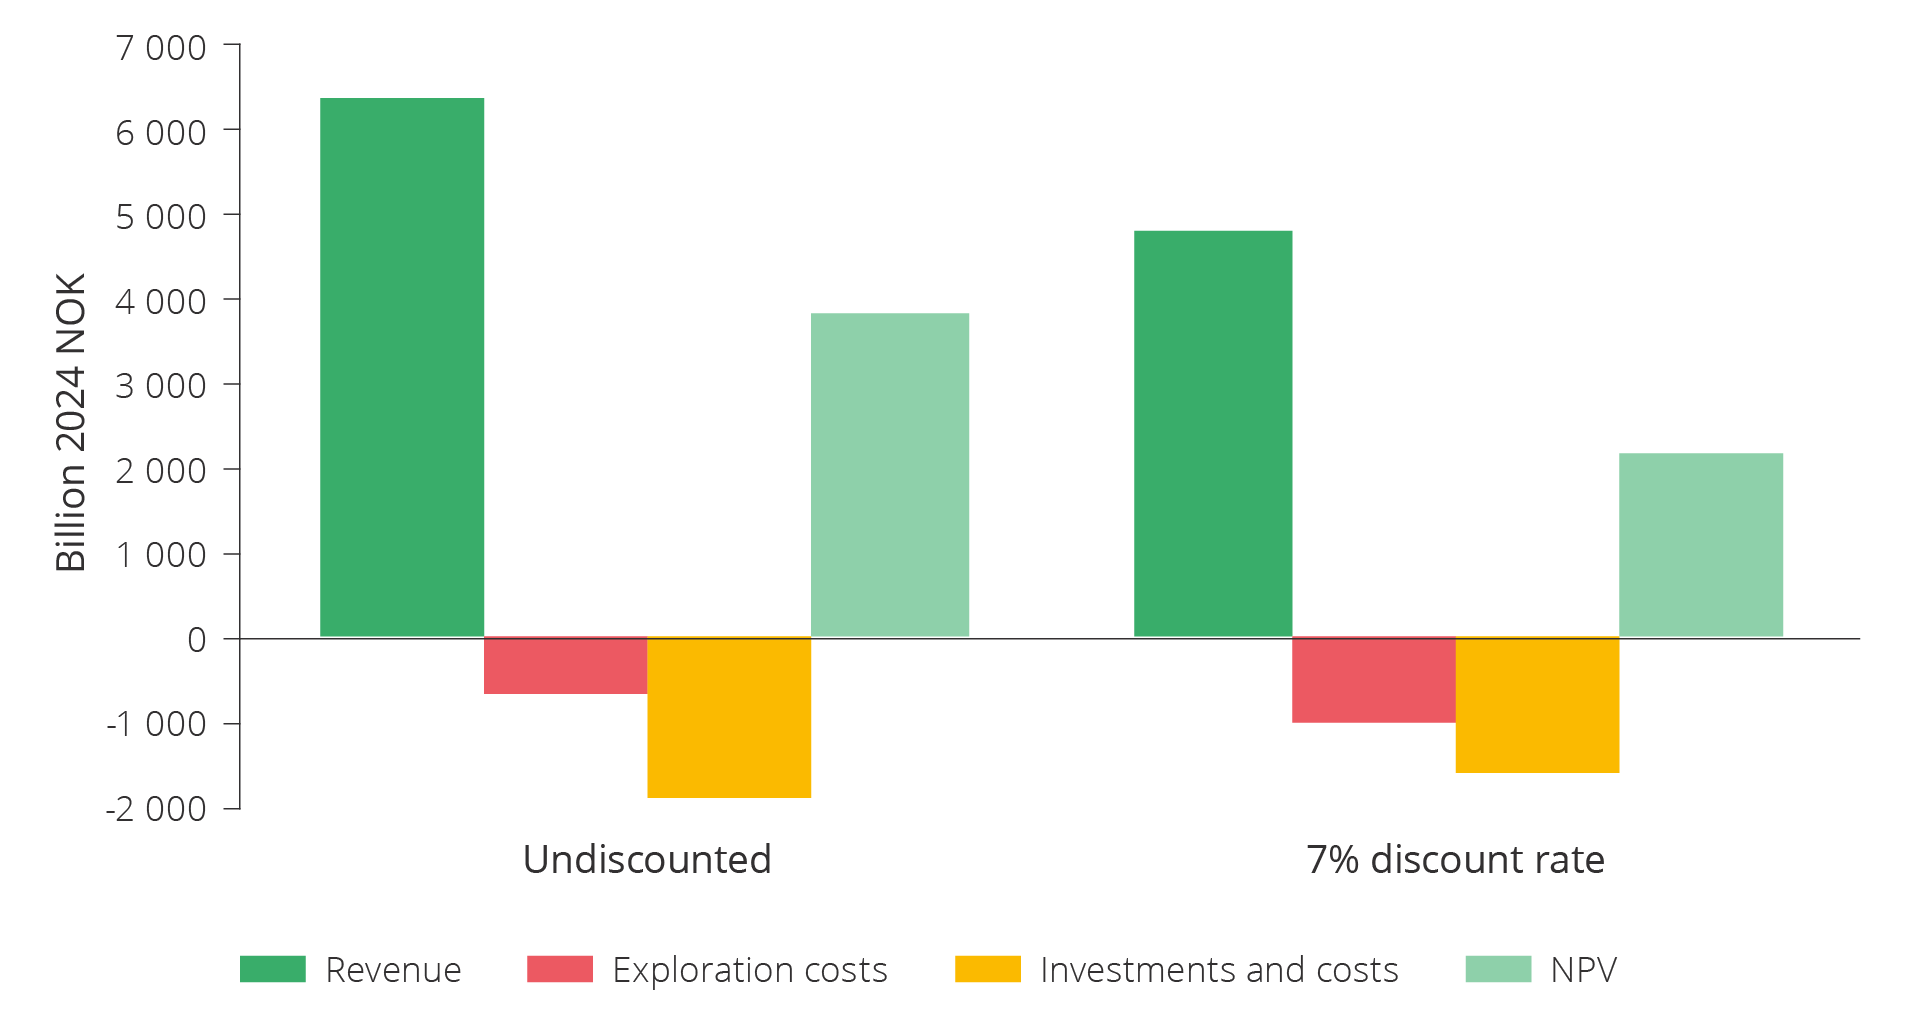
Figure 6.3 Value creation from exploration in the last 20 years (2004–2023).
Profitability per NOK spent on exploration
Exploration has proven to be profitable in all petroleum producing areas along the NCS. Figure 6.4 illustrates profitability per krone spent on exploration for the entire NCS, and for the various areas. Total value from discoveries made on the NCS during the period from 2004–2023 amounts to more than three times the costs spent on exploration during the same period.
The value of discoveries made in the North Sea is more than four times the exploration costs, while the value of discoveries in the Norwegian Sea and the Barents Sea is 1.8 and 1.5 times the exploration costs, respectively.
These are values where all costs have been deducted, including exploration costs, and calculated with a 7 per cent discount rate. If the profitability per krone spent on exploration is 1, this means that exploration investments are repaid with a 7 per cent rate of return.

Figure 6.4 Profitability per NOK spent on exploration in the various regions over the last 20 years (2004–2023).
The North Sea has seen high resource growth, and several major discoveries have been made. With economies of scale, well-developed infrastructure and low unit costs, this yields high profitability per krone spent on exploration.
The resource growth has been lower in the Norwegian Sea, fewer major discoveries have been made. The analyses nevertheless show that coordinated developments of multiple minor discoveries and cost-effective phase-ins have contributed to good profitability per krone spent on exploration also in the Norwegian Sea.
In the Barents Sea, exploration has led to high resource growth and several major discoveries, but considerable investments have also been made to establish new infrastructure in the area.
Unit costs
Total costs from exploration, development, operation and shutdown per producible unit from discoveries during this period yields an average undiscounted unit cost of about USD 25 per barrel.
Unit costs vary from project to project and depend, among other things, on discovery size, reservoir quality, development concept and distance to infrastructure.
The North Sea has the lowest unit costs at about USD 22 per barrel, while the Barents Sea has the highest at about USD 35 per barrel. Unit costs are about USD 28 per barrel in the Norwegian Sea.
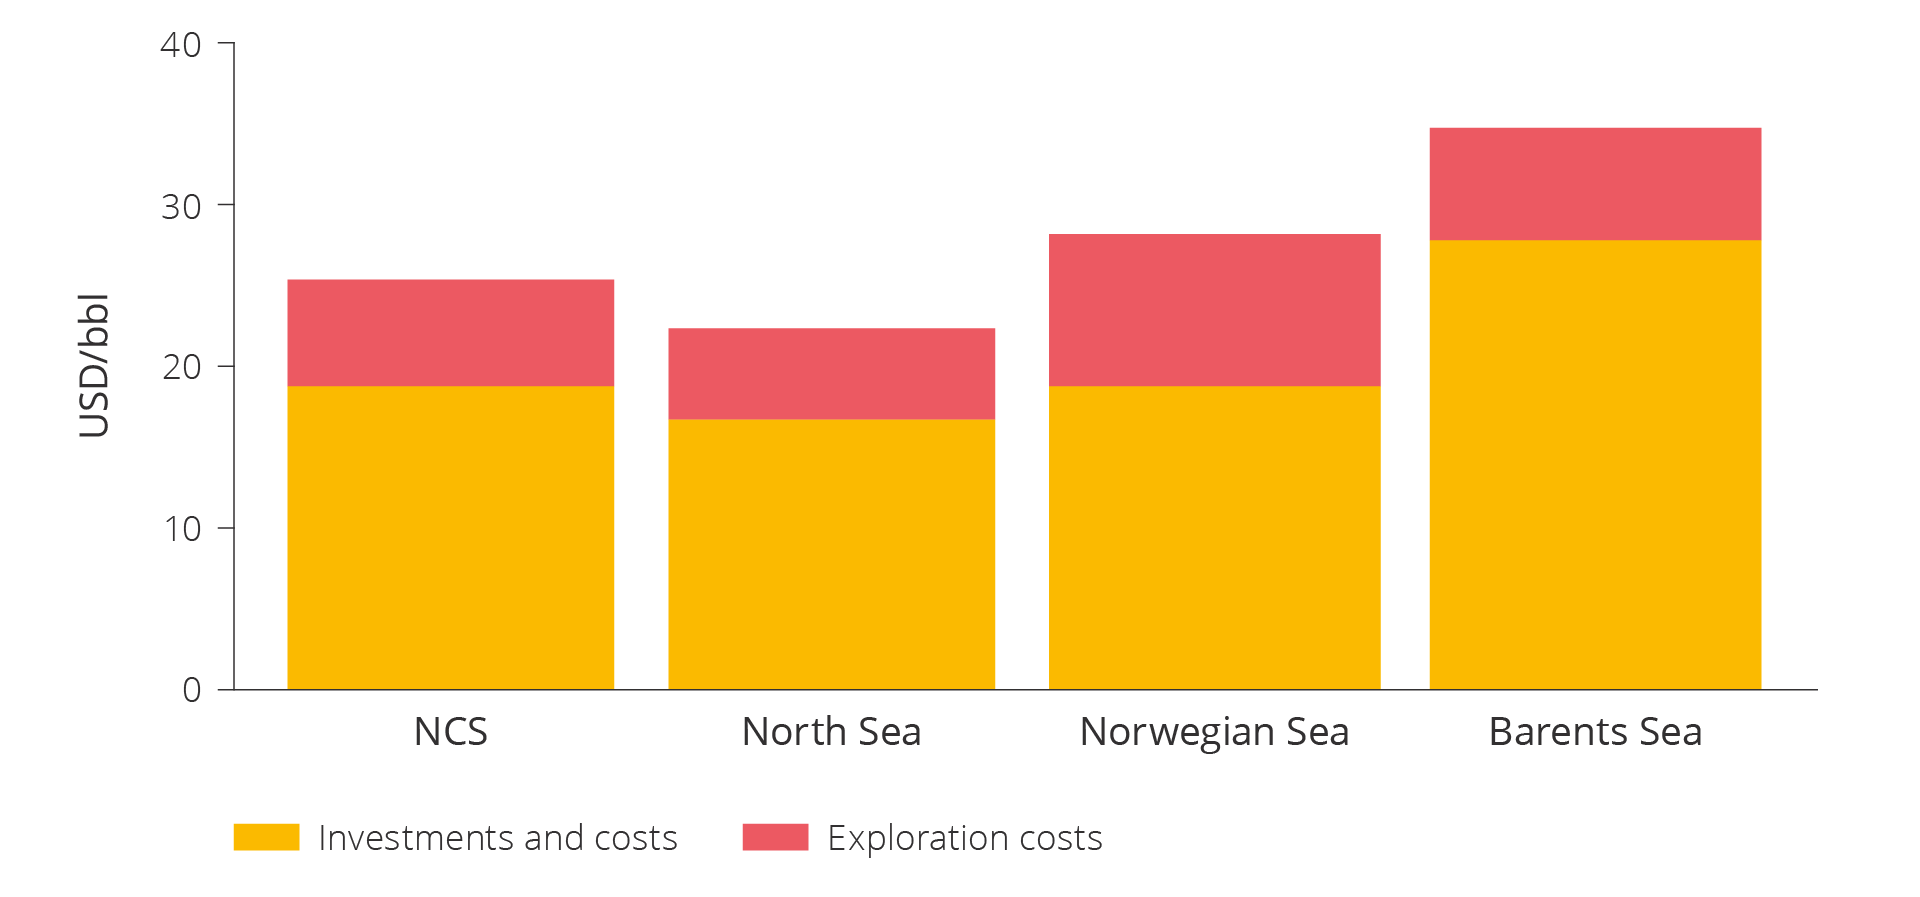
This figure shows unit costs for exploration, development, operation and shutdown for discoveries 2004–2023 per region.
Significance of major and minor discoveries
A total of 9 discoveries have been made that are exceeding 20 million scm oe. In total, these discoveries account for close to 60 per cent of the present value contribution from exploration during this period as highlighted in figure 6.5. In addition to providing significant value contributions, several of these discoveries are important for developing infrastructure and for other discoveries in the surrounding areas.
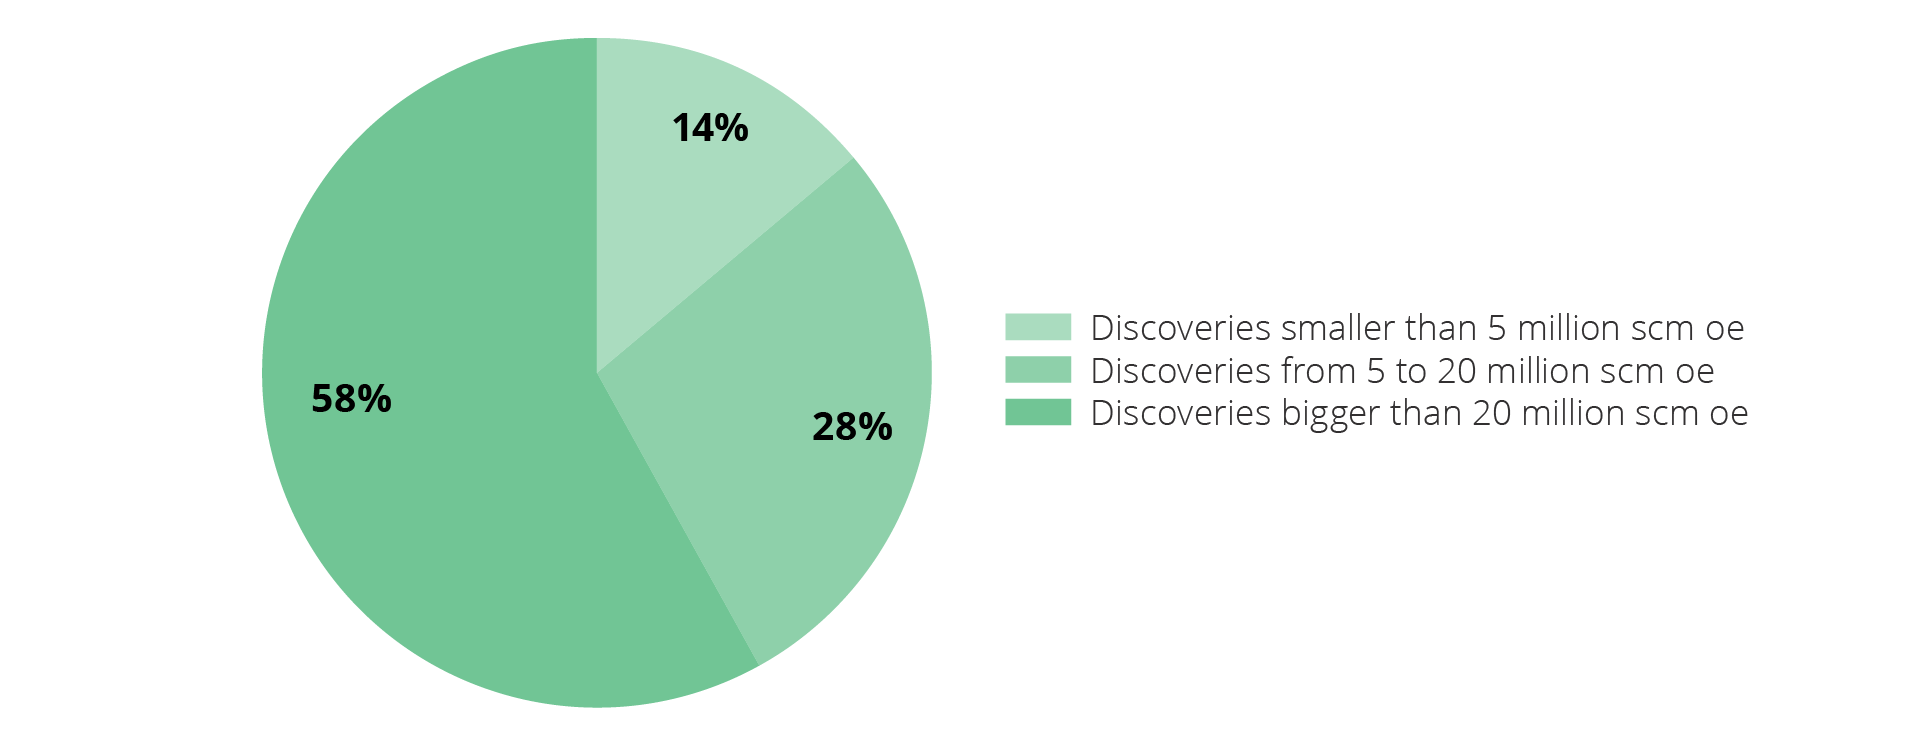
Figure 6.5 Present value contribution from different discovery sizes.
The other 181 discoveries are smaller than 20 million scm oe and constitute a total of more than 40 per cent of the present value contribution. Despite more than 110 of them being less than 5 million scm oe, they account for 14 per cent of the present value contribution.
Figure 6.6 compares present value contributions for different discovery sizes across the NCS. Discoveries larger than 20 million scm oe are very important for profitability, both in the North Sea and the Barents Sea, and account for about two-thirds of the present value from these areas. In the Norwegian Sea, discoveries smaller than 20 million scm oe account for more than two-thirds of the present value creation.
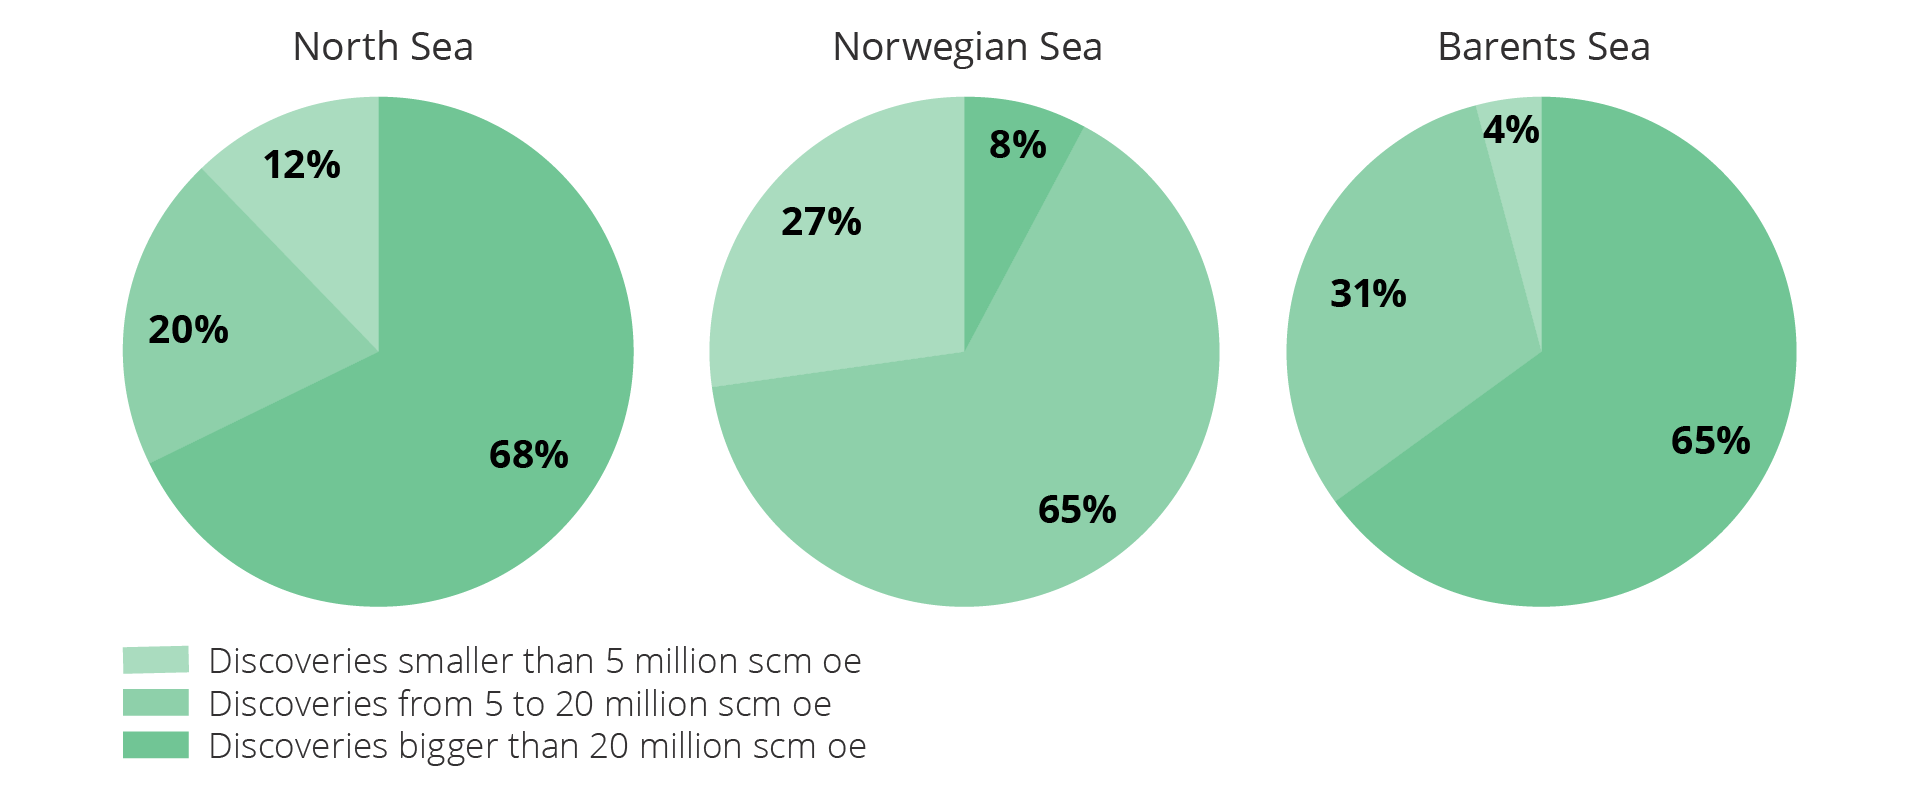
Figure 6.6 Present value contribution from different discovery sizes per region during the 2004–2023 period.
Very profitable exploration over the last five years
Figure 6.7 shows profitability per krone spent on exploration for the entire NCS from discoveries made during the period from 2014–2023 and between 2019–2023 (the last ten and five years).
The value of the discoveries made over the last ten years, is about 1.3 times higher than the exploration costs. About 100 discoveries have been made during this period with an average discovery size of less than 5 million scm oe.
Over the last five years, the value of discoveries is more than twice the exploration costs. This means that the profitability in exploration has been higher over the last five years than the last ten.
Several of the discoveries over the last five years are highly profitable because they can be phased into existing infrastructure in a timely manner. Discoveries in the Troll area are particularly good examples of this.
Phasing new resources into existing fields can also lead to longer lifetimes for the infrastructure and increase the value of tail-end production. This effect is not included in the profitability analyses.

Figure 6.7 Development in profitability per NOK spent on exploration over the last ten (2014–2023) and last five years (2019–2023).
Gas infrastructure is important for extracting value from remaining resources
It is important to explore for more gas in order to maintain gas production and exports over the long term. Nearly two-thirds of the undiscovered gas resources are expected to be located in the Barents Sea. Significant gas resources and values could be stranded without increased export capacity from this petroleum province.
The Norwegian gas transport system
The Norwegian gas transport system consists of a network of more than 8000 kilometres of pipelines, three large process facilities in Norway and multiple receiving facilities in other countries. Figure 4.8. shows gas from the Snøhvit field is exported using ships from the LNG plant on Melkøya outside Hammerfest.
The North Sea and Norwegian Sea have well-developed gas infrastructure and export capacity, and there is expected to be available capacity moving forward. This lowers the threshold for exploring for and developing gas discoveries. Available capacity also increases the companies' interest in exploration for smaller gas accumulations if unit costs and tariffs in the infrastructure are kept low.
The system has high regularity and provides significant flexibility for users in choosing landing points for gas. In addition to market proximity, this means low transport costs and in return represents a major competitive advantage for Norwegian gas.
The authorities regulate access to the system and ensure that access to capacity is available for anyone who needs it, on reasonable terms. Gassco is the operator and is assigned the roles of neutral capacity administrator and architect for further system developments Gassco's role as architect covers all relevant export solutions for gas. The Norwegian Offshore Directorate assists Gassco in its role as architect and helps ensure the development of good, long-term gas infrastructure solutions.
Large parts of the licences in Gassled have licence periods that expire in 2028, and the state has the right of reversion when the licence periods expire. Some plants do not have explicit licence periods. The state aims to exercise its right of reversion when the licence periods expire and ensure 100 percent state ownership of key parts of the Norwegian gas transport system.
When the takeover potentially requires remuneration, the Ministry presumes that such remuneration will be based on the owners' expected future net income. Transitioning to 100 percent state ownership is presumed to be value-neutral for the state. This means that the state's ownership costs for the system will be covered in their entirety by future tariff revenues.
The aim is to continue the fundamental characteristics of how the system is regulated beyond 2028. Gassco is presumed to remain the operator. The tariffs will be cost-based. Any investments in new gas infrastructure will still be driven by the commercial players and their need for gas transport.
Gassled
Gassled was established on 1 January 2003, when the majority of transport systems were merged into a new, large joint venture.
Gassled consists of the onshore plants at Kårstø and Kollsnes, as well as the pipeline systems that connect producing fields in the North Sea and parts of the Norwegian Sea to these facilities and/or further transport to the United Kingdom and mainland Europe.
As of May 2024, Gassled's ownership configuration is as follows: Petoro AS (46.697 percent), CapeOmega (26.322 percent), Hav Energy NCS Gas AS (15.553 percent), Silex Gas Norway AS (6.428 percent) and Equinor Energy AS (5.000 percent).
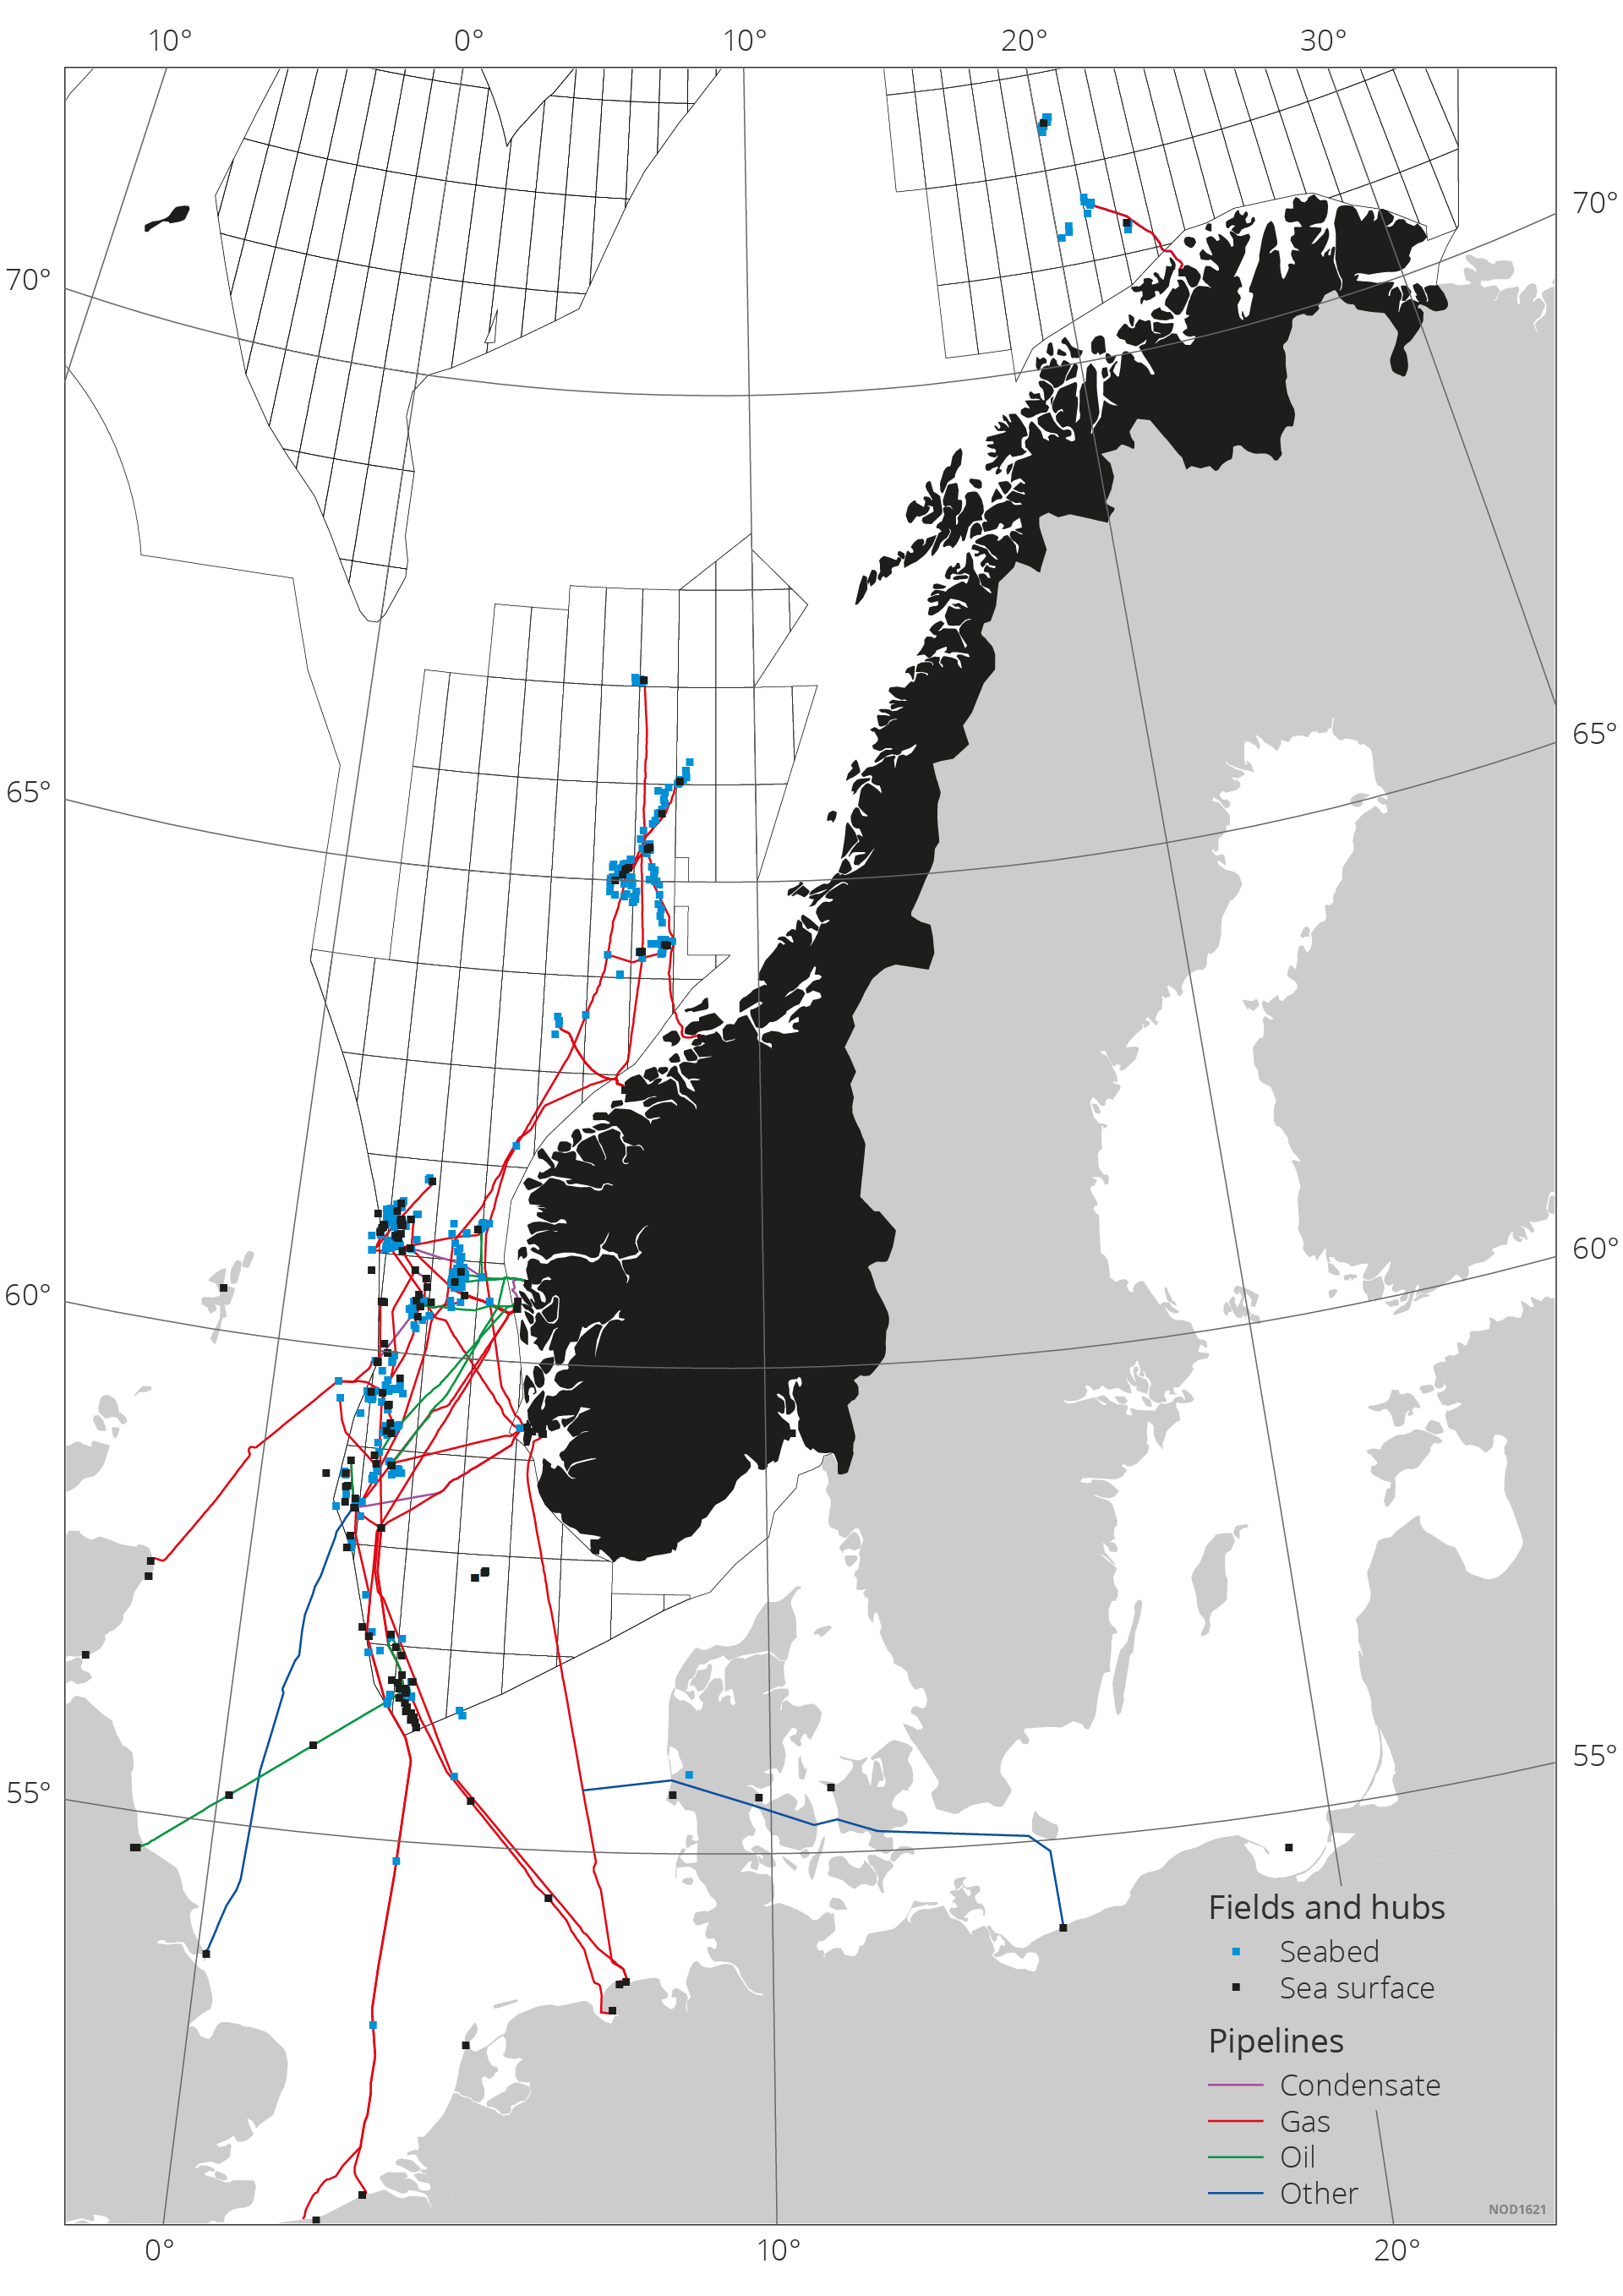
Figure 6.8 The figure shows transport systems (pipelines) and receiving facilities in the United Kingdom, Netherlands, Germany, Denmark and Poland. There are no pipelines between the Norwegian Sea and Barents Sea.
Limited gas export capacity in the Barents Sea
Gas export capacity in the Barents Sea is limited to the LNG plant on Melkøya outside Hammerfest. The plant is fully booked with production from the Snøhvit field until about 2040.
There are multiple fields and discoveries in the Barents Sea in need of gas offtake. The development of already proven oil and gas resources is dependent on building more infrastructure both within and leading out of the area. Greater export capacity will also provide incentives for gas exploration. At the same time, a prerequisite for new infrastructure is often that more resources need to be discovered (see network effects under market failure in chapter 5).
Gassco and the Norwegian Offshore Directorate have conducted analyses over multiple years of whether or not there is a socio-economic basis for increased gas export capacity from the Barents Sea.
Earlier studies on the basis for increased export capacity from the Barents Sea
In 2012, Gassco published the study "NCS 2020", in which one of the observations was that there was a basis for a pipeline solution from the High North. It was pointed out that a potential pipeline from the Barents Sea should have relatively high capacity in order to facilitate potential future volumes and thereby create a basis for further developing the High North as a petroleum province(43).
In 2014, Gassco published the study "Barents Sea Gas Infrastructure", which pointed out that resources in the Barents Sea could play a key role in maintaining Norwegian gas production beyond the 2020s. One prerequisite for success was cooperation across production licences in the area, as no individual production licences were able to bear considerable new gas infrastructure investments on their own(44).
In 2020, Gassco published a new study in cooperation with the Norwegian Offshore Directorate assessing potential new gas transport alternatives from the Barents Sea(45). The report pointed out that it could be socio-economically profitable to invest in new gas export capacity. The study also pointed out that a socio-economically profitable increase in gas transport capacity from the Barents Sea could be a key factor in further developing the region as a petroleum province. This would make it possible to maintain Norwegian oil and gas production at a higher level into the future.
In 2023, the Ministry of Energy asked Gassco to update the study from 2020 and reassess alternatives for increased gas transport capacity from the Barents Sea. Gassco delivered an updated report in April 2023(46). This report concludes that increased gas exports from the Barents Sea South will be profitable for society at large. Several of the alternatives appear to be profitable. Of these alternatives, a new dew point control unit (DPCU) and pipeline down to the existing gas pipeline network in the Norwegian Sea appears to be the most profitable. Such a solution can also contribute to an area solution in the Barents Sea South with the flexibility to handle potential additional resources and upsides, and thereby contribute to sound resource management.
The analyses show that solutions, that make it socio-economically profitable to increase gas export capacity from the Barents Sea, exist.
A profitable increase in export capacity will provide opportunities to accelerate the production of gas from fields in the area, make it possible to develop minor gas discoveries and make exploration more attractive. The earlier an increase in export capacity can be realised, the greater the value of accelerated production and exploration.
A potential pipeline solution from the Barents Sea can connect to the infrastructure in the Norwegian Sea and thereby be incorporated into the established gas infrastructure network. Gas from the north can help keep the overall unit costs down. The gas infrastructure network in the south will have significant available capacity in the near future to take in potential gas from the north.
Measures to curb greenhouse gas emissions
In 2023, greenhouse gas emissions from the petroleum sector accounted for about one-quarter of Norwegian emissions. These emissions must be reduced significantly in order to reach the national climate targets in 2030. Additional reductions will be needed leading up to 2050. The companies are working to find solutions that can reduce emissions on the NCS by 50 percent by 2030, compared with the level in 2005.
Several major projects, primarily power from shore, have already been approved, and the companies have a number of major emission-reducing measures in the planning stages. Measures that reduce emissions will yield lower environmental costs and can help extend production and field lifetimes.
Emissions from the petroleum sector
Exploration for and production of oil and gas result in greenhouse gas emissions. Emissions from petroleum-related activities in 2023 amounted to about 11.5 million tonnes of CO2 equivalents. These emissions cover all fixed and floating facilities on the continental shelf, as well as associated onshore plants.
Most of these greenhouse gas emissions on the NCS are CO2 (about 96 percent). The emissions are mainly derived from energy generation on production facilities and onshore plants through the combustion of fossil fuels.
Greenhouse gas emission on the NCS
Greenhouse gas emissions from the petroleum sector mainly consist of CO2 and methane. Emissions of volatile organic compounds (VOC) will have an indirect effect through oxidation over time and will have an additional effect equivalent to CO2.
CO2 emissions
About 95 per cent of CO2 emissions in 2023 were from fixed facilities and onshore plants. Five per cent are from mobile facilities, meaning drilling rigs and well intervention vessels that drill exploration and production wells and carry out well maintenance.
The figure below shows the distribution of CO2 emissions from fixed facilities and onshore plants. Emissions from gas turbines clearly constitute the largest emission source (90 per cent), followed by emissions from flaring (6 per cent).
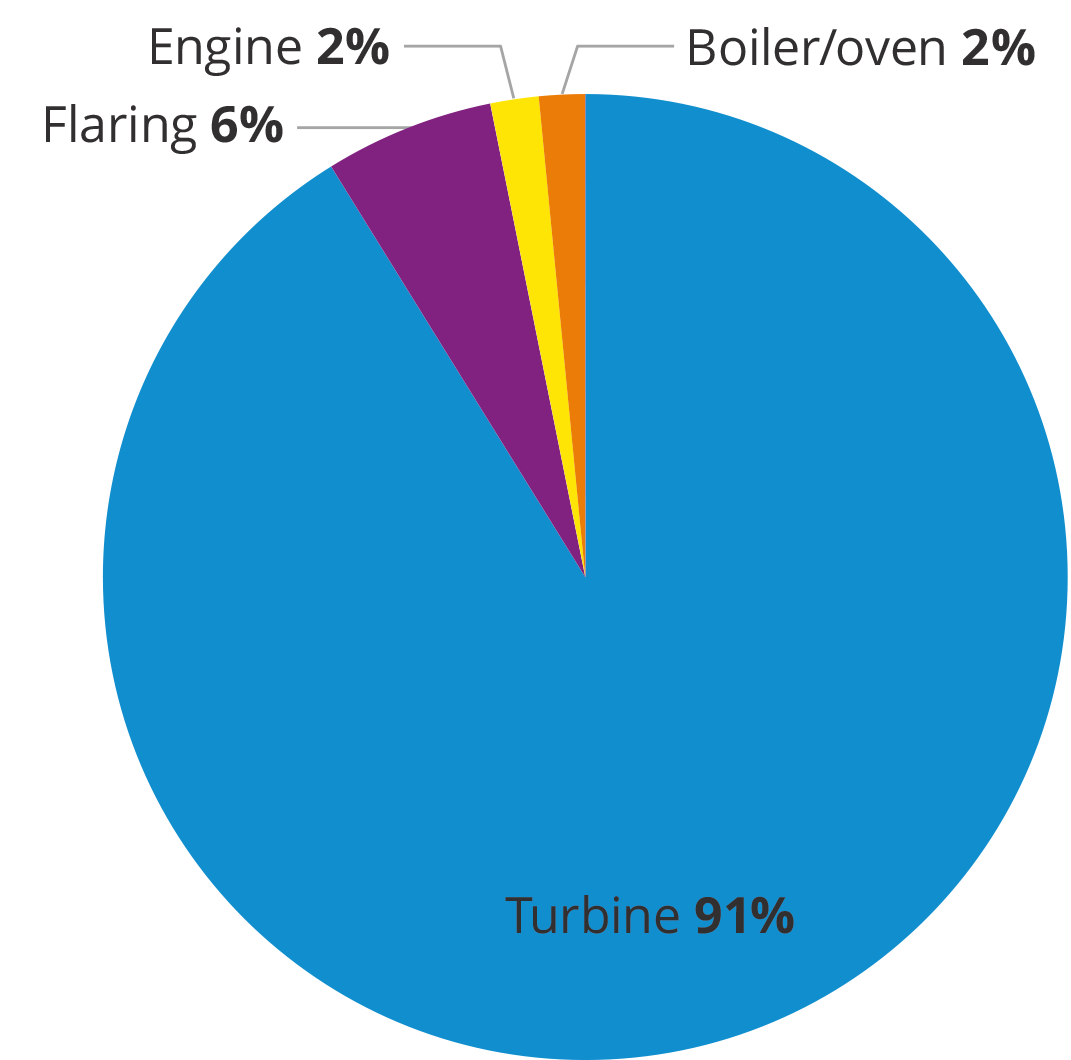
Sources of CO2 emissions from fixed facilities and onshore plants. Total emissions of 10.2 million tonnes of CO2 in 2023. The onshore part of Kårstø is not included here(48).
The largest source of CO2 emissions on mobile facilities is the consumption of diesel in engines. In 2023, this amounted to about 97 per cent of emissions from these facilities(49).
Emissions of methane and nmVOC (volatile organic compounds)
The three main sources of methane and nmVOC emissions are as follows:
- Unburned gas from gas turbines, engines, boilers and flares
- Gas emission from shuttle tankers in connection with loading oil and gas on the field
- Cold-venting and fugitive emissions from the facilities, also called direct methane and nmVOC emissions.
In 2023, these emissions accounted for less than 4 per cent of greenhouse gas emissions on the NCS (in CO2 equivalents).
Emissions are declining
CO2 emissions from the NCS have been declining since 2015 in spite of production remaining relatively stable. Total emissions on the NCS as of 31 December 2023 had been reduced by about 24 per cent since 2015 as illustrated in figure 4.9. The primary cause of the decline in emissions since 2015 is that several facilities are now, in whole or in part, being run on power from shore. Emissions are expected to decline further in the years to come, despite a minor increase in production over the short term.
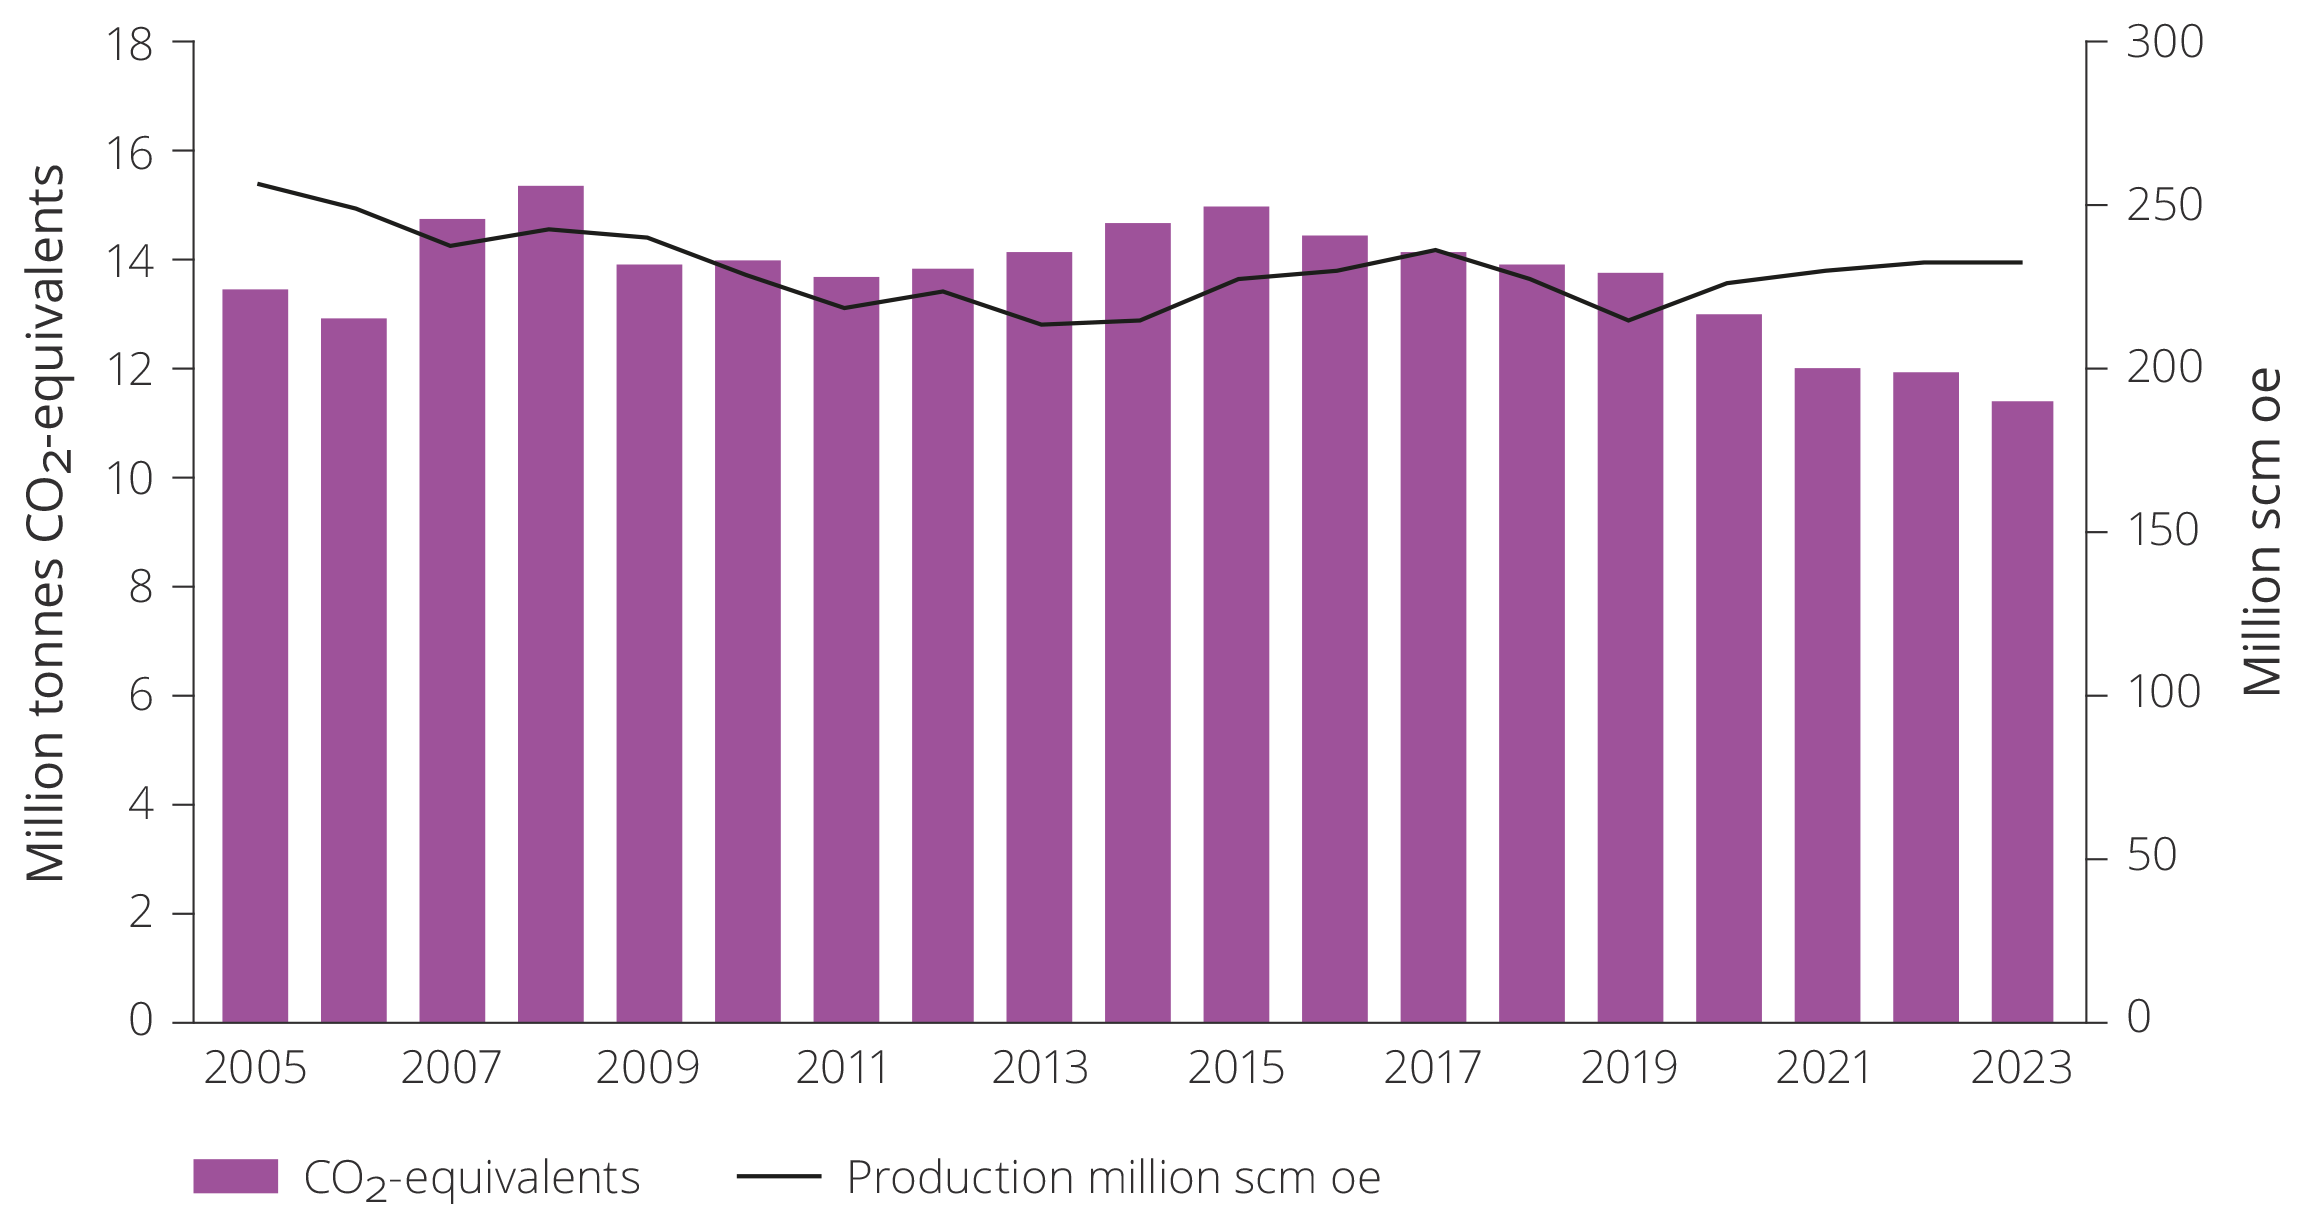
Figure 6.9 Petroleum production and emissions measured in CO2-equivalents.
Norway has multiple climate targets
Climate change is a global challenge that will require effective and goal-oriented measures. The primary goal of climate policy is to reduce greenhouse gas emissions and limit global warming.
- Under the Paris Agreement, Norway has taken on a commitment to reduce greenhouse gas emissions by at least 55 per cent by 2030, compared with the level in 1990. This has also been legislated in the Climate Change Act. Norway can achieve this climate target in cooperation with the EU.
- The Climate Change Act also stipulates that Norway shall be a low-emission society by 2050. The goal is to reduce greenhouse gas emissions in the order of 90–95 per cent compared with emission levels in 1990(50). The assessment of goal achievement must take the impact of Norway's participation in the EU's emissions trading system into consideration.
- Beyond the international binding targets, the Government has a transition target for the entire economy in 2030. This is worded on the government platform as a goal to cut Norwegian greenhouse gas emissions by 55 per cent, compared with 1990.
- As 95 per cent of emissions from oil and gas activities on the NCS are subject to the European emissions trading system, oil companies on the NCS will help reduce emissions subject to emission credits leading up to 2030 on equal footing with businesses in the EU.
- The Government has also set its own targets for emission reductions in the petroleum sector. The goal is for the Government, in cooperation with the industry, to ensure that emissions from oil and gas production on the NCS are cut by 50 per cent by 2030, and to net zero in 2050(51). This is in line with the Storting's (Norwegian parliament's) petition resolution from 2020(52).
- At the industry level, the petroleum sector's ambition is to reduce emissions from oil and gas production by 50 per cent by 2030, compared with 2005, and further to near-zero in 2050(53).
Most licensees also have their own targets to reduce their greenhouse gas emissions.
CO2 tax and emissions trading are the most important measures
The authorities' most important measures to limit greenhouse gas emissions from petroleum-related activities are the CO2 tax and emissions trading system.
Norway introduced a tax on CO2 emissions in petroleum activities in 1991. The statute stipulates that the companies are subject to the CO2 tax when gas, oil and diesel are combusted, and when CO2 or natural gas are emitted. The CO2 tax has increased gradually over time, and in 2024, it constitutes NOK 790/tonne of CO2 emissions.
Petroleum activities were included in the EU's emissions trading system (EU ETS) as of 2008. This means that each tonne of greenhouse gas the businesses emit must be covered by an emission credit. In addition to an initial award of credits in the form of auctions or awards free of charge pursuant to certain criteria, credits can be bought and sold in a second-hand market. The emission credit price is set in the emission credit market and varies over time. The credit price has been subject to greater fluctuations over the past year following a longer period of gradual growth. If one presumes a credit price of EUR 70/tonne (June 2024), this amounts to about NOK 800 per tonne.
If we add the CO2 tax and emission credit price together, they constitute an overall emission cost of about NOK 1600 /tonne, which is very high in an international context. The Government wrote in the Hurdal Platform that the CO2 tax will be increased gradually. This will be considered in the annual budgets.
In addition to the tax and credits for CO2 emissions, there has been a tax in effect on emissions of NOX (nitrogen oxides) since 2007. Emissions from gas turbines, boilers and engines, as well as flaring, are covered by this tax. Tax exemptions are provided for emission units covered by the environmental agreement (NOX fund) entered into between a number of industry organisations and the Ministry of Climate and Environment in 2008. Most businesses in the petroleum sector have chosen to participate in the NOX fund.
The overall environmental cost is a significant expense for fields where energy generation is based on gas turbines. On average, the environmental cost amounts to 30 percent of operating costs for fields that do not receive power from shore. Putting a price tag on CO2 emissions means that the companies have a financial self-interest in implementing measures to reduce these emissions.
Several other policy instruments are employed in addition to emission pricing. Using the best available technology (BAT), power from shore, carbon capture and storage as well as offshore wind must be considered for all new developments or major retrofits. There is also a ban on flaring beyond what is necessary for safety reasons. Support is further provided for research and technology development.
Over time, the various policy instruments have helped ensure that average emissions of greenhouse gases on the NCS are substantially lower per produced unit than the average in other oil and gas-producing regions as discussed in chapter 3, figure 3.4.
Electrification reduces emissions
As the cost of emitting CO2 and the authorities' expectations for emission cuts have increased, the licensees have redoubled their efforts to reduce emissions from the sector. High costs associated with CO2 emissions have, in isolation, increased the profitability of various measures.
Burning gas in gas turbines is the single largest source of greenhouse gas emissions on the NCS. The gas turbines provide electricity for different purposes on the facilities. Process equipment, pumps and compressors frequently run on electricity. Electricity is also used for alarm and control systems, as well as lighting and living quarters purposes. In most cases, this electricity is produced by generators operated by gas turbines on the local installation.
Larger equipment such as compressors for export or gas injection are frequently operated by gas turbines connected directly to the compressor. These are normally the most energy-intensive single units on board.
The facilities will need to be retrofitted to run on power from sources other than gas turbines in order to achieve major emission reductions. The most common solution has been electricity from the onshore power grid, but it is also possible to supply the facilities with electricity from offshore wind or build separate gas-fired power plants with CCS to supply the facilities with electricity. The scope of work and costs associated with such retrofits will depend on how much of the power supply will be replaced with different electricity.
Power from the grid
Electricity transmitted from the onshore power grid is considered to be the best technical solution and most profitable alternative to reduce emissions from gas turbines. Several fields are currently operated, in whole or in part, with power from shore, and multiple projects are under development or in the planning phase. These projects are considered to be more challenging to implement than the projects that have already been greenlit.
Power from offshore wind
The electricity can also come from other sources. Power generation started on Hywind Tampen in 2023. This is a floating wind farm that supplies electricity to the Snorre and Gullfaks fields. The farm consists of 11 wind turbines with an installed capacity of 88 MW. The operator estimates that this wind farm can cover about 35 per cent of its annual need for electricity. This can yield an annual reduction in CO2 emissions of about 200,000 tonnes, compared with when gas turbines covered this entire need.
Wind turbines do not generate electricity when there is too much or too little wind. For this reason, facilities supplied with electricity from offshore wind will also be dependent on an alternative power supply. On Snorre and Gullfaks, the alternative is currently gas turbines. In other words, the emission reduction offered by offshore wind is lower that what is provided by power from shore.
In the Barents Sea, a study is under way to explore the opportunity to connect wind turbines to the power grid using the power from shore infrastructure on the Goliat field. GoliatVIND aims to provide renewable electricity to the Hammerfest region. Since Goliat is already covering its power needs via a cable from shore, the GoliatVIND project will not reduce emissions from the petroleum sector.
GoliatVIND can be developed in 2027–28, given that the project is matured as planned, and the authorities issue a development licence.
Due to high development costs, neither Hywind Tampen nor GoliatVIND are profitable projects without subsidy schemes, and both projects have received support from Enova. Enova's support is anchored in technology development for more renewable energy. This support will also help ensure that Norwegian industry can take part in an international offshore wind market that is expected to grow. Report No. 36 to the Storting (2020–2021) singles out Enova as the primary vehicle for bringing about future Norwegian value creation associated with offshore wind.
Development costs are expected to come down once the projects become larger and the technology becomes mature through technology development, utilising economies of scale and increased volumes.
Power from gas-fired power plants with CCS
Another option for supplying electricity to fields is building gas-fired power plants with carbon capture and storage (CCS). Capturing CO2 from turbine exhaust from existing facilities is challenging due to spatial and weight limitations.
It is easier to build new independent gas-fired power plants where CCS is an integrated part of the solution. Such gas-fired power plants can either be built as dedicated facilities offshore that supply nearby fields with electricity, or they can be built as gas-fired power plants on or near shore. This will require larger investments than electricity from the onshore power grid. Retrofits on the facilities will be equally extensive, but this will also require the construction of a gas-fired power plant and infrastructure to import gas and store CO2.
Electrification of facilities
In 1996, the Storting decided that the companies must present an overview of energy needs and the cost of using power from shore rather than gas turbines in all new field developments.
Several fields are running on power from shore, in whole or in part. This has reduced annual emissions from production by an estimated 3.2 million tonnes of CO2. The Johan Sverdrup, Troll, Gjøa, Goliat, Valhall, Edvard Grieg, Ivar Aasen, Gina Krog, Sleipner Øst and Martin Linge fields currently receive power from shore.
The Kårstø, Kollsnes, Melkøya LNG and Nyhamna plants also receive electricity from the power grid, in whole or in part. Additional electrification projects are under way on Melkøya and on Troll. Power from shore is also being established on the Oseberg Field Centre, Oseberg Sør, Njord, Draugen and fields in the Yggdrasil area.
Hywind Tampen is supplying Gullfaks and Snorre, and is the world’s first floating offshore wind farm to supply electricity to oil and gas platforms. Power generation from the first turbines started in 2022, and the project was completed and reached full capacity in 2023.
Studies are also under way for power from shore retrofits on multiple fields on the NCS. It applies for the North Sea, Norwegian Sea, as well as additional electrification of the onshore plant at Kårstø.
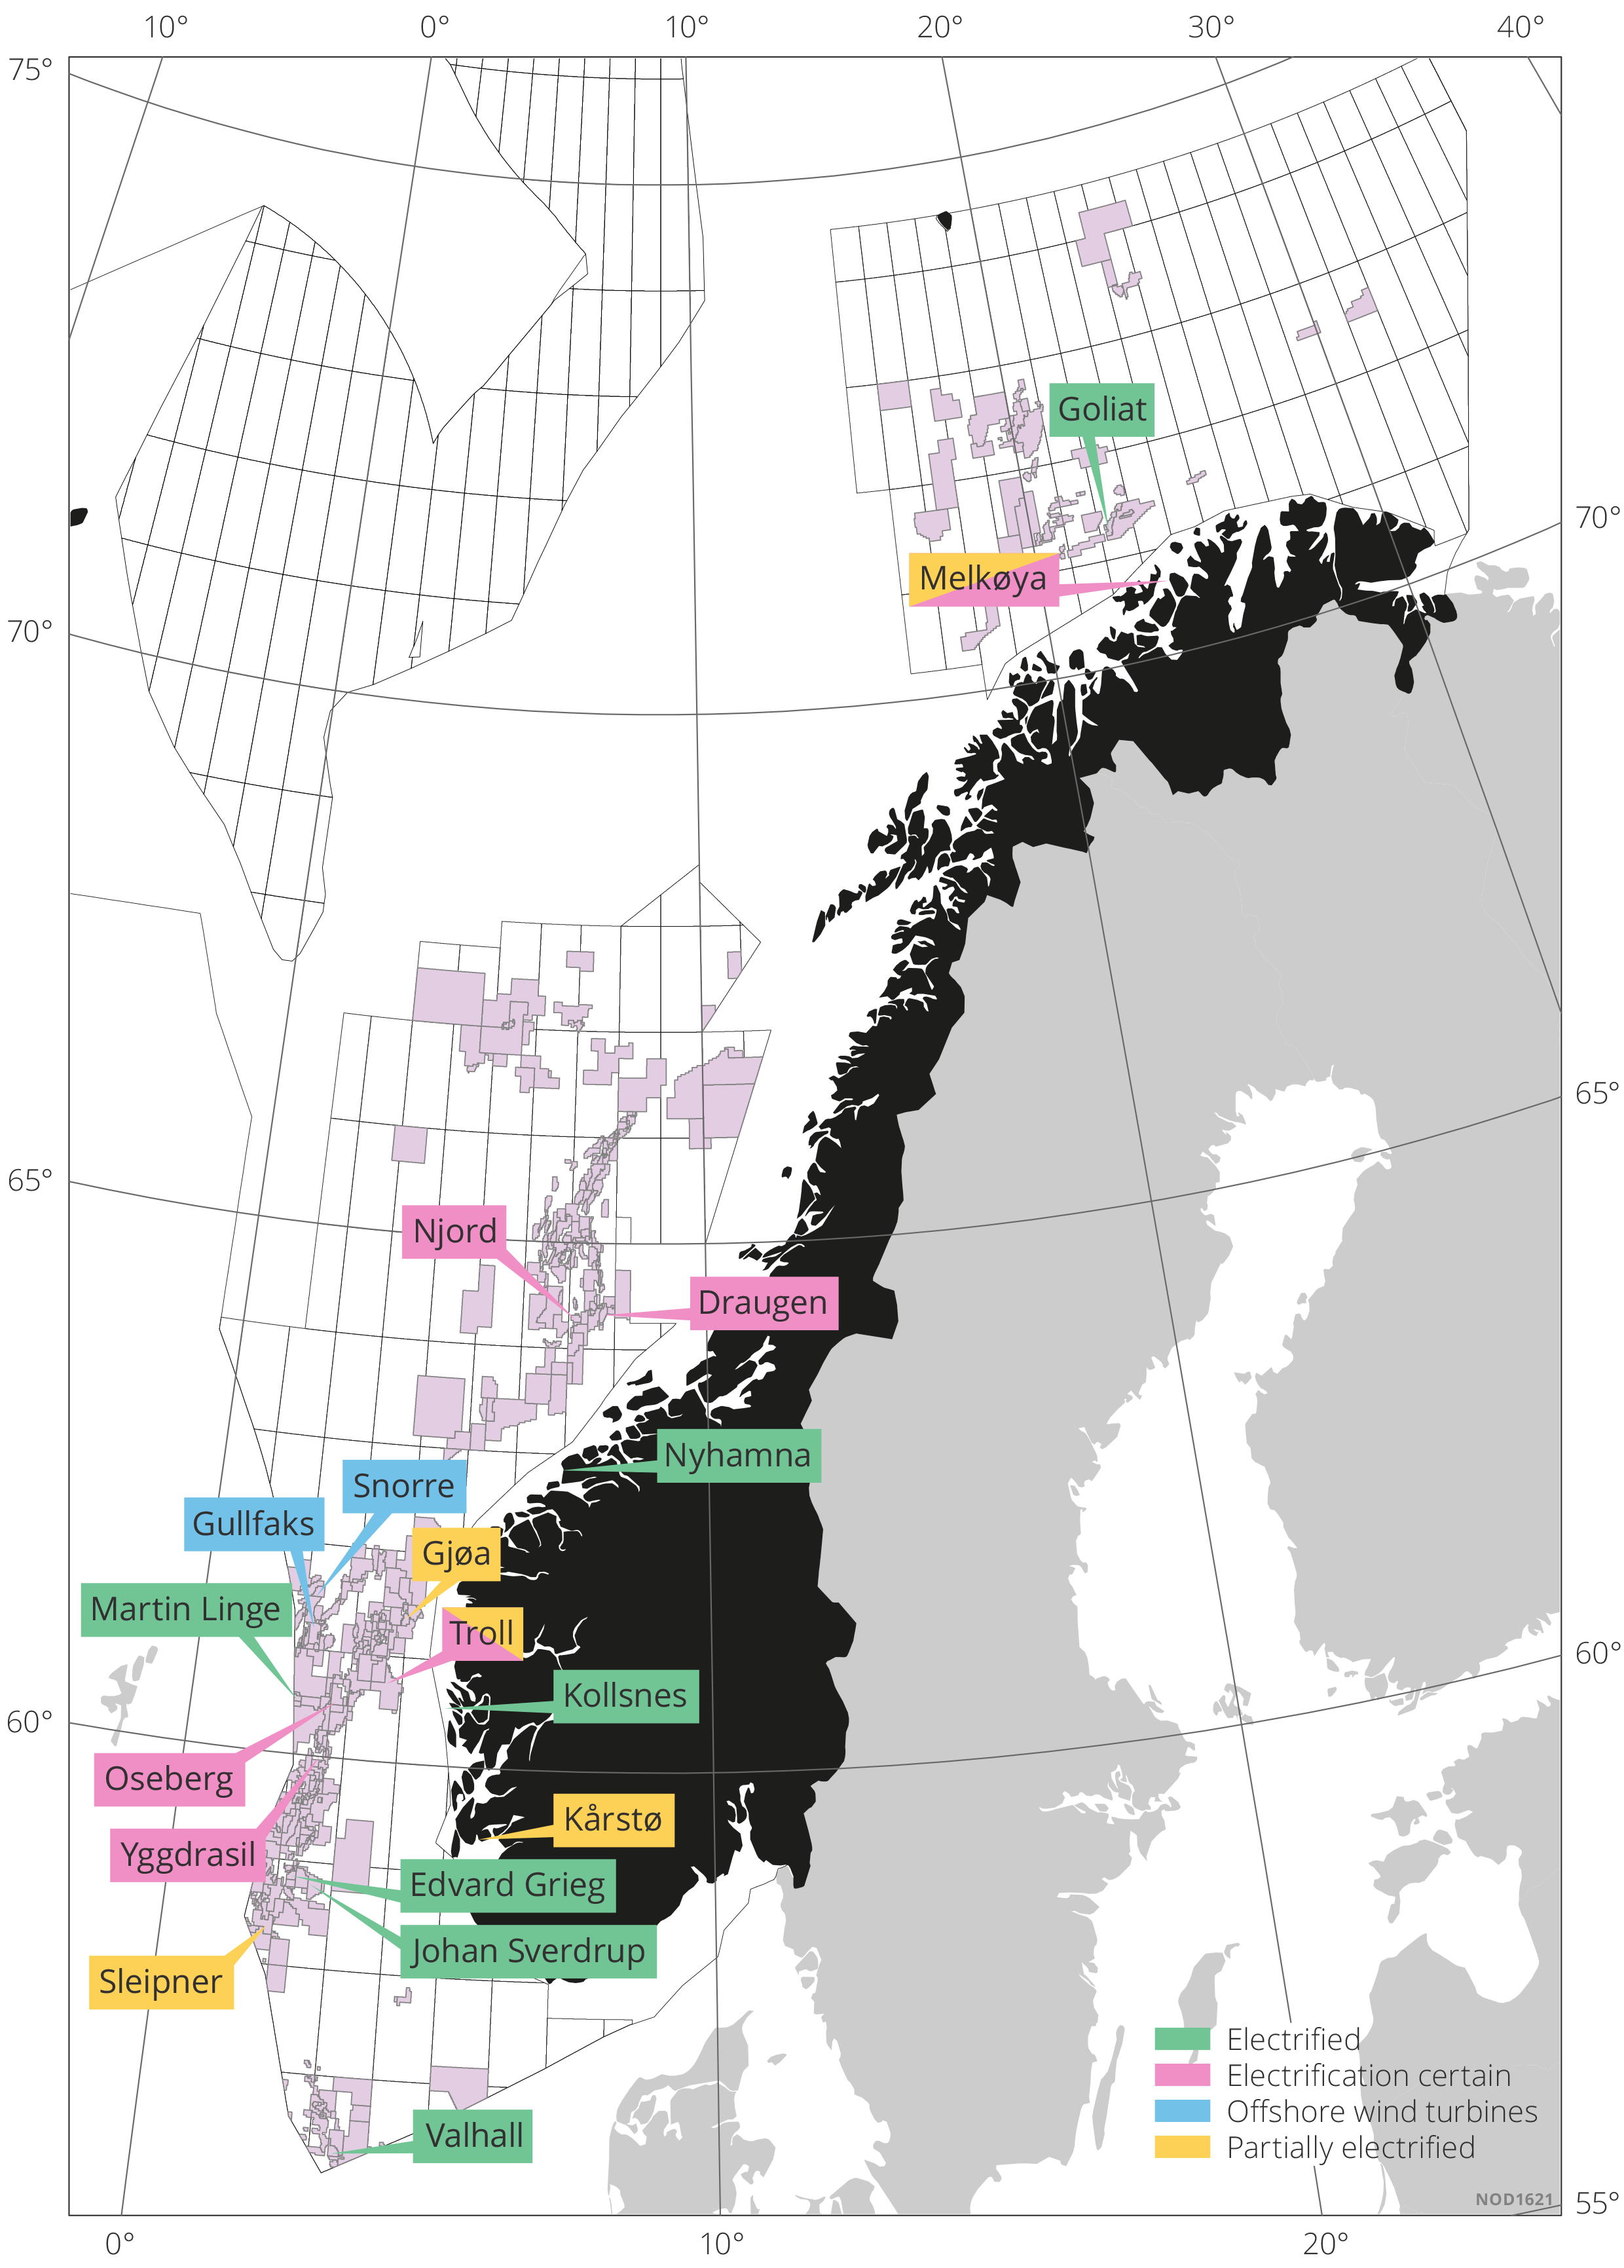
This map shows facilities that receive power from shore. Fully electrified facilities are indicated in green, and partially electrified facilities are indicated in yellow. Fields where full or partial electrification decisions have been made are indicated in pink. The Snorre and Gullfaks fields are partially supplied with power from offshore wind (Hywind Tampen) (blue). In this context, full electrification means that the fields or onshore plants do not use gas turbines to generate power.
Future emissions
How future emissions will evolve will depend on developments in production and activity levels in the petroleum sector, including the number of facilities and onshore plants as well as emissions from these sources.
From a forecasted production peak in 2025, we expect a gradual decline in production over time, despite the uncertainty associated with how quickly production and activity will decline, which was also discussed in Chapter for under potential scenarios. Over time, this will result in fewer producing facilities, which will reduce emissions. In addition to this, new measures to replace turbine-generated electricity with other sources will further reduce emissions from production. Beyond this, there will be measures that address other emission sources.
The Norwegian Offshore Directorate's projections as published in April 2024, are illustrated in figure 6.10. The figure highlights that emissions can reach the 50 per cent reduction target in 2031. This presumes that ongoing, but not yet approved, partial or full electrification projects in existing facilities proceed as planned. At this point, emissions in 2035 can be reduced to 5.9 million tonnes of CO2 equivalents.
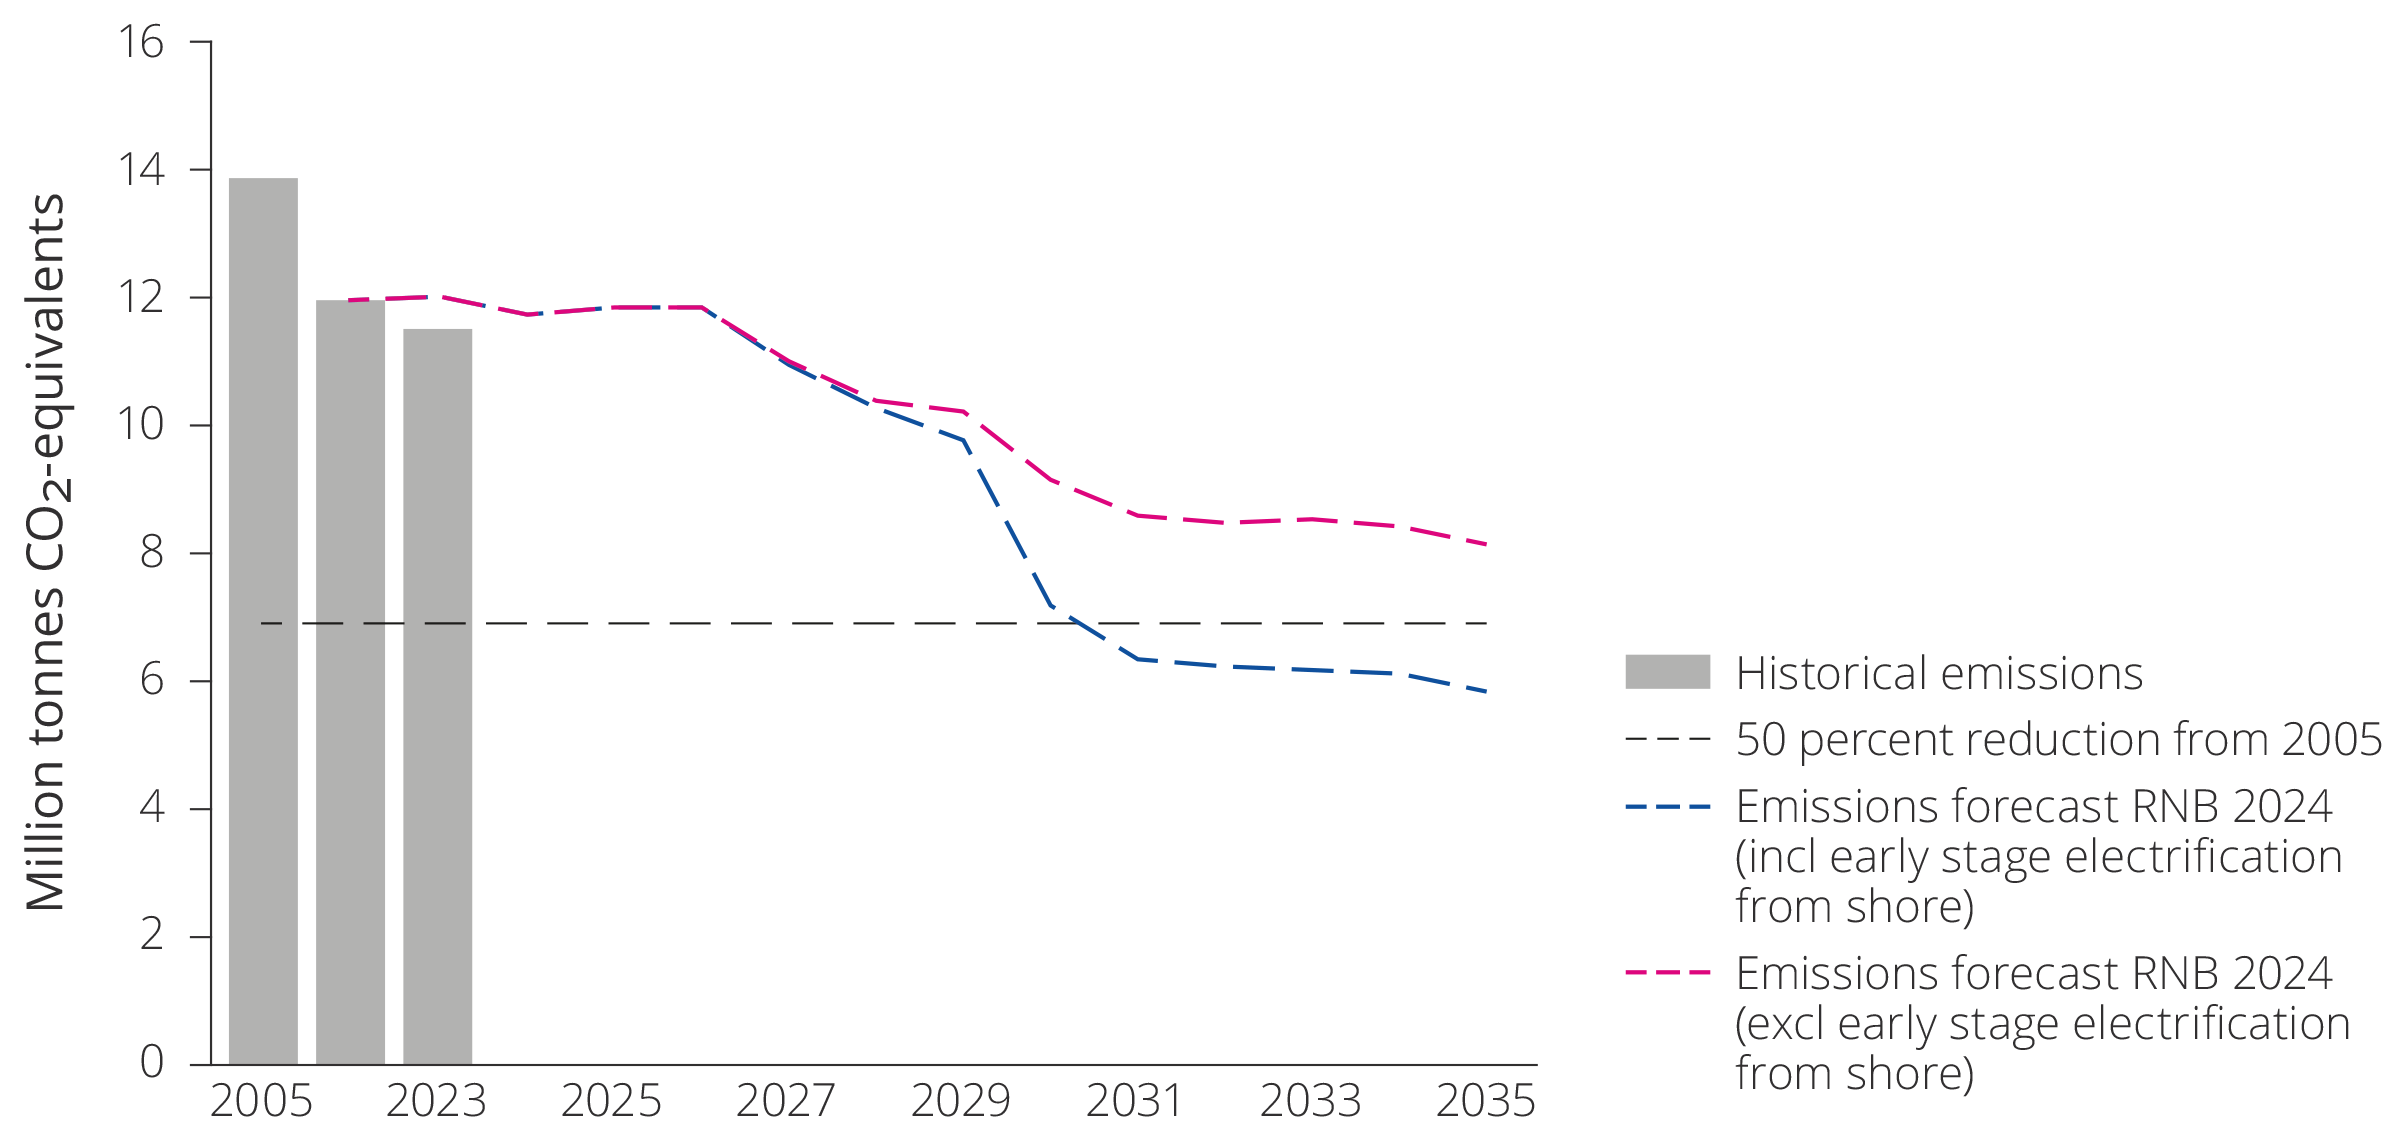
Figure 6.10 Historical emissions, as well as the Norwegian Offshore Directorate's two projected emission trajectories. One of the emission trajectories excludes early stage power-from-shore projects, while the other includes them in full. The projections are based on reporting from the operators in autumn 2023.
The two emission trajectories illustrate the uncertainty associated with implementation of electrification projects in the planning phase. There will also be uncertainty associated with the implementation of other projects and plans without this being illustrated in an equivalent manner. For example, both emission trajectories contain assumptions linked to energy efficiency measures, recovery strategy and lifetime which all come with associated uncertainties.
The uncertainty associated with electrification projects is partly an uncertainty linked to the licensees' further maturation and decision to implement the projects, and partly an uncertainty as to whether the projects will have access to electricity and be approved by the authorities.
Consequences of environmental measures
Remaining resources on operating fields provide a basis for long-term production as discussed in this chapter. Investments in improved recovery measures will be necessary in order to realise these values. Several of the improved recovery measures may entail increased energy consumption or greenhouse gas emission.
For fields where energy production is partially or fully based on gas turbines, the associated costs related to CO2 emissions are becoming an increasingly significant portion of the expenses. This can lead to reduced profitability of measures to improve recovery. Future production is therefore affected by the level of CO2 costs.
The high costs associated with greenhouse gas emissions, combined with the licensees' own climate targets give the companies strong incentives to implement measures to bring these costs down. The companies presume that electrification with power from shore is the course of action with the lowest cost, and which can deliver the greatest emission reductions leading up to 2030. This is why power from shore projects are being explored on multiple fields on the NCS.
The alternatives to power from shore are offshore wind, or electricity generated using a gas-fired power plant in combination with CCS. These solutions are considered to be more expensive than power from shore.
Several of the fields have no plans to electrify to reduce emissions. Increased CO2 costs and operating costs can affect the production of resources, weaken incentives for exploration and result in decreased lifetime.
Fields shutting down earlier can lead to discontinuation of profitable production capacity and removal of future flexibility, which can often be very expensive measures in a comprehensive NCS perspective. The Government emphasises this in the Green Book, which is a special appendix to the fiscal budget.
DownloadNew industries
In this chapter:
- Resource potential in seabed minerals
- Storing CO2 on the Norwegian continental shelf (NCS)
- Offshore wind
The Storting (Norwegian parliament) passed the Seabed Minerals Act(63) in 2019. The objective of the Seabed Minerals Act is to contribute to socio-economic management of these mineral resources(64).
The statute lays out the terms and framework for such activity, including the award of exploration and extraction licences for minerals. The overall framework is based on the principle of government management and control of natural resources through a licensing system.
The Norwegian Offshore Directorate has been appointed by the Ministry of Energy’s to take stewardship for minerals on the seabed. Over several years, the Directorate has collected data, in part alongside the academic community, to determine the resource potential for seabed minerals on the NCS, see figure 7.1. This data has been made available to interested stakeholders in the industry.
Seabed minerals
Mineral deposits on the seabed are divided into three types: manganese nodules, manganese crusts and sulphides. All three types are mainly found at depths between 1500-6000 metres and contain a range of different metals.
Manganese crusts and sulphides have been found in the deep sea on the NCS, where the waters are between 800–3500 metres deep.
Manganese crusts are formed through precipitation of minerals directly from seawater onto naked bedrock on the seabed. The crusts are mainly composed of manganates and hydroxides. The Norwegian Offshore Directorate has estimated the extend of mineralised bedrock using existing bathymetry data.
Sulphides are precipitated from hot springs associated with volcanic activity on the seabed along the axes of mid-ocean spreading ridges. As for Norwegian waters, this applies to the Mohns Ridge in the Norwegian Sea, the Knipovich Ridge between Svalbard and Greenland, and parts of the Kolbeinsey Ridge north of Iceland.
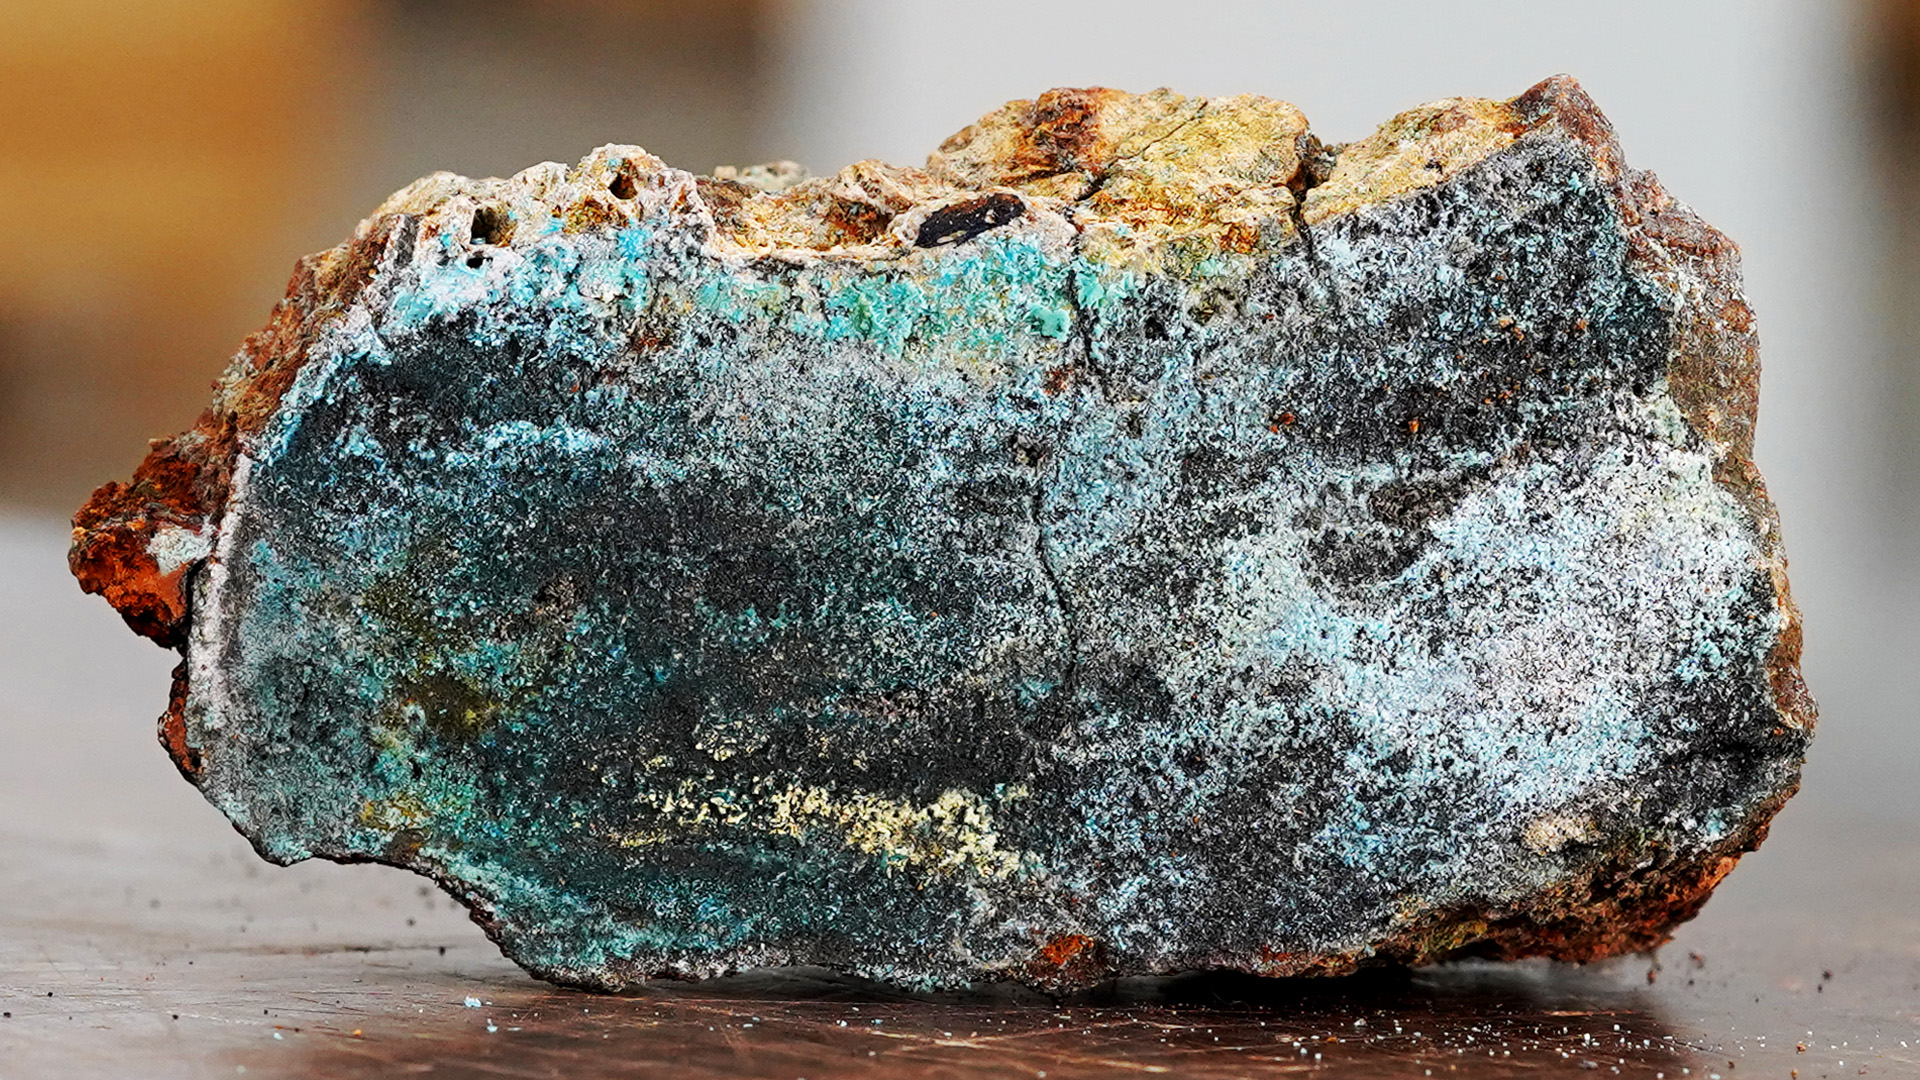
Sulphide sample
Resource potential in seabed minerals
The Norwegian Offshore Directorate has mapped the most commercially interesting mineral deposits and assessed the overall resource potential on the NCS. The results are shown in tables 7.1 and 7.2.
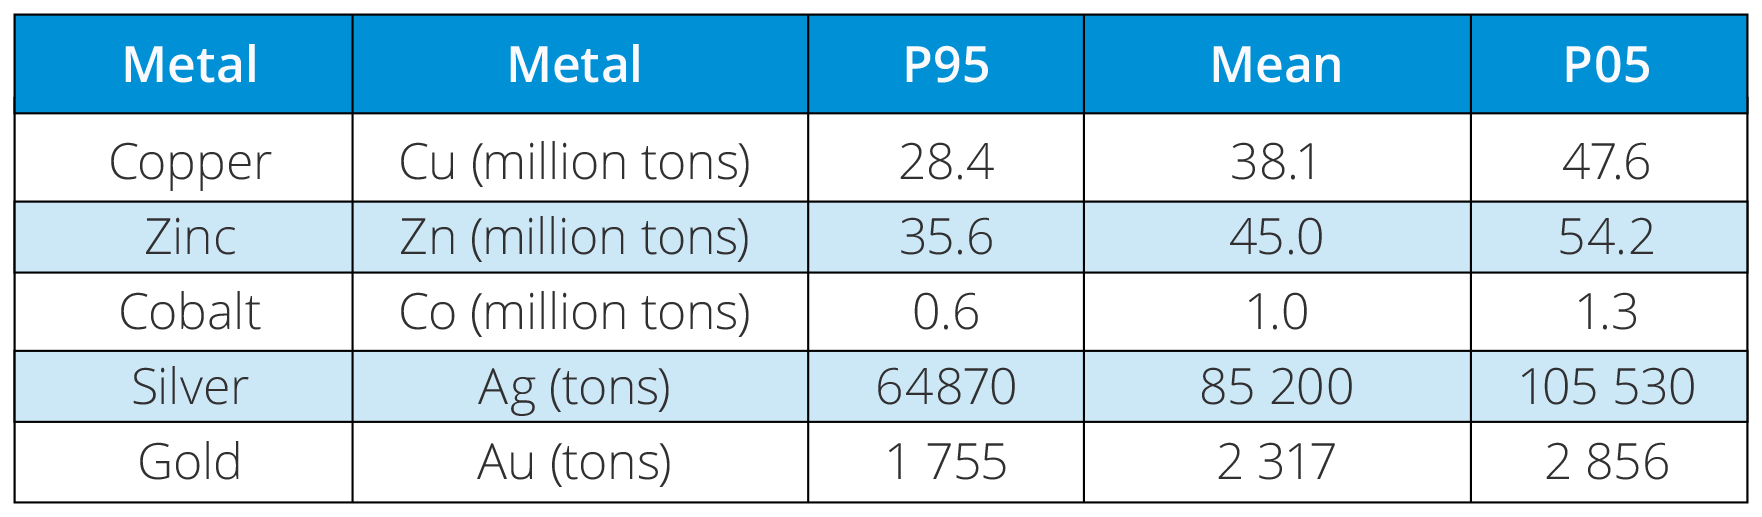
Table 7.1. Estimated total volumes of some important metals found in sulphide deposits in the assessment area.
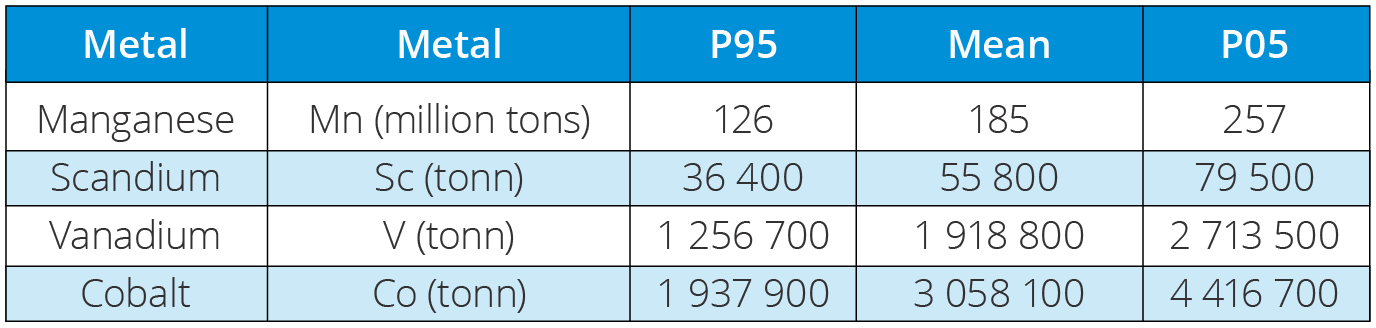
Table 7.2. Estimated total volumes of some important metals found in manganese crusts in the assessment area.
The resource evaluation(65) is based on the same methodology used to evaluate oil and gas resources, so-called play analysis, but adapted to seabed minerals. Based on geological parameters, the mineral deposits are divided into different types of deposits (also called plays). These are defined with a range (from lowest to highest value) and then run through Monte Carlo simulations to calculate the total volume of metals in the plays, both individually and in total.
The Norwegian Offshore Directorate has compiled geophysical data and seabed mineral samples during expeditions alongside researchers of the University of Bergen since 2011, and since 2020 also with the University of Tromsø. In addition to the research collaborations collected the Directorate also collected large volumes of its own data and samples during annual expeditions since 2018. The resource assessment is based on analyses of the results of all these expeditions, supplemented with data obtained from scientific work and other publicly available sources.
Data has been collected from both hydro-thermally active and inactive sulphide deposits during this mapping. Active deposits are only found in the rift valley along the axes of currently spreading ridges. The inactive deposits, on the other hand, are found in all areas with oceanic crust outside the rift valley and make up 99 percent of the total sulphide resources. In these same areas, manganese crusts along subsea highs and steep slopes can also be found. Mapping has shown that the age of underlying rocks can be directly correlated to the thickness of the manganese crusts. In other words, the older the base layer, the longer the crust has been growing.
These resources are listed as in-place resources in the Norwegian Offshore Directorate’s assessments. The final Monte Carlo simulations in the resource assessment give probability distributions which delineate the range of possible outcomes), hence the range in potential size of the in-place resources.
For this reason, in-place resources are published as probability distributions with a range of outcomes, rather than one specific number. It is however best practise to use the average numbers from the distribution when discussing the resources. The most common to use are the expected value (the arithmetic mean) and the median. Tables typically illustrate calculated values for low, medium and high estimates (usually the P95, P50 and P05 values in the probability distribution), as shown in tables 7.1 and 7.2.
Extraction can generate value for the future
The resource base indicates that seabed mineral activity could become a new industry in Norway, an industry that can contribute to value creation, jobs and securing the supply of important metals. Technology that allows extraction of potential mineral deposits is an underlying assumption for all activity. Another prerequisite is that such deposits have a presumptive market value that is at least as high as the cost of finding and recovering the deposits.
Today, mining for minerals takes place nearly exclusively on land, as the technology and costs of recovery entail greater profitability for extracting minerals on land rather than in deep waters.
Establishing seabed mineral activity is still in its early stages, both on the NCS and worldwide. This makes it difficult to draw clear conclusions as to whether deep sea mining will be profitable on the NCS, even with high demand and prices.
In such an early phase, there are a number of uncertainties that can complicate estimates:
- geology, including the extent and thickness
- development and deep sea mining technology
- market and prices
- government regulations and policies
Additional factors include the uncertainty and risk associated with environmental impact and potential disadvantages for other users of the sea, as well as uncertainty and risk linked to the lack of and quality of data.
To protect nature diversity around especially active hydrothermal structures, Report No. 25 to the Storting (2022-2023) included a requirement stating that recovery from active hydrothermal structures will not be allowed, and that these structures shall be protected to prevent damage from activity in adjacent areas. A production plan will only be approved if it can be documented that production can be carried out without leading to significant negative impact for nature diversity linked to the active structures(66).
The basis for overall stewardship of the opened areas entails a step-by-step approach, as well as a requirement increase the knowledgebase for both resources and the environment before initiating potential mining. This means proceeding with caution and utmost consideration for the environment.
Such an approach utilises "lessons learned" and is important for increasing the understanding of the resources as well as reducing subsurface risk. The Norwegian Offshore Directorate plays an important role by conducting its own mapping and analyses, thereby elevating data quality while at the same time facilitating essential sharing of data.
Exploring an area with this approach costs of clarifying the resource potential can be reduced, while clarifying the value potential. Step-by-step exploration can thus be a robust strategy to clarify the size of existing mineral resources, how much value can be realised, and whether this would entail substantial negative impacts for the external environment, nature diversity and other users of the sea.
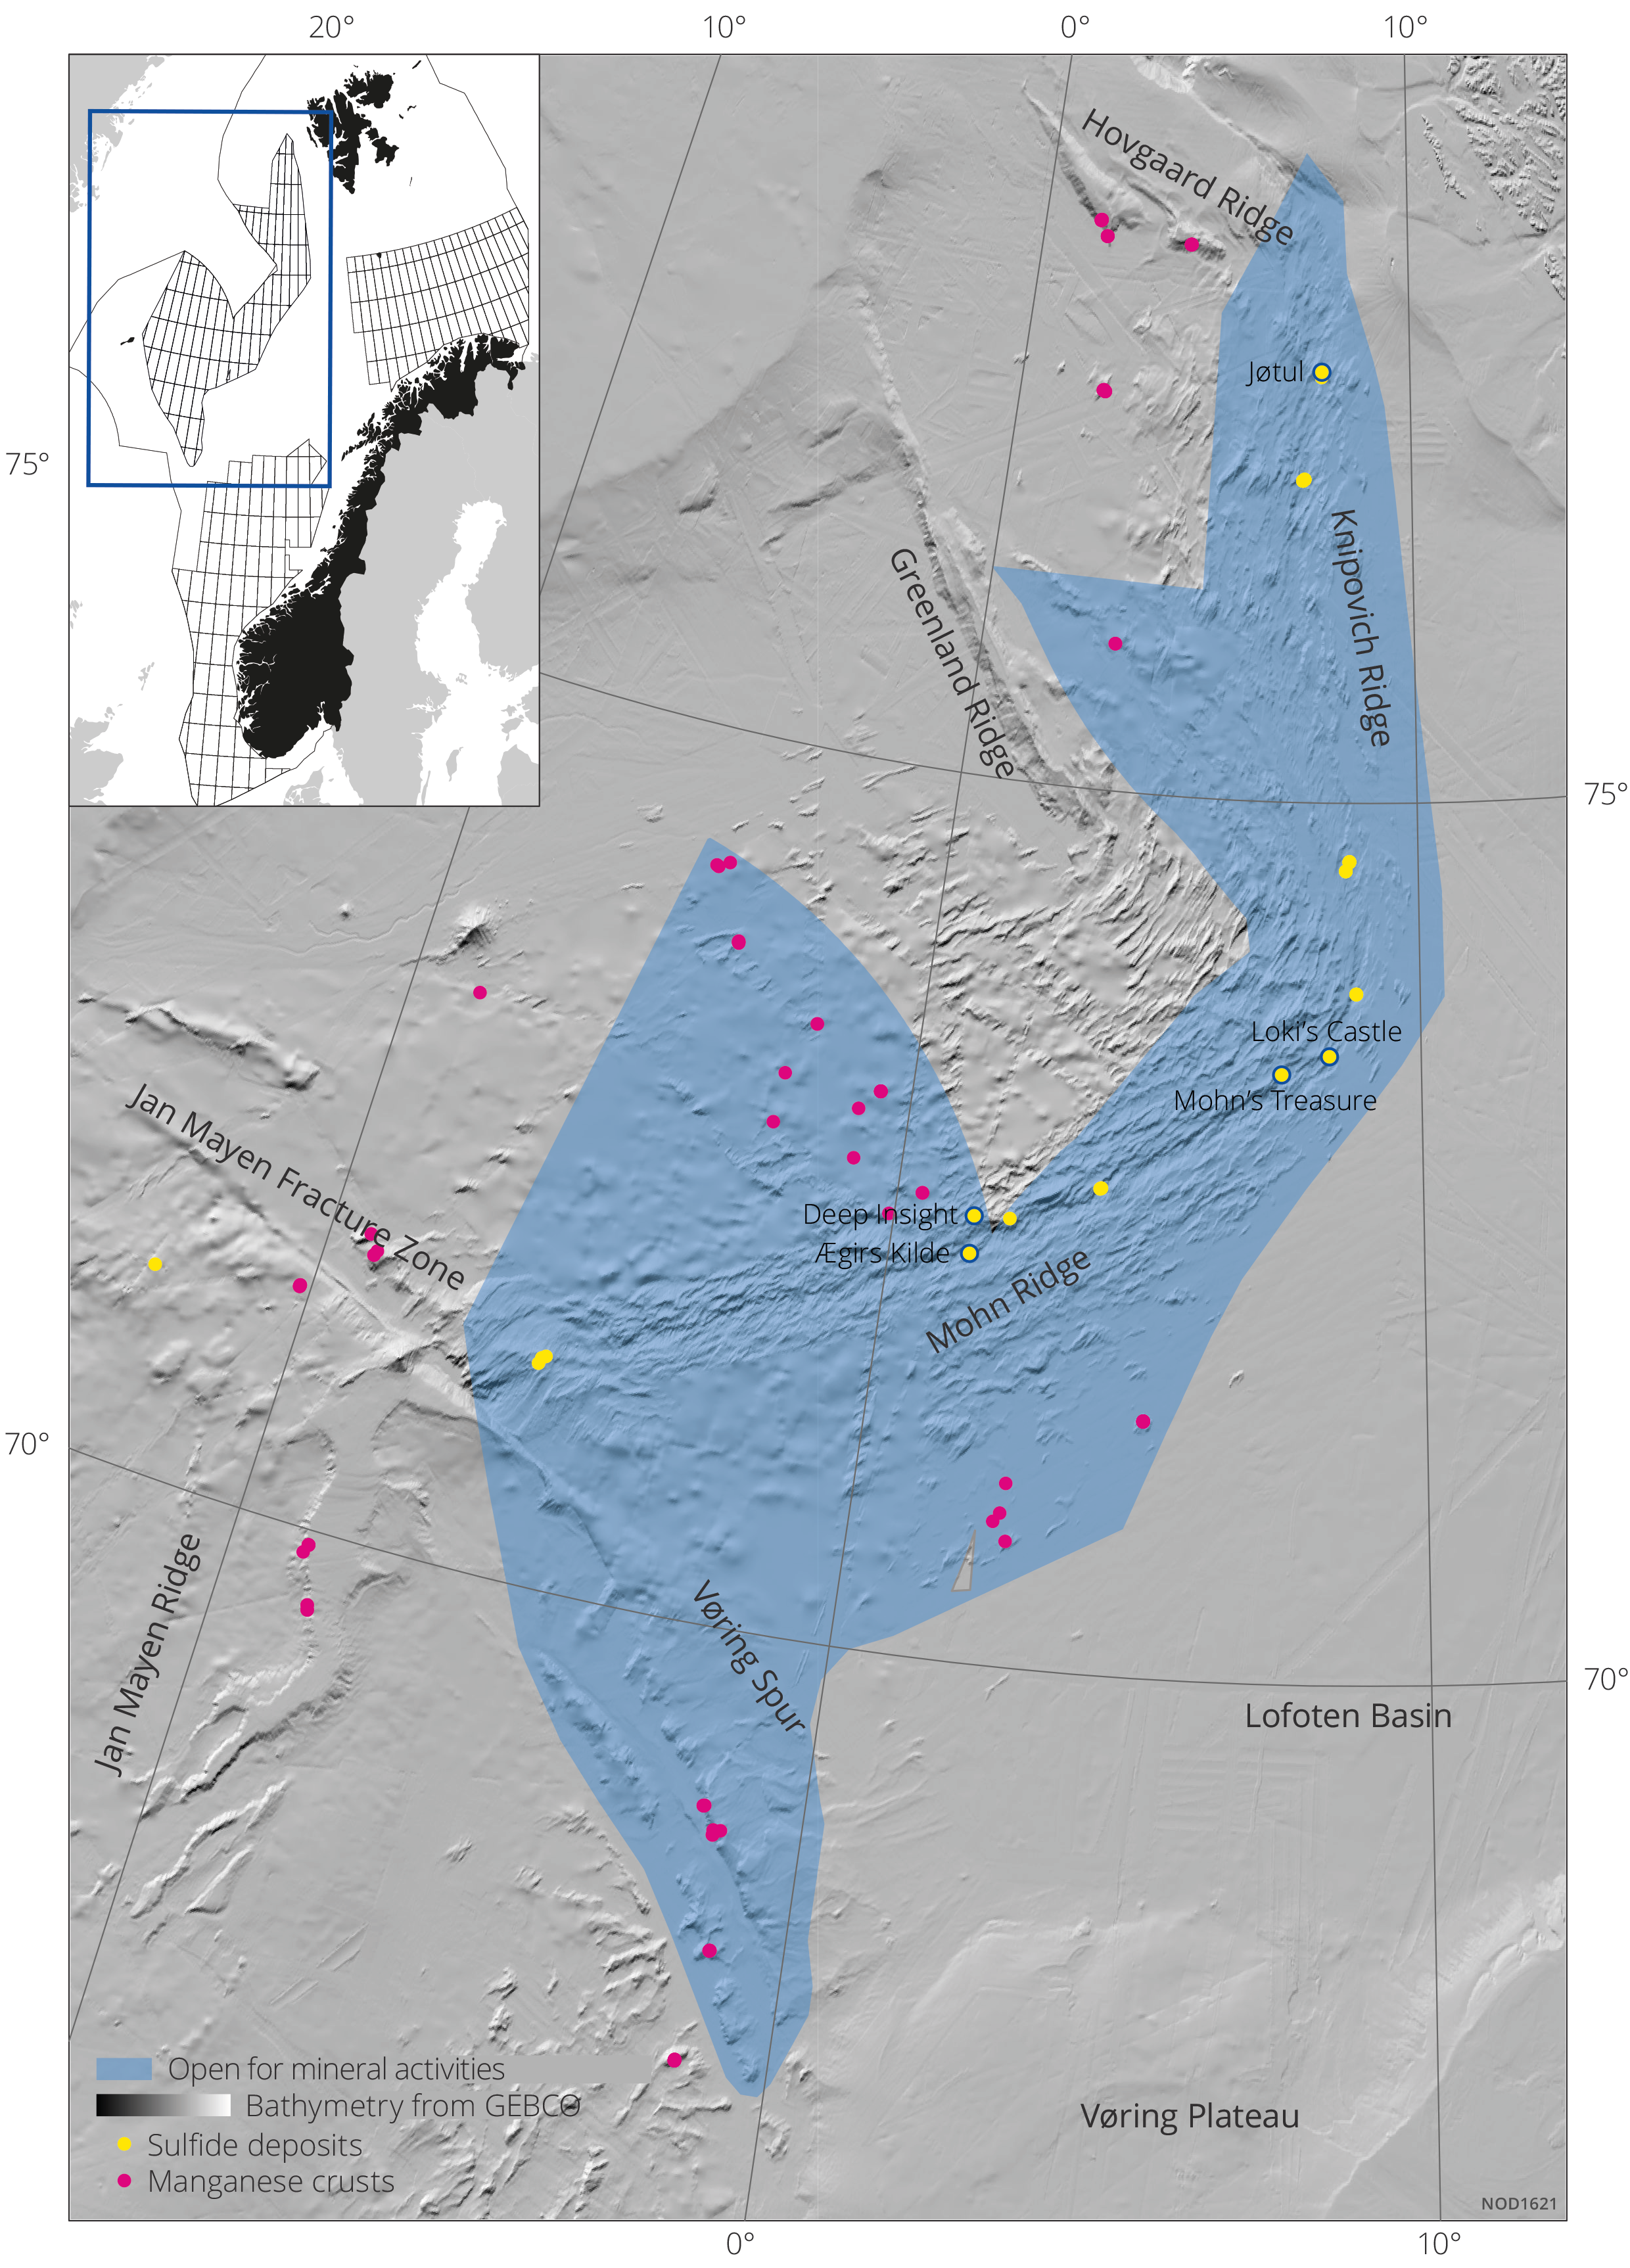
Figure 7.1 The map shows the area opened for mineral activity including mapped locations (data points) for both sulphide and manganese deposits.
Storing CO2 on the Norwegian continental shelf (NCS)
Carbon capture, transport and storage (CCS) encompasses capturing CO2 from power generation and industries, transporting liquid CO2 by ship or pipeline, and storing CO2 in geological formations. Storing CO2 on the NCS could become an important industry if it proves cost-effective and can compete with carbon storage opportunities in other countries.
Capacity to store vast volumes of CO2 on the NCS
In Norway it is only possible to store CO2 deep under the seabed The NCS comprises extensive geological formations that provide adequate conditions for storage and have properties that prevent CO₂ from moving upward through the sediment layers towards the seabed. Safe storage without leaks is a precondition to be awarded a licence to inject and store CO2.
The Norwegian Offshore Directorate has extensively mapped areas on the NCS that are suitable for safe storage of CO2. The mapping shows that large volumes can be stored in the subsurface. The evaluation is based on access to more than 50 years of data collected in connection with petroleum activity, in addition to calculations of the potential for storing CO2 in relevant formations. The Directorate published the CO2 storage atlas in 2014 which summarises and illustrates storage opportunities on the NCS(67).
Based on this work the theoretical storage capacity is expected to add up to more than 80 billion tonnes of CO2, which is equivalent to around 1600 years of Norwegian CO2 emissions at the current level(68). CO2 storage has a number of similarities with petroleum activity. It requires good understanding of the subsurface such as collecting seismic data or drilling wells, among other things.
Open-door policy for acreage
Companies with necessary expertise and concrete industrial plans that entail a need to store CO2 on a commercial basis, can apply to the Ministry of Energy (MoE) for an exploration licence adapted to the company’s needs.
As of June 2024, a total of seven licences have been awarded under the CO2 Storage Regulations. Six of these are exploration licences for storing CO2as shown in figure 7.2.
Different types of CO2 licences
Survey licence: Licence that entitles companies to conduct surveys to map subsea reservoirs for storing CO2. This licence does not grant any exclusive rights to specific areas, nor does it give priority when it comes to the award of other types of licences. Survey licences are granted for periods of up to three years. The public announcement requirement does not apply.
Exploration licence: This is a licence that grants exclusive rights to explore for subsea reservoirs for permanent storage of CO2 within a defined area. The award of such a licence means that statutory award criteria have been met, including that the award is made according to objective, published and non-discriminatory criteria. Exploration licences are granted for a period of up to 10 years.
Exploitation licence: This is a licence type that grants exclusive rights to exploit (develop) a subsea reservoir on the NCS for permanent storage of CO2. The award of such a licence requires fulfilment of statutory award criteria, and that the award is made according to objective, published and non-discriminatory criteria. Companies holding an exploration licence for the relevant area shall be prioritised in the event, that an exploitation licence is awarded in the same area. The duration of the licence will be stipulated by the state when the licence is awarded.
Regulations
The Regulations relating to exploitation of subsea reservoirs on the continental shelf for storage of CO2 and relating to transportation of CO2 on the continental shelf(69) (the Storage Regulations) provide the legal basis for CO2 storage. The objective is to facilitate socio-economically profitable storage of CO2.
Among other things, the Regulations stipulate the terms and framework for awarding survey, exploration and exploitation licences, where the guiding principle is government control of storage resources through a licensing system(70).
Applications in accordance with the Storage Regulations are processed via an open-door policy. This means that stakeholders that want to secure a licence can apply as soon as they have developed a sound and adequate basis for such an application. Received applications are processed on a continuous basis. If the applications are of sufficient quality, the state makes a public announcement to allocate the area considered relevant for a potential award, and with an appropriate application deadline.
The role of the Norwegian Offshore Directorate is to assist and advise the Ministry within all aspects of CCS activity, including announcing and awarding acreage, processing development plans and injection of CO2. The Directorate shares facts and expertise about the storage potential and proposes how regulations for handling CO2 can be further improved. The Directorate is also responsible for obtaining and passing on analyses and data regarding storage of CO2 on the NCS.
CO2 storage on the NCS since the 1990s
In connection with petroleum production, storage of CO2 has taken place on the NCS since 1996 on the Sleipner field in the North Sea, and from 2008 on the Snøhvit field in the Barents Sea. On Sleipner, CO2 is removed from the natural gas produced, and reinjected into the Utsira Formation, which contains an aquifer on the field.
On Snøhvit, CO2 is removed from the natural gas at the LNG plant on Melkøya to avoid ice formation in the facility, before it is returned to the field via a pipeline.
These are the only two CO2 storage projects currently in operation in Europe. They have provided valuable insight into CCS, as they have been in operation over a long period of time and are unique in an offshore context.
The figure shows the volume of CO2 stored so far on the NCS.
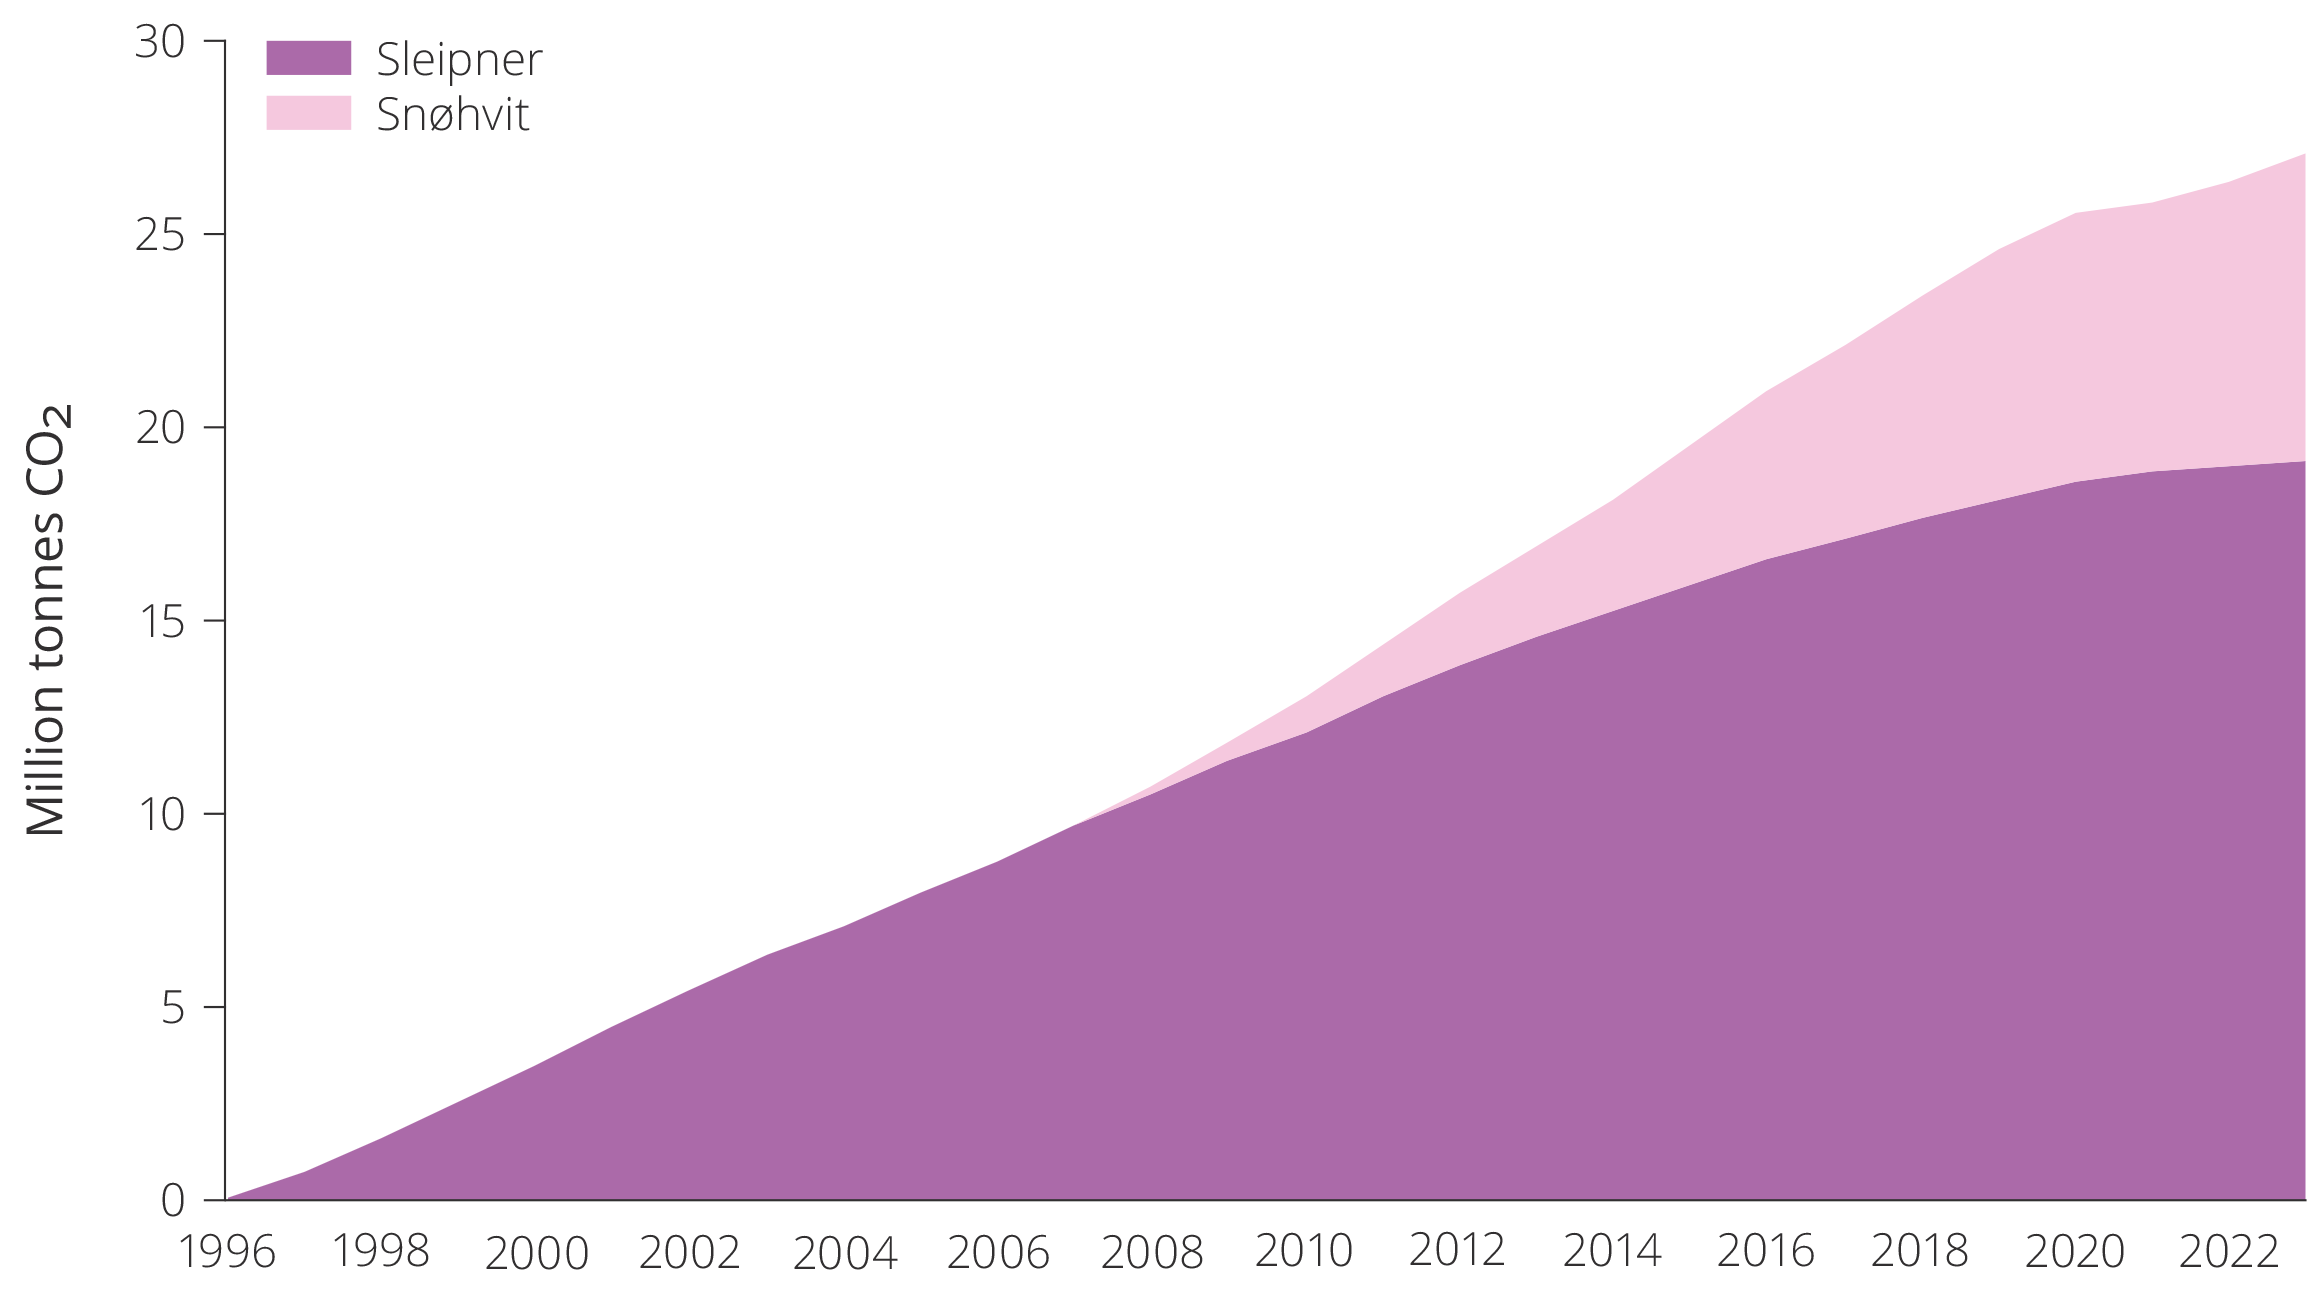
Cumulative CO2 storage on the NCS, 1996–2023.
By 2030, a total of 90 million tonnes of CO2 can be stored from fields, approved CO2 storage projects and projects currently in the planning stage.
With current plans, around 30 million tonnes of CO2 per year can be stored in the awarded exploration and exploitation licences, starting from 2030. This capacity will grow through the 2030s if more licences are awarded and capacity in the respective projects is expanded.
CO2 storage is still in an early phase
CCS is still in the early stages. Climate policy, particularly the CO2 price, is what determines whether or not an investment in CCS becomes profitable.
There are also coordination challenges linked to establishing a market for CCS. If no one captures CO2, no one will invest in CO2 storage. If no one establishes CO2 storage, no one will invest in CO2 capture. As this often involves different stakeholders, the authorities need to coordinate various forms of measures. Rapid award of storage acreage is one measure that could offset market failure associated with such network effects as discussed in chapter 3, market failure.
Both the open-door policy and terms and conditions imposed upon licensees when exploration licences are awarded according to the Storage Regulations can contribute to ensure fast and efficient maturing of awarded areas up to an investment decision and realisation of a CO2 storage site. Access to storage acreage makes it easier for industry players to develop and establish complex value changes with a lot of infrastructure.
Offshore wind
Norway has vast ocean areas with good wind conditions. The Government’s ambition of awarding acreage for 30 GW of offshore wind generation corresponds to nearly a doubling of total Norwegian power generation. The first areas on the NCS were opened for renewable offshore energy generation in 2020. Since then, the authorities have worked to stipulate regulations in close cooperation with both commercial and other users of the sea. The Norwegian Water Resources and Energy Directorate (NVE) assists the Ministry of Energy in establishing the framework for future development of offshore wind and follows up the work on a potential new management regime for renewable offshore energy generation.
In April 2023, a broad group of directorates led by NVE presented a report that identified 20 areas that are technically suited for offshore wind, and where conflicts with other stakeholders are presumably low(71) as illustrated in figure 7.2.
NVE will carry out a strategic impact assessment of these 20 areas in 2024 and 2025. The other directorates, including the Norwegian Offshore Directorate, will be involved in this work. Once the strategic impact assessment is complete, the Ministry of Energy will assess which areas can be opened.
The Norwegian Offshore Directorate will provide the Ministry with expert input on the responsible use of area identified and delineate zones where offshore wind interests do not reduce the value of petroleum and CO2 storage resources. These are also key considerations for the Directorate in conducting the strategic impact assessment of the 20 offshore wind areas. Dialogue and coordination between sectors at an early stage is essential for ensuring effective coexistence.
The Directorate has carried out subsurface surveys in the first phase of the Sørlige Nordsjø II and Utsira Nord projects, in advance of a potential development. The objective was to investigate whether the seabed is suitable for offshore wind installations. The wind turbines must be anchored to the seabed in a manner that can withstand extreme weather conditions. Development costs are high due to ocean depth and complex seabed conditions(72). Data from the subsurface surveys can be downloaded from Diskos(73).
The mapping carried out by the Norwegian Offshore Directorate can identify the suitability of the seabed (shifting, unevenness, stability), any large boulders on the seabed or gas pockets in the subsurface that could create instability. The mapping helps reduce risk and costs for offshore wind players and establish a shared basis of data for players that intend to apply for licences.
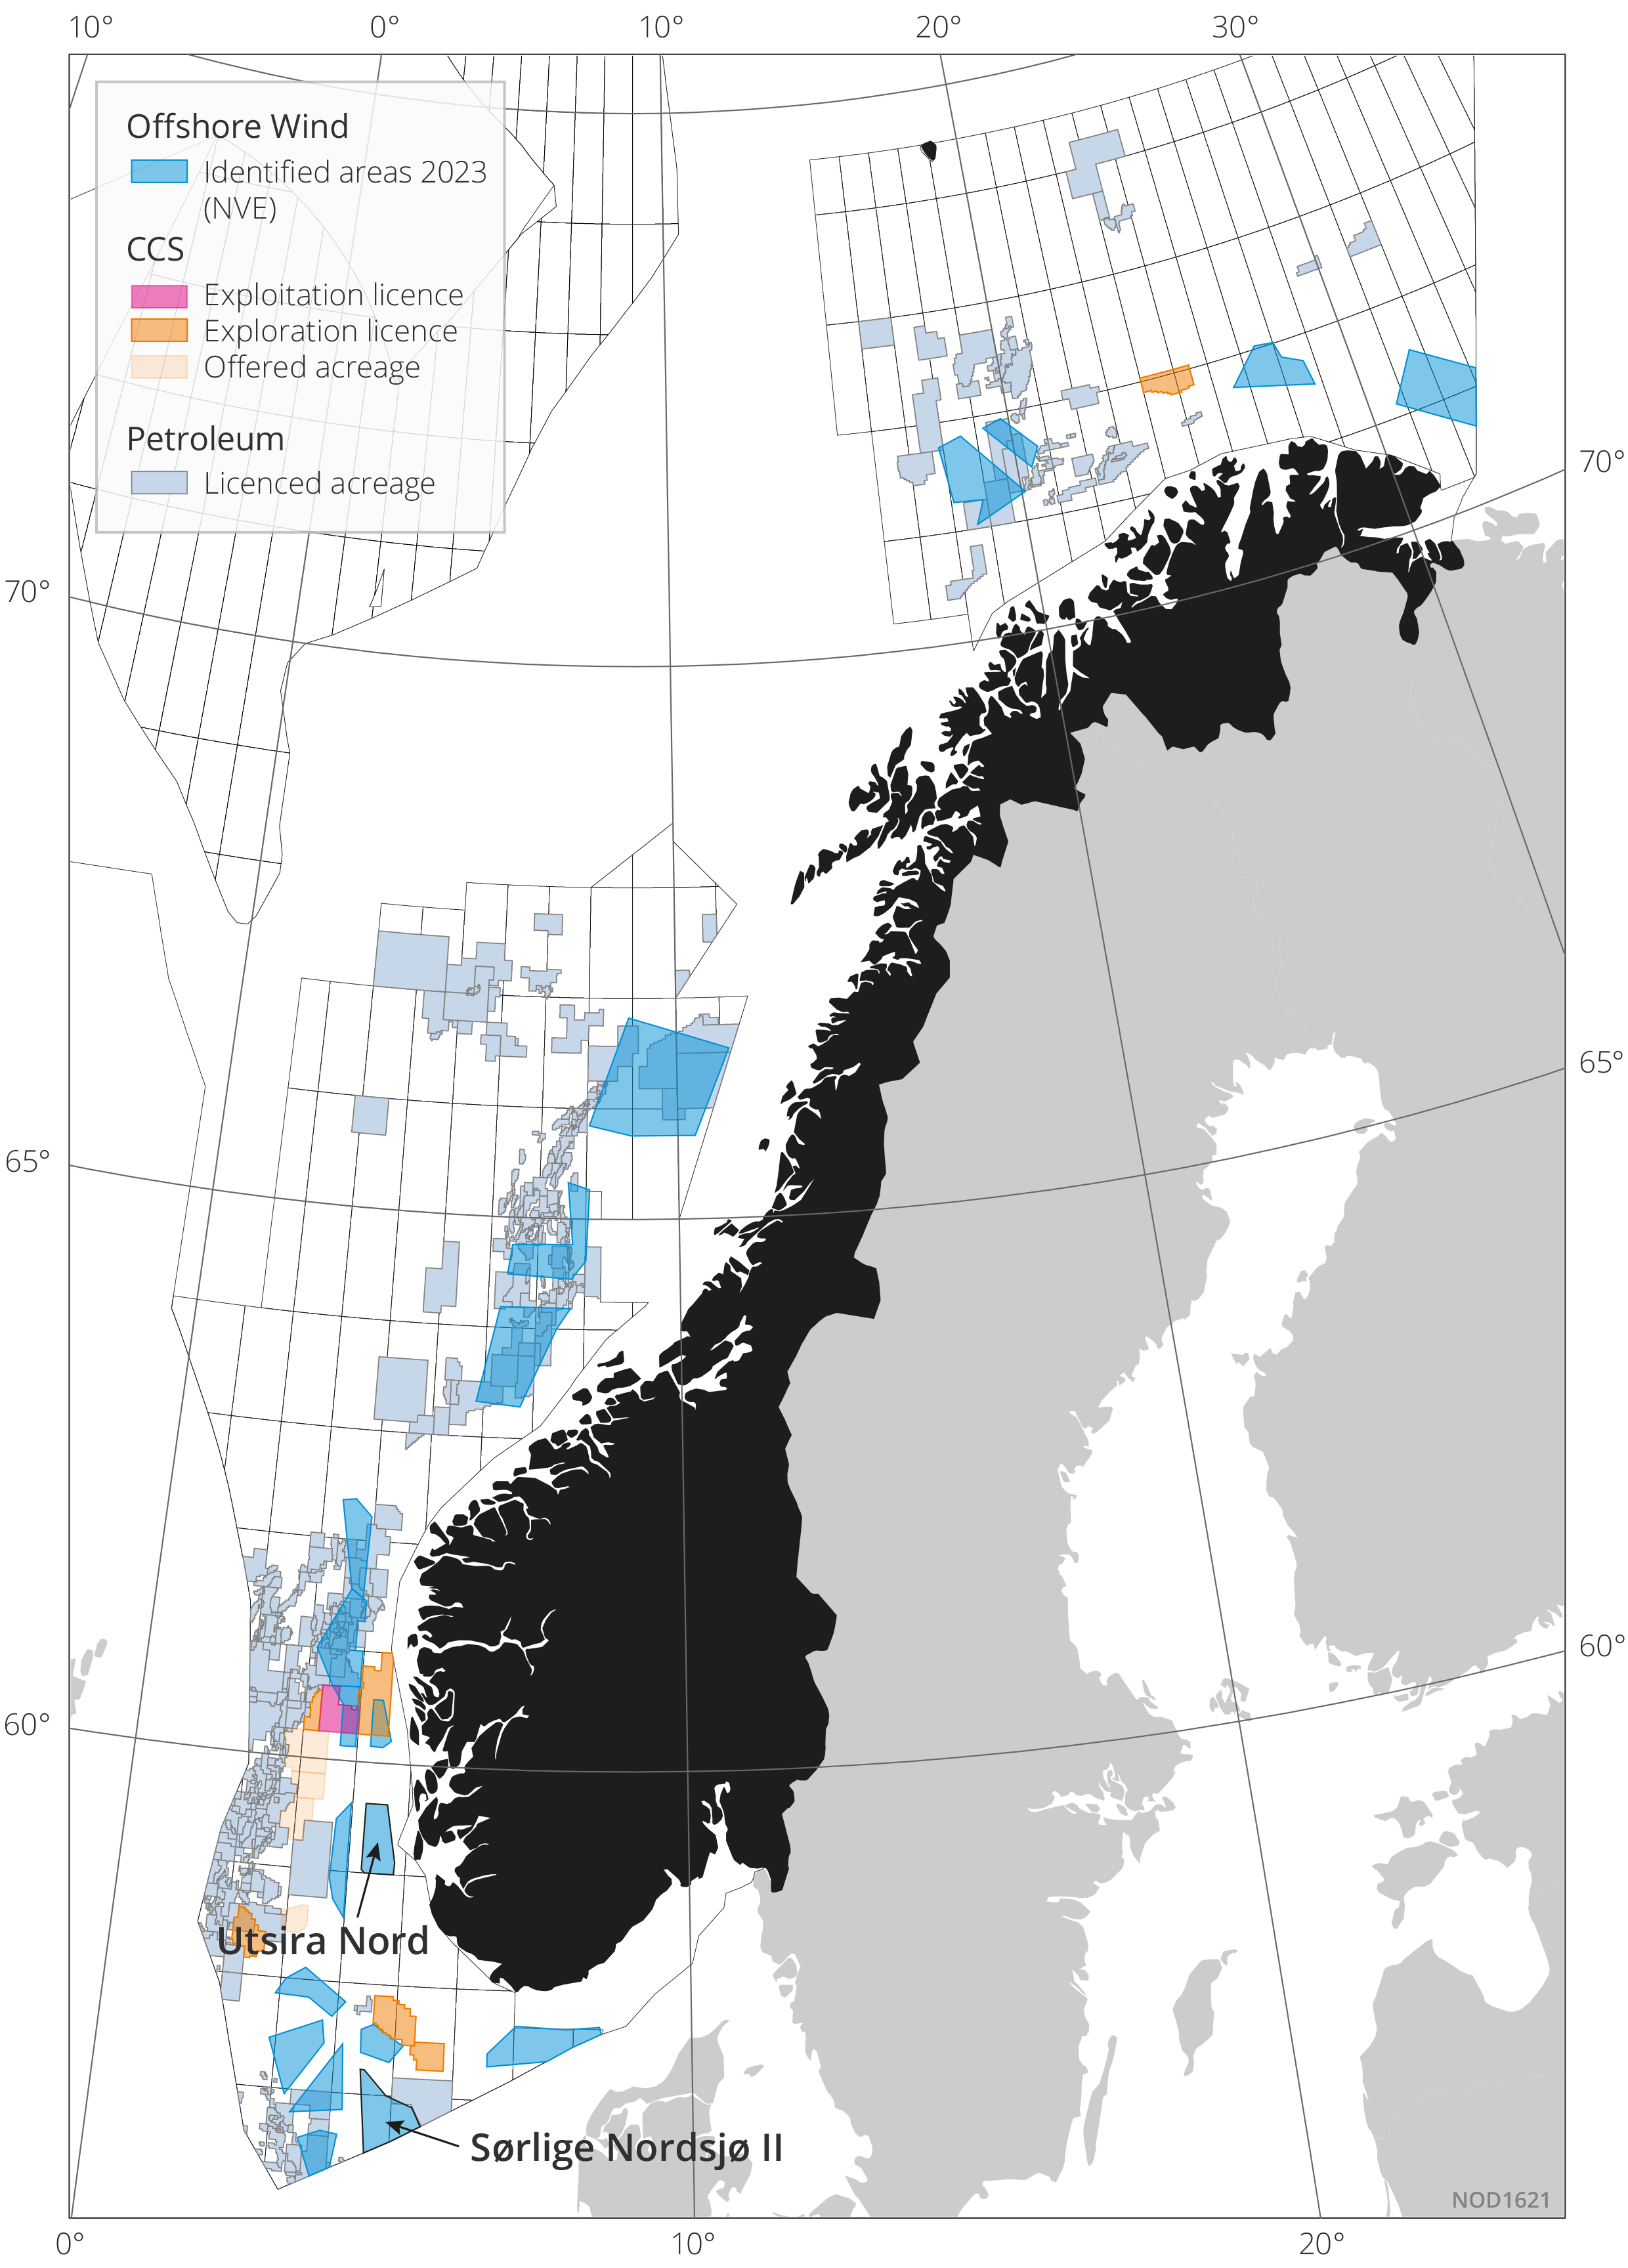
Figure 7.2 Map showing challenges of coexistence: CO2 licences are shown in orange and the 20 areas being considered for offshore wind in blue (Utsira Nord and Sørlige Nordsjø II should be noted). Petroleum licences are depicted in blue-grey.
DownloadReferences and notes
- Energy institute (2024): Statistical Review of World Energy 2024, 73rd edition European Commission (2023): European Wind Power Action Plan, COM (2023) 669 final, Brussels, 24 October 2023
- Resources for the Future (2024): Global Energy Outlook 2024: Peaks or Plateaus? Report 24-06, April 2024.Download: https://www.rff.org/publications/reports/global-energy-outlook-2024/
- The 30 largest upstream companies measured by revenue.
- IEA (2024): World Energy Investment 2024.Download: https://www.iea.org/reports/world-energy-investment-2024
- Davies, A. & M. D. Simmons (2021): Demand for ‘advantaged’ hydrocarbons during the 21st century energy transition, Energy Reports, Volume 7, November 2021, Pages 4483-4497. Download: https://www.researchgate.net/publication/353523390_Demand_for_'advantaged'_hydrocarbons_during_the_21st_century_energy_transition
- WoodMacKenzie (2023): Scraping the barrel: Is the world running out of high-quality oil and gas? Download: https://www.woodmac.com/horizons/shortage-of-quality-oil-and-gas/
- OG21 (2021): OG21 Strategy - A New Chapter.Download: https://www.og21.no/siteassets/figurer-og21-strategi-2021/og21-strategi_eng.pdf
- IEA (2023b): The Oil and Gas Industry in Net Zero Transitions. World Energy Outlook Special report. Download: https://www.iea.org/reports/the-oil-and-gas-industry-in-net-zero-transitions
- Norwegian Offshore Directorate (2024): Resource Accounts as per 31 Dec. 2023. Download: https://www.sodir.no/en/whats-new/publications/reports/resource-accounts/resource-accounts-2023/
- Norwegian Petroleum Directorate (2016): the Norwegian Petroleum Directorate's resource classification system. Download: https://www.sodir.no/globalassets/1-sodir/regelverk/tematiske-veiledninger/ressursklassifisering_e.pdf
- Norwegian Offshore Directorate (2024): Resource Accounts as per 31 Dec. 2023. Download: https://www.sodir.no/en/whats-new/publications/reports/resource-accounts/resource-accounts-2023/
- USGS: McKelvey Diagram. Download: https://www.usgs.gov/media/images/mckelvey-diagram
- In line with Matt Hall's approach. Matt Hall (2011): McKelvey’s reserves and resources. Download: https://agilescientific.com/blog/2011/10/18/mckelveys-reserves-and-resources.html
- Norwegian Petroleum Directorate (2022): Resource report 2022.Download: https://www.sodir.no/en/whats-new/publications/reports/resource-report/resource-report-2022/2-remaining-petroleum-resources/
- Ministry of Finance (2023): Utfordringer for lønnsdannelsen og norsk økonomi (Challenges for wage formation and the Norwegian economy). NOU 2023: 30.Download: https://www.regjeringen.no/no/dokumenter/nou-2023-30/id3018750/
- Ministry of Finance (2024): Karbonprisbaner for bruk av samfunnsøkonomiske analyser i 2024 (Carbon price trajectories for use in socio-economic analyses in 2024).Download: https://www.regjeringen.no/no/tema/okonomi-og-budsjett/statlig-okonomistyring/karbonprisbaner-for-bruk-i-samfunnsokonomiske-analyser-i-2024/id3020031/
- Hungnes, H., Midttun, S. and Strøm, B. (2022): Ringvirkninger av petroleumsnæringen i norsk økonomi: Basert på endelige nasjonalregnskapstall for 2020 (Ripple effects from the petroleum industry in the Norwegian economy: Based on final national account figures for 2020), Reports 2022/49, Statistics Norway. Download: https://kudos.dfo.no/documents/49025/files/31459.pdf
- Ministry of Finance (2023): Utfordringer for lønnsdannelsen og norsk økonomi (Challenges for wage formation and the Norwegian economy). NOU 2023: 30.Download: https://www.regjeringen.no/no/dokumenter/nou-2023-30/id3018750/
- Statistics Norway (2023): Få vendte tilbake til petroleumsnæringene etter oljekrisen i 2014 (Few returned to the petroleum industries following the 2014 oil crisis).Download: https://www.ssb.no/arbeid-og-lonn/sysselsetting/artikler/fa-vendte-tilbake-til-petroleumsnaeringene-etter-oljekrisen-i-2014
- Ministry of Finance (2023): Utfordringer for lønnsdannelsen og norsk økonomi (Challenges for wage formation and the Norwegian economy). NOU 2023: 30. Download: https://www.regjeringen.no/no/dokumenter/nou-2023-30/id3018750/
- Ministry of Energy (1996): Act relating to petroleum activities (the Petroleum Act). Download: https://www.sodir.no/en/regulations/acts/act-29-november-1996-no2.-72-relating-to-petroleum-activities/
- Ministry of Petroleum and Energy (2018): Sektorveileder i samfunnsøkonomiske analyser for petroleumssektoren (Sectoral guideline for socio-economic analyses for the petroleum sector). Download: https://www.regjeringen.no/contentassets/084f70863e66427ba9bb8c6426b3a377/sektorveileder-i-samfunnsokonomiske-analyser-for-petroleumssektoren.pdf
- Hagen, K.P. (1986): Velferdsteoretiske synspunkter på konkurranseformer (Welfare theory viewpoints on forms of competition), in “Markedsstruktur og konkurranse" (Market structures and competition), Brunstad, R.J. and Hope, E. (ed.), Bedriftsøkonomenes Forlag
- Sandmo, A. (1986): “Privatisering” (Privatisation), in “Markedsstruktur and competition" (Market structures and competition), Brunstad, R.J. and Hope, E. (ed.), Bedriftsøkonomenes Forlag
- Hagemann, F. (1998): Den geologiske utforskningen av den norske kontinentalsokkelen – hvem skulle ha ansvaret? (Geological exploration of the NCS - who was intended to be in charge?) Norwegian Petroleum Museum annual 1998. Download: https://www.norskolje.museum.no/wp-content/uploads/2016/02/388_3ccc4717cb12449b8193ebeaa78a92aa.pdf
- Osmundsen, P. (2013): Økt oljeutvinning fra eksisterende felt (Improved oil recovery from existing fields), Magma, Vol 16 No. 3. Download: https://magmaforskning.econa.no/index.php/magma/article/view/813
- Office of the Auditor General (2015): Riksrevisjonens undersøkelse av myndighetenes arbeid for økt oljeutvinning fra modne områder på norsk kontinentalsokkel (Office of the Auditor General's investigation of the authorities' efforts to stimulate improved oil recovery from mature areas on the Norwegian continental shelf). Document 3:6 (2014–2015). Download: https://www.riksrevisjonen.no/globalassets/rapporter/no-2014-2015/oljeutvinningkontinentalsokkel.pdf
- Ministry of Energy (2005): Regulations relating to the use of facilities by others. Download: https://www.sodir.no/en/regulations/regulations/facilities-use-by-others/
- Osmundsen, P. & A. Wittemann (2024): Petroleum development projects. Concept selection, taxation and recovery rate, Resources Policy, Volume 95, August 2024
- Ministry of Finance (2020): Innst. 351 L (2019–2020)- Midlertidige endringer i petroleumsskatteloven (Recommendation [bill] No. 351 L (2019-2020) - Temporary changes in the Petroleum Tax Act). Prop. 113 L (2019–2020) (Proposition [bill] No 113 L (2019-2020)). Download: https://www.regjeringen.no/no/dokumenter/prop.-113-l-20192020/id2701992/ and https://www.stortinget.no/no/Saker-og-publikasjoner/Publikasjoner/Innstillinger/Stortinget/2019-2020/inns-201920-351l/?all=true
- Norwegian Petroleum Directorate (2019): Resource report 2019 - Discoveries and fields.Download: https://www.sodir.no/en/whats-new/publications/reports/resource-report/resource-report-2019/
- Norwegian Petroleum Directorate (2017): Resource report 2017 - Big oppertunities. Download: https://www.sodir.no/en/whats-new/publications/reports/resource-report/resource-report-2017/
- Norwegian Petroleum Directorate (2017): Barents Sea North 2017 - Geological assessment of petroleum resources in eastern parts of the Barents Sea North. Download: https://www.sodir.no/en/whats-new/publications/reports/older-reports/barents-sea-north-2017/geological-assessment-of-petroleum-resources-in-eastern-parts-of-barents-sea-north-2017/
- Lundschien, B.A, R. Mattingsdal, S. K. Johansen & S.-M. Knutsen (2024): North Barents Composite Tectono-Sedimentary Element, Geological Society, London, Memoirs Volume 57, December 2024
- Cuddington, J.T, & D.L. Moss (2001): Technological Change, Depletion, and the U.S. Petroleum Industry, American Economic Review, Vol 91, No 4, September 2001
- There are considerable similarities between research and exploration activity. This has been pointed out by Maurice Adelman, among others: “The French have a feeling for words, and when they use recherche to mean both research and exploration, they are conveying a truth we cannot afford to overlook”: Adelman, M.A. (1993): The Economics of Petroleum Supply. Cambridge: The MIT Press, 1993.
- Norwegian Offshore Directorate (2024): Large area with new released datasets in the Barents Sea. Download: https://www.sodir.no/en/whats-new/news/general-news/2024/large-area-with-new-released-datasets-in-the-barents-sea/
- OG21 (2021): OG21 Strategy - A New Chapter.Download: https://www.og21.no/strategi-og-analyser/og21-strategien-2021/Download
- Norwegian Petroleum Directorate (2019): Teknologibruk og myndighetsinvolvering (Use of technology and authority involvement).
- Menon Economics (2023): Verdien av Oljedirektoratets data (The value of the Norwegian Petroleum Directorate's data), Menon publication no 30/2023. Download: https://www.menon.no/wp-content/uploads/2023-30-Verdien-av-Oljedirektoratets-data-1.pdf
- Martinsen, I., D. Wade, B. Ricaud & F. Godtliebsen (2024): The 3-billion fossil question: How to automate classification of microfossils, Artificial Intelligence in Geosciences Volume 5, December 2024, 100080
- Hoel, M. (2022): Historisk lønnsomhet (Historical profitability). Report 2022/45, Vista Analyse. Download: https://www.vista-analyse.no/en/publications/historisk-lonnsomhet-i-petroleumssektoren/
- Apeland, S., B. Aarhus, Ø. H. Rossebø, (2012): NCS2020 - En studie av fremtidens gassinfrastruktur (NCS2020 - A study of the gas infrastructure of the future), Gassco, 2012. Download: https://www.sintef.no/globalassets/project/trondheim_gts/documents/ncs2020.pdf
- Gassco (2014) Barents Sea Gas Infrastructure. Download: https://gassco.eu/wp-content/uploads/2023/04/099808.pdf
- Gassco (2020): Vurdering av gasstransportalternativer i Barentshavet sør (Assessment of gas transport alternatives in the Barents Sea South). Download: https://gassco.eu/wp-content/uploads/2023/04/rapport_bsgi.pdf
- Gassco (2023): Vurdering av gasstransportalternativer fra Barentshavet sør (Assessment of gas transport alternatives from the Barents Sea South). Download: https://www.regjeringen.no/contentassets/39fd87433a4f4c6ba92d1da8d8d4e95d/barentshavet-vurderinger-og-observasjoner-2023.pdf
- In this context, petroleum activity is defined as activity covered by the petroleum tax regulations. Beyond this, we have included emissions from the onshore part of Kårstø here, thereby including all emissions from the plant at Kårstø.
- Norwegian Environment Agency (2023): Miljøstatus - Klimagassutslipp fra olje- og gassutvinning (Environmental status - Greenhouse gas emissions from oil and gas production). Download: https://miljostatus.miljodirektoratet.no/tema/klima/norske-utslipp-av-klimagasser/klimagassutslipp-fra-olje--og-gassutvinning/
- Petroleum-related emissions associated with mobile facilities are emissions in connection with petroleum-related activity such as drilling, well intervention or when a mobile living quarters is active on a field. Emissions in connection with transporting the facilities are not included.
- Norwegian Environment Agency (2023): Miljøstatus – Klima (Environmental status - Climate). Download: https://www.environment.no/topics/climate/
- Norwegian Government (2021): Hurdal Platform. Download: https://www.regjeringen.no/contentassets/cb0adb6c6fee428caa81bd5b339501b0/no/pdfs/hurdalsplattformen.pdf
- Ministry of Finance (2020): Innst. 351 L (2019–2020)- Midlertidige endringer i petroleumsskatteloven (Recommendation [bill] No. 351 L (2019-2020) - Temporary changes in the Petroleum Tax Act). Prop. 113 L (2019–2020) (Proposition [bill] No 113 L (2019-2020)). Resolution 684. Download: https://www.stortinget.no/no/Saker-og-publikasjoner/Vedtak/Vedtak/Sak/?p=79780
- Konkraft (2024): Framtidens energinæring på norsk sokkel - statusrapport 2024 (Future energy system on the NCS - status report 2024).Download: https://www.konkraft.no/contentassets/aa0d6a1dab1747e58b1f988d5ffde3c2/statusrapport-2024.pdf
- Ministry of Finance (2024): Meld. St. 2 (2023-2024) - Revidert nasjonalbudsjett 2024 (Report No. 2 to the Storting (2023-2024) - Revised National Budget 2024), page 71. initial. Download: https://www.regjeringen.no/contentassets/3bf18a4b53f441429f665a5acabfc210/no/pdfs/stm202320240002000dddpdfs.pdf
- Norwegian Government (2021): Hurdal Platform. Download: https://www.regjeringen.no/contentassets/cb0adb6c6fee428caa81bd5b339501b0/no/pdfs/hurdalsplattformen.pdf
- Contact Enova. Download: Press | Enova
- GoliatVIND. Download: GoliatVIND | GoliatVind
- Ministry of Energy (2010): Lov om fornybar energiproduksjon til havs (havenergilova) (Act relating to renewable energy generation offshore (Offshore Energy Act). Download: https://lovdata.no/dokument/NL/lov/2010-06-04-21/
- Ministry of Petroleum and Energy (2021): Meld. St. 36 (2020–2021) - Energi til arbeid – langsiktig verdiskaping fra norske energiressurser (Report No. 36 to the Storting (2020-2021) – Energy at work: Long-term value creation from Norwegian energy resources). Download: https://www.regjeringen.no/no/dokumenter/meld.-st.-36-20202021/id2860081/
- OG21 (2022): Nye OG21 rapporter om lavutslippsteknologi. (New OG21 reports on low- emission technology) Download: https://www.og21.no/en/news2/nye-og21-rapporter-om-lavutslippsteknologi/
- Norwegian Environment Agency (2024): Klimatiltak i Norge. Kunnskapsgrunnlag 2024 (Climate initiatives in Norway. Knowledge base 2024). Download: https://www.miljodirektoratet.no/publikasjoner/2024/april-2024/klimatiltak-i-norge-kunnskapsgrunnlag-2024/
- Ministry of Climate and Environment (2023): Prop. 1 S (2023–2024). Særskilt vedlegg til Prop. 1 S (2023–2024) (Proposition [resolution] No. 1 S (2023-2024). Special appendix to Proposition [resolution] No. 1 S (2023-2024)). Regjeringas klimastatus og -plan (Grønn bok) (The Government's climate status and plan (Green Book)), page 81. Download: https://www.regjeringen.no/contentassets/28965e11d8044ceb94d0f958b8a45869/nn-no/pdfs/regjeringas_klimastatus_og_-plan.pdf
- Ministry of Energy (2019): Lov om mineralvirksomhet på kontinentalsokkelen (havbunnsmineralloven) (Act relating to mineral activities on the continental shelf (Seabed Minerals Act). Download: https://www.sodir.no/en/regulations/acts/act-relating-to-mineral-activities-on-the-continental-shelf-seabed-minerals-act/
- Ministry of Petroleum and Energy (2018): Prop. 106 L (2017–2018) (Proposition [bill] No. 106 L (2017-2018). Lov om mineralvirksomhet på kontinentalsokkelen (havbunnsmineralloven) (Act relating to mineral activities on the continental shelf (Seabed Minerals Act), page 26. Download: https://www.regjeringen.no/no/dokumenter/prop.-106-l-20172018/id2605252/, page 26Ministry of Petroleum and Energy (2023): Meld. St. 25 (2022-2023) - Mineralverksemd på norsk kontinentalsokkel – opning av areal og strategi for forvaltning av ressursane (Report No. 25 to the Storting (2022-2023) - Mineral activity on the Norwegian continental shelf - opening acreage and strategy for managing the resources), page 73. Download: https://www.regjeringen.no/contentassets/e0d0706a51274b598e4ef832545e59d3/nn-no/pdfs/stm202220230025000dddpdfs.pdf
- Norwegian Petroleum Directorate (2023): Ressursvurdering havbunnsmineraler. Utarbeidet på oppdrag for Olje- og energidepartementet (Resource assessment for seabed minerals. Prepared on assignment from the Ministry of Petroleum and Energy), January 2023. Download: https://www.sodir.no/globalassets/1-sodir/fakta/havbunnsmineraler/publikasjoner/2023/ressursvurdering-havbunnsmineraler-20230127.pdf
- Stortinget [Norwegian parliament] (2024): Innst. 162 S (2023–2024) Innstilling fra energi- og miljøkomiteen om Mineralverksemd på norsk kontinentalsokkel – opning av areal og strategi for forvaltning av ressursane (Recommendation [resolution] No. 162 S (2023-2024) - Recommendation from the Standing Committee on Energy and the Environment on mineral activity on the Norwegian continental shelf - opening acreage and strategy for managing the resources). Download: https://www.stortinget.no/no/Saker-og-publikasjoner/Saker/Sak/?p=94807 and Ministry of Petroleum and Energy (2023): Meld. St. 25 (2022-2023) - Mineralverksemd på norsk kontinentalsokkel – opning av areal og strategi for forvaltning av ressursane (Report No. 25 to the Storting (2022-2023) - Mineral activity on the Norwegian continental shelf - opening acreage and strategy for managing the resources). Download: https://www.regjeringen.no/contentassets/e0d0706a51274b598e4ef832545e59d3/nn-no/pdfs/stm202220230025000dddpdfs.pdf
- Norwegian Offshore Directorate (2024): Publications – CO2 atlases.Download: https://www.sodir.no/en/whats-new/publications/co2-atlases/
- Norwegian Government (2024): Press release - Norway leads the way in offering commercial CO2 storage. Download: https://www.regjeringen.no/en/aktuelt/norway-leads-the-way-in-offering-commercial-co2-storage/id3037033/
- Ministry of Energy (2014): Regulation relating to exploitation of subsea reservoirs on the continental shelf to store CO2 and relating to transport of CO2 on the continental shelf. Download: https://www.sodir.no/en/regulations/regulations/exploitation-of-subsea-reservoirs-on-the-continental-shelf-for-storage-of-and-transportation-of-co/
- Applications for licences to store CO2 in geological formations are also governed by Chapter 35 of the Regulations relating to pollution control (Pollution Control Regulations). Download: https://lovdata.no/dokument/SF/forskrift/2004-06-01-931/
- Norwegian Water Resources and Energy Directorate (2023): Identifisering av utredningsområder for havvind (Identifying impact assessment areas for offshore wind). Download: https://www.nve.no/nytt-fra-nve/nyheter-energi/foreslaar-aa-utrede-disse-20-omraadene-for-havvind/
- Østenby, A.M. (2019): Dybde og kompliserte bunnforhold gjør havvind i Norge dyrere enn i Europa (Depth and complex seabed conditions make offshore wind in Norway more expensive than in Europe). NVE Energy Department, Fakta No 15/2019, Technology analyses 2019. Download: https://publikasjoner.nve.no/faktaark/2019/faktaark2019_15.pdf
- This applies for surveys NPD22100, NPD23100 and NPD23101. Each survey contains seven data types, in addition to interpretation reports. Download: https://www.diskos.com/