
Remaining resources
Remaining resources provide a basis for long-term production
The remaining resources are the foundation for significant production and value creation for a long time to come. Increased exploration activity, the development of more discoveries and improved recovery will all help maintain production.
In this chapter:
- Managing the petroleum resources
- Reserves and challenges in fields
- Several measures can yield improved recovery
- Resources and challenges in discoveries
- Exploration builds the foundation for long-term production
One of the Norwegian Offshore Directorate's most important responsibilities is to maintain an overview of the remaining petroleum resources, in order to ensure that the authorities and players have the best possible factual and knowledge basis. This contributes to learning, sound resource management and good decisions that can help to maintain exploration activity and production over the years to come.
The Norwegian Offshore Directorate's estimate of the total remaining resources on the NCS is about 7.1 billion scm oe. Of the remaining resources about 3.6 billion scm oe are reserves and resources in discoveries and fields, while about 3.5 billion scm oe are undiscovered resources. About 60 per cent of these resources are in opened areas.
Figure 5.1 shows the remaining resources and distribution between discovered and undiscovered resources in opened and unopened areas, respectively, for the three regions.
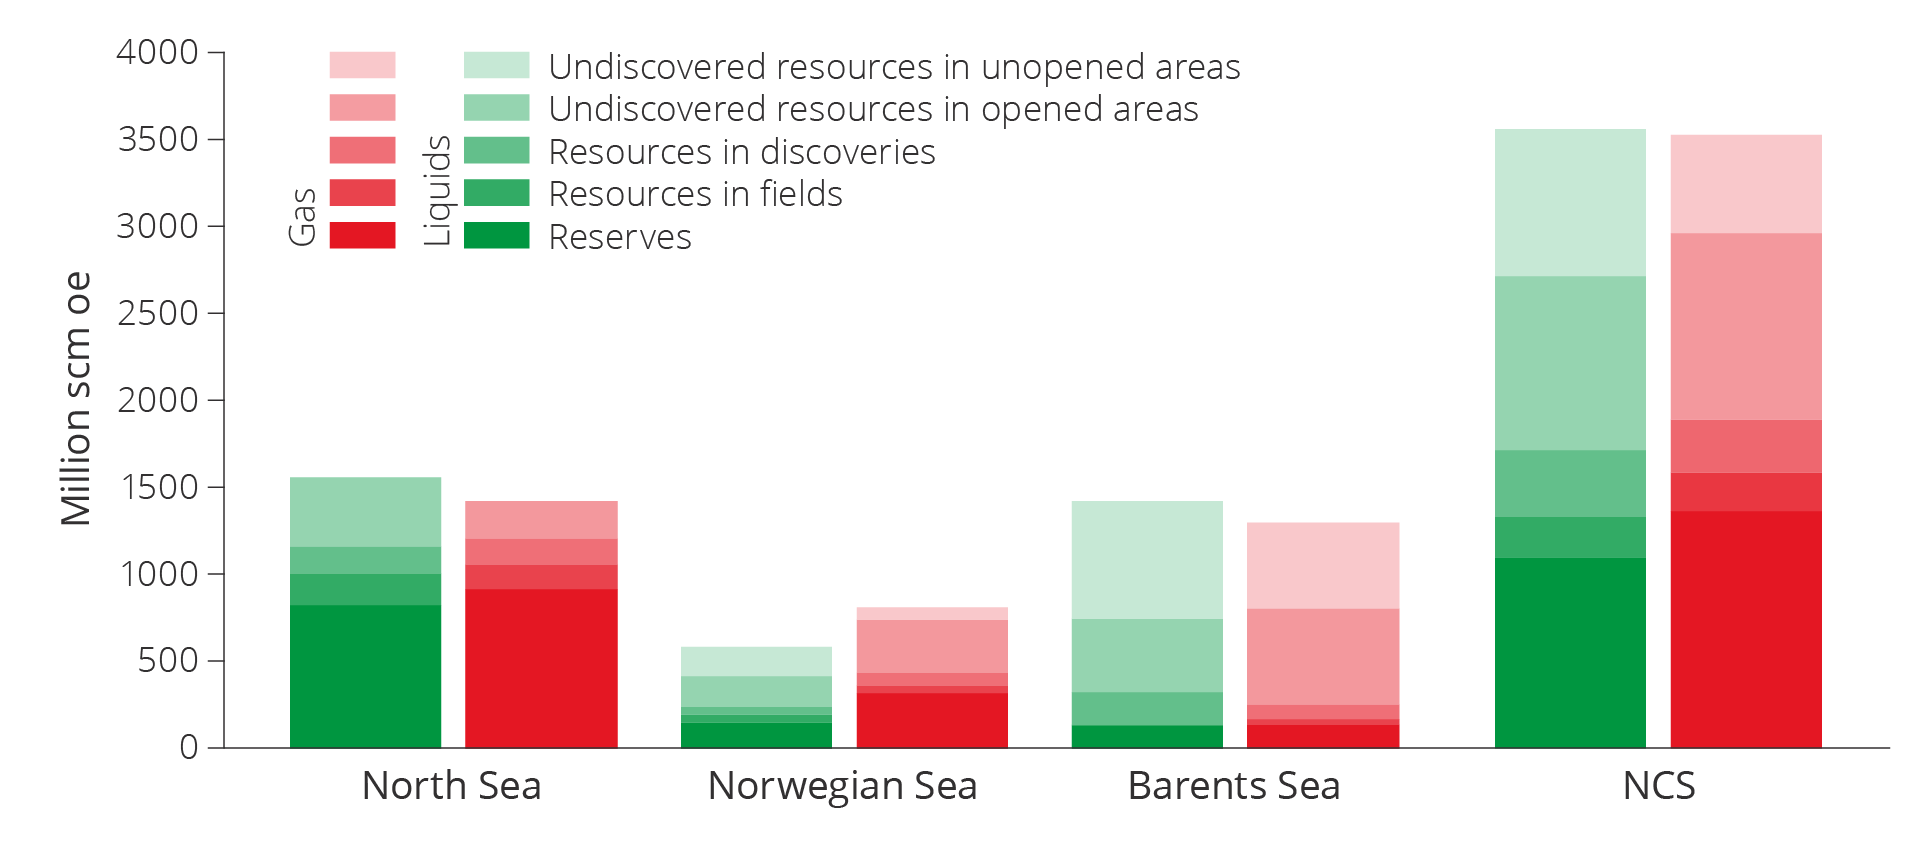
Figure 5.1 Total remaining petroleum resources distributed between liquids and gas, resource classes and regions on the NCS as per 31 December 2023.
Since it has been the centre of activity the longest, most experience and information is from the North Sea. Here, the majority of liquids and gas, about 60 per cent, is defined as reserves. This means that they are subject to approved recovery plans; see resource classification in chapter 3.
In the Norwegian Sea, undiscovered resources account for just over 50 per cent of remaining resources.
Undiscovered resources also account for the largest share in the Barents Sea. About 80 per cent of the remaining liquids and gas resources in the Barents Sea have yet to be discovered. Large areas in the Barents Sea remain closed for petroleum activity, and these areas are presumed to be home to about 50 per cent of the undiscovered resources in the Barents Sea.
The total remaining resources constitute a basis for oil and gas production for many years to come, as highlighted in figures 3.6 and 4.3.
In order for the NCS to maintain production at a high level, it is important that the companies invest to curtail the expected decline in production. The authorities acting as a driving force for comprehensive and long-term solutions can serve as a guarantee for decisions that contribute to sound resource management.
Managing the petroleum resources
The Petroleum Act(21) stipulates that the Norwegian State has the proprietary right to subsea petroleum accumulations and the exclusive right to resource management. Resource management of petroleum resources shall be carried out with a long-term perspective for the benefit of the Norwegian society as a whole.
Oil and gas resources are not renewable, and the activities are capital-intensive and take a long-term perspective. This is why one of the authorities' primary missions is, as resource owner and regulator, to establish and maintain a framework for the activities. This framework shall help ensure that the oil companies have a self-interest in utilising oil and gas resources in the best interests of the broader society.
However, the companies' and society's financial assessments do not always align(22). This is called market failure(23). These are instances where government measures may help ensure that resources are put to better use for the broader society. The fact box below shows selected examples of market failures that may occur in the petroleum sector, and which create a need for government measures.
Regulation of the petroleum activities seeks to take into consideration the most important forms of market failure and is designed to yield the best possible overlap between the companies' decisions and the authorities' interests.
Market failure in the petroleum sector
Market failure comes in different varieties in the petroleum sector. The authorities regulate, correct or influence the companies' decisions to ensure that they coincide with what is best for the broader society. The most common forms of market failure within the petroleum activities are described below.
Public goods(24) or shared goods are goods with the following properties:
1) Non-exclusivity, which means that no-one can be prevented from consuming the good; and 2) non-rivalry, which means that one person's consumption of the good does not diminish another person's consumption of the same good. When it is not possible to exclude others from using the good, it is difficult to establish a market for this good. No-one will be willing to pay for a good they have access to regardless. Neither will anyone be willing to invest in a good that everyone will have access to.
The value of the public good for society exceeds the companies' willingness to pay. This means that authority intervention to ensure that public goods can be produced may be in society's best interest.
One example is publicly available data and information about the geology on the NCS. Another example is government support for research and development (R&D). If the authorities do not take an active role, there will be insufficient research and not enough geodata will be collected. It is also important that the authorities, as resource owner, are as familiar as possible with the opportunities in place on the shelf(25).
Positive external effects are advantages from a company's activity or investments, which the company does not take into account in its decisions. Examples include investments in R&D or exploration that generate new knowledge. Others will benefit from this knowledge without the company receiving compensation. This could indicate regulation and/or government support.
Increased R&D efforts or exploration can also be stimulated through other types of policy instruments, such as patents or disclosure rules associated with sharing geological information. Such arrangements ensure that the party that develops a new solution or makes a new discovery is protected from early imitation efforts and others enriching themselves on the basis of their ideas. The disadvantage here is that this prevents the dissemination of important information or technologies.
Testing new technology, such as an EOR pilot (enhanced oil recovery), is also a variant of positive external effects. Technology tested by licensees in a production licence has positive effects for other production licences.
Network effects: Positive network effects will arise when a company's purchase of a good increases the benefit for all other buyers of this good. This can be a direct effect: The more users of a video-conferencing platform, the better this will be for all users of the platform. It can also be an indirect effect. One example is carbon capture from power plants and industry where the benefit for the individual company depends on access to infrastructure to transport and store CO2.
The point is that a company will benefit from other companies using the same type of technology. Positive values will be created beyond what the individual company will take into account. If the new technology is socio-economically profitable, this indicates that the government, during a transitional period, can take a coordinating role and contribute to ensure the establishment of an adequate number of users of this technology. One example of this is awarding storage opportunities for CO2 that can accelerate the capture and transport of CO2.
Negative external effects: Petroleum activity has disadvantages that the oil companies are not necessarily incentivised to take into account in their profitability calculations. This could involve pollution to sea, the seabed and coastal zone, as well as greenhouse gas emissions and other emissions to air.
If the oil companies are not held accountable for the socio-economic cost of their emissions, this will entail higher emissions than what is socio-economically acceptable. This can be avoided by employing environmental taxes and credit trading, thus ensuring that the companies include the societal disadvantages in their own cost assessments.
Petroleum activity can also lead to disadvantages for other commercial activity.
Lack of ownership of petroleum resources in the vicinity of their own production licences can entail that the companies' proposed solutions are not necessarily in the best interest of society. For example, this could result in the companies disregarding coordinated developments that would yield economies of scale and thus lower overall development costs.
A lack of area perspective and coordination across licence boundaries can also be caused by the players having different information about resources and costs. Different access to information relevant for decision-making can create a basis for different adaptation and strategic behaviour that could prevent profitable projects from being implemented.
Imperfect capital markets: Lack of or asymmetrical information about profitability in projects can also result in potential lenders not giving access to sufficient capital. In a capital market, the lender will generally have less information about profitability factors and creditworthiness than the borrower. This means that an investor or creditor could assess the risk as higher than it actually is, which leads to high interest rates or rejected loan applications. This can also contribute to less exploration and R&D than what is best for the broader society.
Economies of scale and market power: Both fields and transport infrastructure have economies of scale, which means that unit costs will falls alongside increasing production capacity. It is efficient to coordinate production and transport in order to utilise the advantages of large units. One disadvantage here is that large units can utilise their size and market power e.g. by demanding high prices for processing and transport. In such instances, there may be a need for government regulation. In the petroleum sector, this regulation takes place through regulated access to gas infrastructure and through the TPA Regulations (Regulations relating to the use of facilities by others).
Lack of long-term perspective in the licensees' decisions can entail that the companies have higher required rates of return than what is used in socio-economic analyses. Required rate of return means the minimum compensation the company needs to invest in a new project. The company will require higher return for high risk and lower return for low risk. The State will usually perceive the risk as lower than the companies since the State owns more projects with variable risks. Future opportunities will be valued lower by the companies than the State due to the higher required rate of return, for example exploration opportunities.
Absolute profit requirements: Internal capacity restrictions in the companies or restrictions in other markets such as capital or labour markets can result in an absolute profit requirements in projects. One such requirement could be a minimum requirement for the project's net present value after tax. This could lead the companies to de-prioritise socio-economically profitable projects on the NCS because they have projects with higher profitability in other petroleum provinces.
All these factors could cause the companies' decisions to lead to solutions other than what most benefits the broader society. This could result in lower exploration, fewer improved recovery projects and lower production than what is socio-economically profitable.
The companies' decisions and possible market failures can be linked to different phases, from exploration to decommissioning. In this chapter, these decisions concerning remaining resources, are split between the resource categories reserves, resources in fields, resources in discoveries and undiscovered resources.
Reserves and challenges in fields
At the start of 2024, there were 92 producing fields; 67 of which were in the North Sea, 23 in the Norwegian Sea and 2 in the Barents Sea.
Petroleum production on the NCS maintained a stable, high level in 2023. Oil production was at the highest level since 2010, while gas production declined somewhat from record-high levels in 2022.
The production of petroleum has increased each year since 2020 as shown in figure 5.2. Petroleum production is expected to increase in 2024. According to estimates, the level in 2025 will be the highest since 2006.
Total production from reserves in existing fields is expected to decline after 2025, in line with depletion and pressure drop in reservoirs. Based on current knowledge, production from operating fields is expected to drop by more than half during the period through and including 2033.
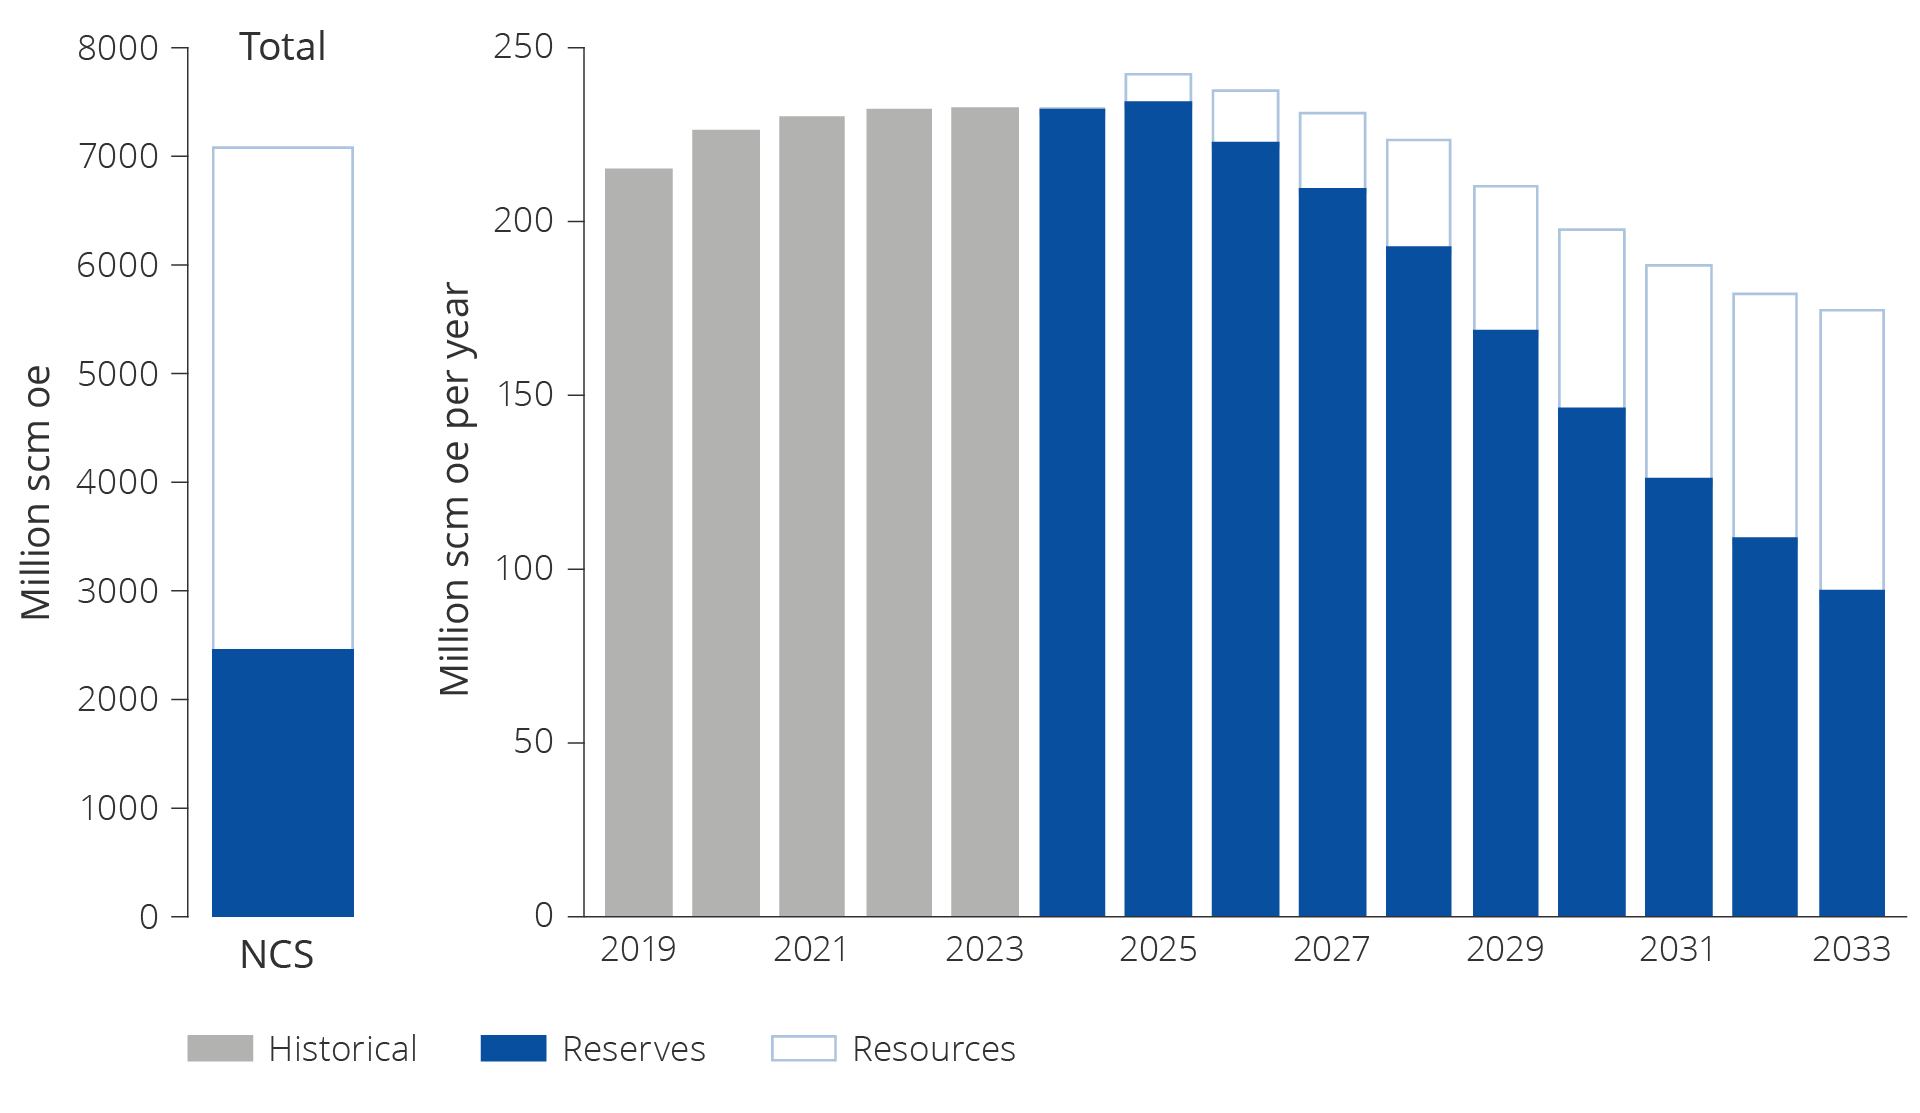
Figure 5.2 Remaining reserves. Historical total production 2019-2023 and expected future production from reserves 2024–2033.
A number of plans for development and operation (PDOs) were submitted to the Ministry in 2022 and processed in 2023, illustrated in figure 3.3 and described in the fact box on plans for development and operation (PDOs). All of these plans were approved by the authorities and are now included in expected future production from reserves in figure 5.2.
This major increase in the number of PDOs in 2023 was primarily caused by the temporary changes in the petroleum tax, further described in the fact box on the temporary changes to the Petroleum Tax Act adopted in June 2020. These changes in taxation have facilitated the realisation of more developments, with earlier production than would otherwise have been the case. These development projects will help ensure that production can remain relatively high over the next few years. Several projects are also facilitating power from shore, in order to reduce CO2 emissions from production.
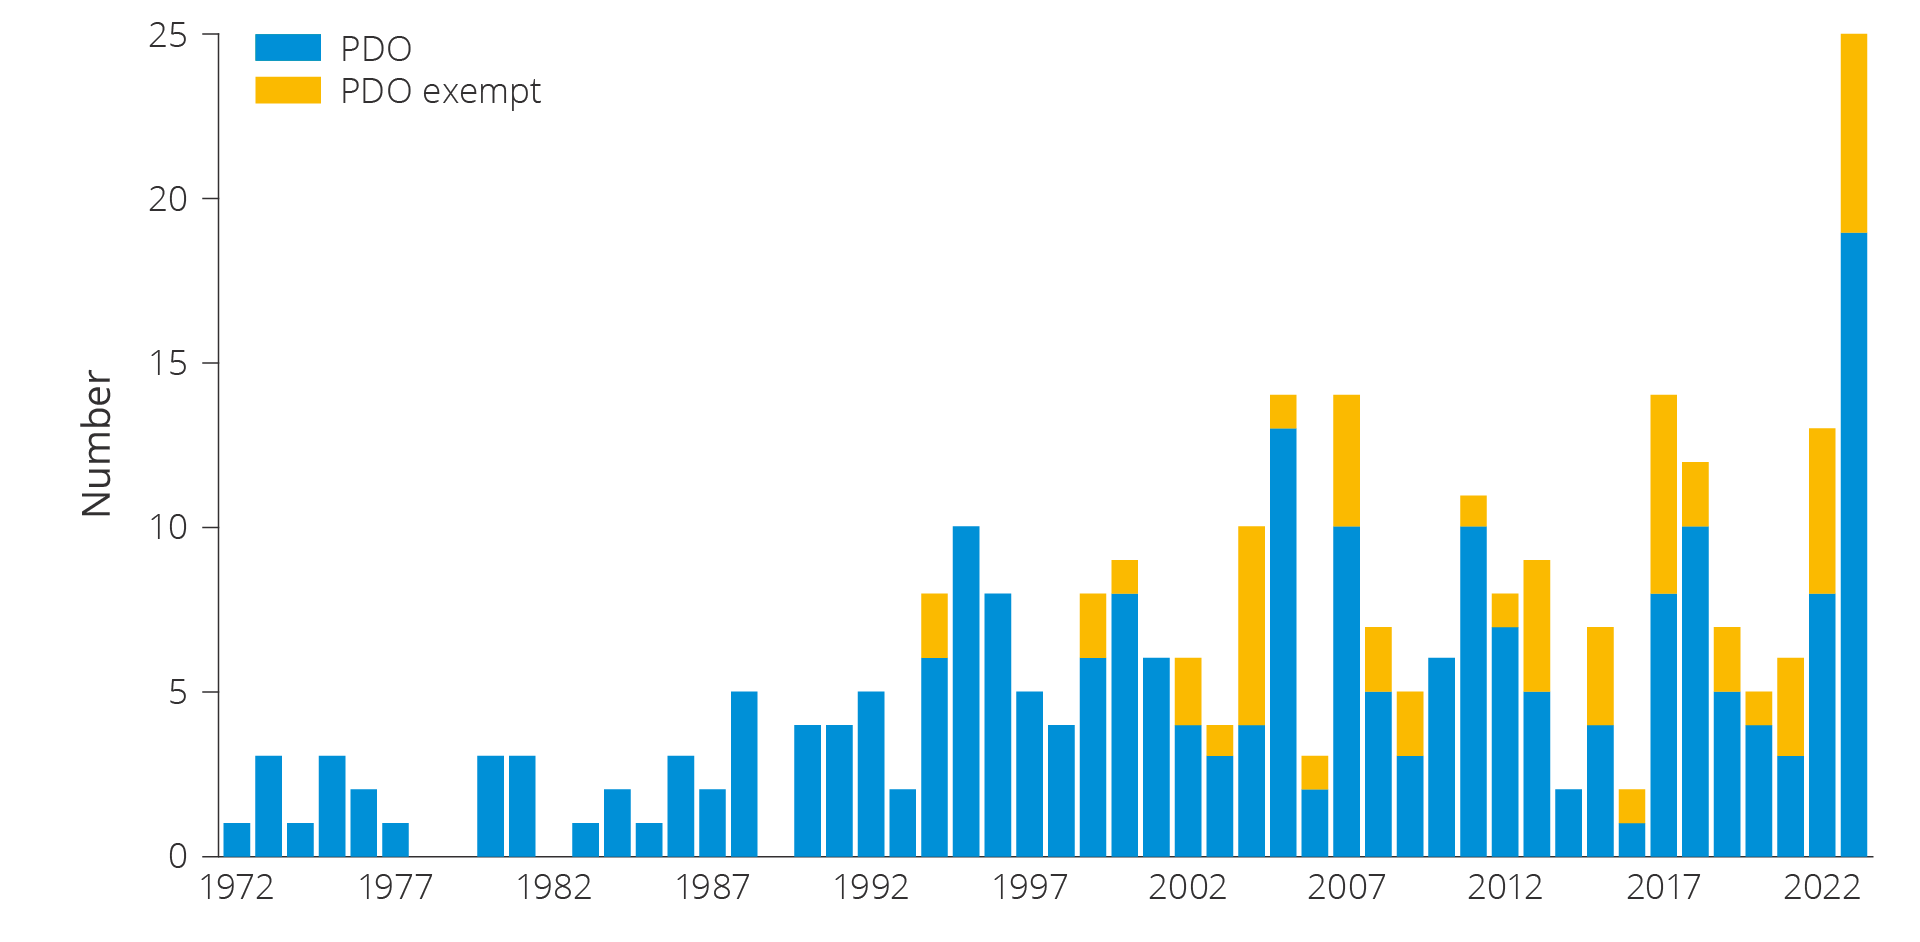
Figure 5.3 Approved plans for development and operation (PDOs) and PDO exempts in 2023.
Plans for development and operation (PDOs)
Before licensees can develop one or more discoveries, the authorities need to approve a plan for development and operation (PDO).
A PDO consists of a development part, which covers the development of the discovery or discoveries, and an impact assessment part, which covers the impacts the development will have. Developments can be exempted from the submission of a PDO.
This will primarily be relevant for developments of minor discoveries that can be reached from existing facilities on fields with an approved plan for development and operation. A discovery developed in this manner will normally be incorporated into the existing field without being given a separate name.
Temporary changes in the Petroleum Tax Act
In June 2020, the Storting (Norwegian parliament) passed temporary amendments to the Petroleum Tax Act, cf. Proposition No. 113 L (2019–2020) and Recommendation No. 351 L (2019–2020).
The objective was to help ensure that the oil companies could continue to work on planned investment projects despite temporary liquidity, funding issues and increased uncertainty surrounding the future due to the pandemic and its impact on the energy markets.
The background was that investment activity on the NCS was projected to be lower than expected before the pandemic as a result of planned investment projects being delayed. Such delays could have increased the risk of shutdowns and bankruptcies in the supplier industry.
Considerable remaining quantities of liquids
The remaining quantities of liquids on the NCS are still considerable. About 60 per cent of overall expected liquids resources have been produced since Ekofisk came on stream in 1971. Remaining liquids reserves distributed across fields are shown in figure 5.4. Johan Sverdrup (24 per cent) is the field that clearly has the most remaining reserves and which produces the most oil annually.
The second largest is Johan Castberg (8 per cent), which is expected to come on stream in 2024. Snorre accounts for 7 per cent. Yggdrasil with the Hugin, Munin and Fulla fields and expected start-up in 2027, will collectively account for 6 per cent of the overall remaining reserves.
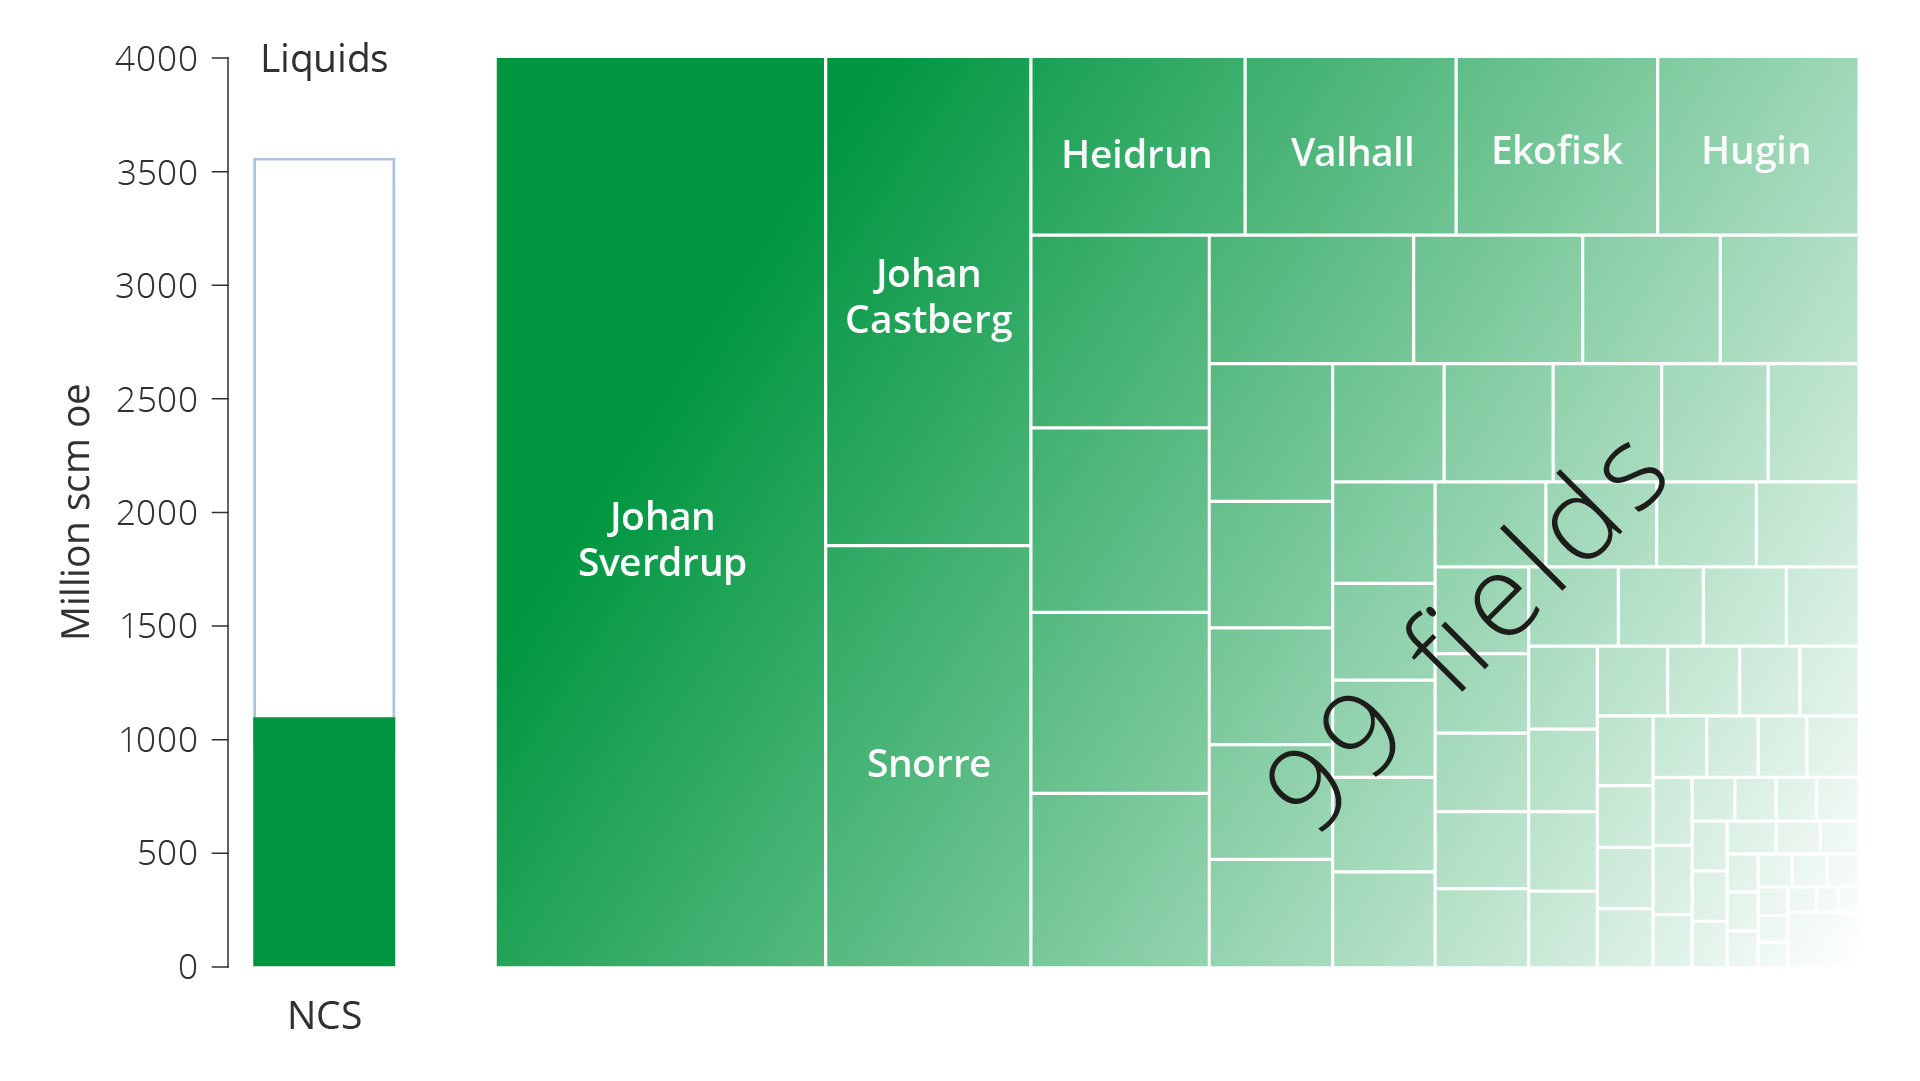
Figure 5.4 Remaining liquids reserves on the NCS as of 31 December 2023. Percentages are distributed across fields.
Liquids production will also decline in the future in several fields containing both, oil and gas as a result of initiating gas blowdown.
Gas blowdown
In some fields, which contain both oil and gas, the oil is produced first. This prevents the pressure from dropping in the reservoir, which will complicate extraction of the underlying oil. Eventually, as there will be less oil to produce, the field can start producing the gas in a so-called gas blowdown.
Several fields that have been injecting gas for improved oil recovery have halted this injection in recent years. For many fields, halting injection in this manner can be the first step towards gas blowdown on the field, and thus increased gas production. Examples of fields that have halted their gas injection include Visund and Gina Krog.
A full blowdown cannot start until active measures are taken to produce the gas in the gas cap. This can be done by drilling new gas production wells into the gas cap, converting gas injection wells into gas production wells or by opening gas cap zones in the existing oil production wells.
Once gas injection ends and gas production increases, most fields will see a minor increase in oil production, but in most instances, total oil recovery would have been higher if gas injection had continued.
Injection normally ends when the gas blowdown starts. The combination of stopping injection and increasing gas production will result in a rapid pressure drop in the reservoir. This is why it is important to conduct studies which ensure an adequate number of wells, so that all profitable oil resources in the field can also be produced.
Gas blowdown can also take place by lowering the pressure in the reservoir to the point that the gas, which was originally dissolved in the oil, condensates and can be produced. This is done on the Statfjord field, where the depressurisation started in 2007.
Market failure and accelerated gas blowdown
With high gas prices, it can be profitable to accelerate the gas blowdown timeframe by stopping gas injection and switching to gas export. The consequence of this will be a reduction in reservoir pressure and the end of oil production. Early gas blowdown can also affect oil production in neighbouring fields if the reservoirs are in pressure communication.
Such accelerated gas export will result in revenues and costs, that are taken into account in both a traditional commercial and socio-economic analysis. The profitability of this decision will be affected by the fact that accelerated gas export is an irreversible decision that could result in profitable oil being permanently stranded.
As long as the gas is re-injected, the companies have the opportunity to either continue oil production or start exporting gas. If the companies export the gas, parts of the known oil accumulations will be unavailable for production and sale.
Differences between profitability assessments made by the companies and the broader society could result in the companies setting lower future valuations than the authorities. Since the gains in the form of improved oil recovery are long-term, some licensees could potentially want to produce the gas faster than what would be in society's best interest. The higher required rate of return, the less attractive it could be to extract the remaining oil before gas production starts.
Large remaining quantities of gas
About 45 per cent of total expected Norwegian gas resources have been produced since gas exports from the NCS started in 1977. Remaining gas reserves distributed across the fields are shown in figure 5.5. Located in the North Sea, Troll (44 per cent) is clearly the field with the most remaining gas reserves. It is followed by Snøhvit in the Barents Sea with 10 per cent and Ormen Lange in the Norwegian Sea with 6 per cent.
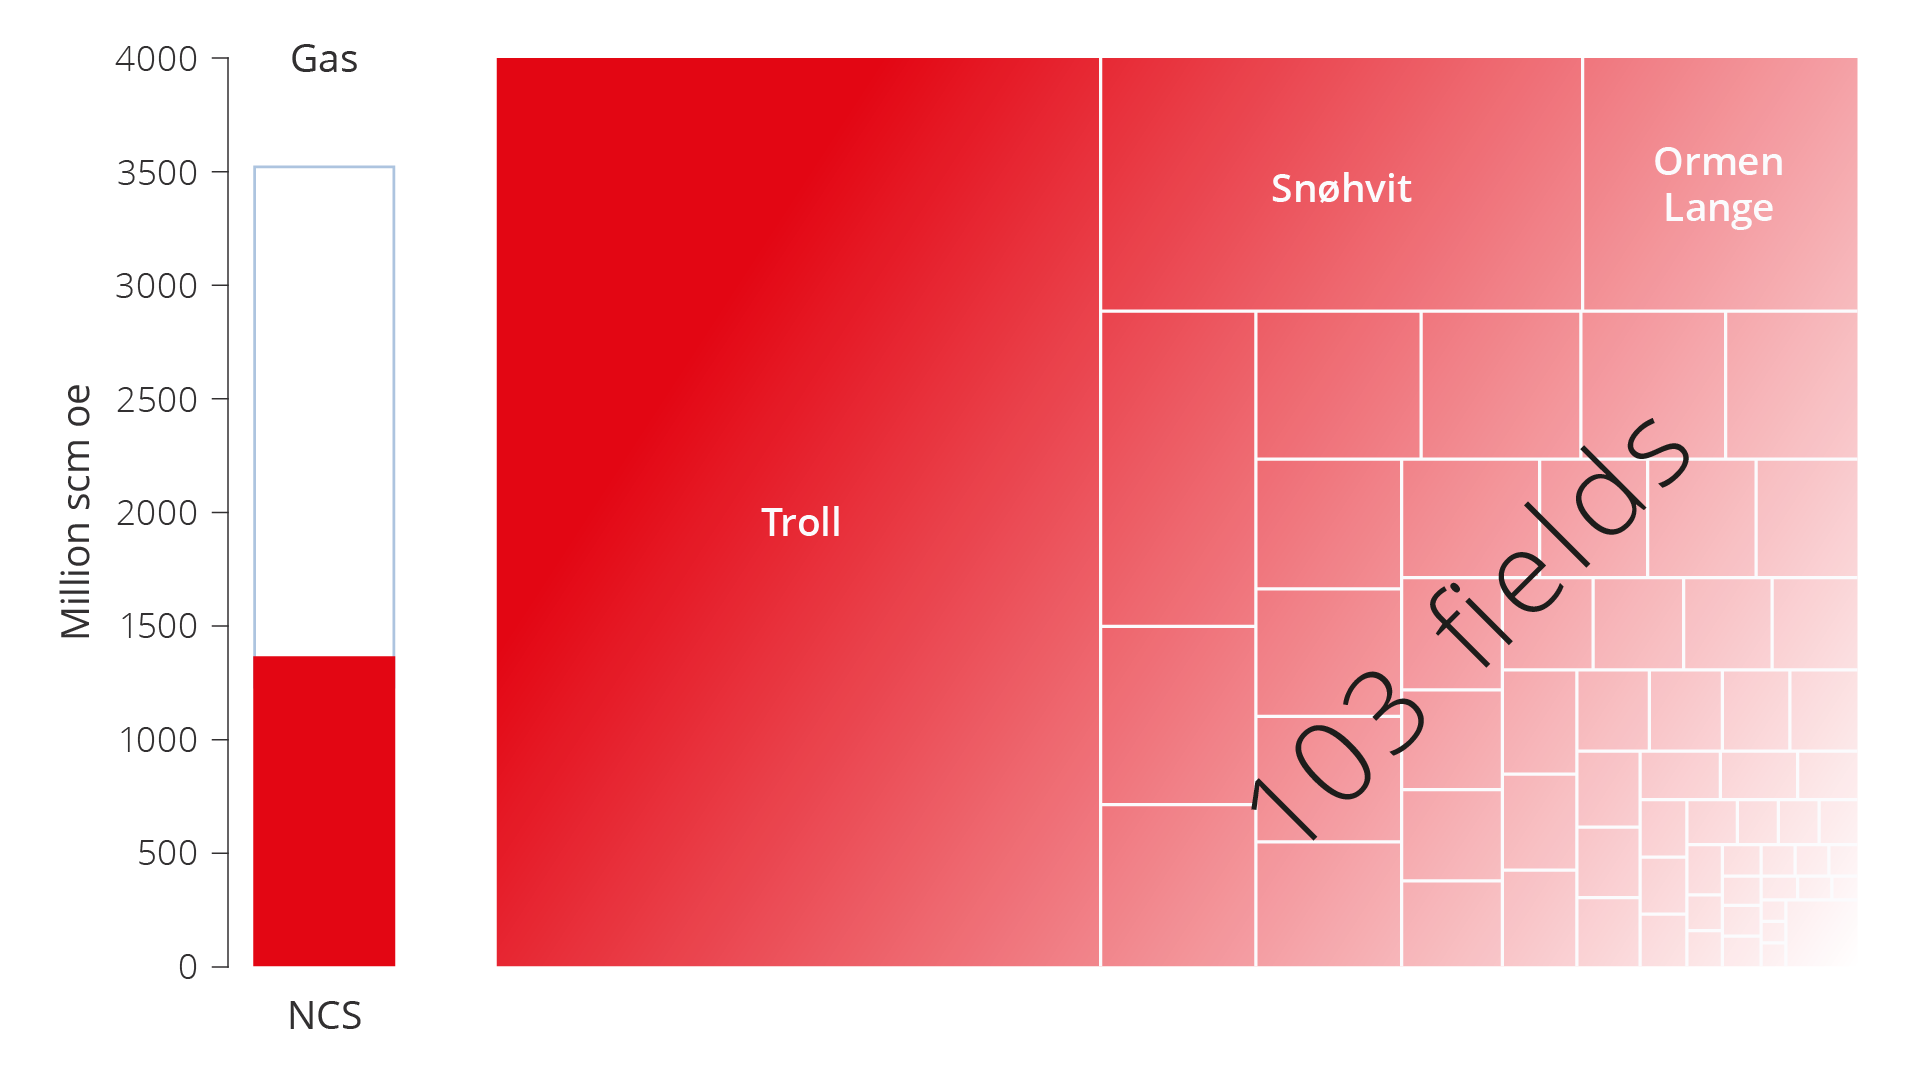
Figure 5.5 Remaining gas reserves on the NCS as of 31 December 2023. Percentages are distributed across fields.
117 billion scm of gas were exported in 2023. The Troll field produces the most gas, and in 2023 it accounted for 32 per cent of Norwegian gas production. When Troll eventually comes off plateau, there are no other fields or discoveries large enough to offset this decline.
The Troll field has two main structures: Troll Øst and Troll Vest. About two-thirds of the recoverable gas reserves are located in Troll Øst. Production from Troll Øst has evolved over a number of years with the installation of compressors on Troll A and pipelines to shore. Gas production from the first development stage of the Troll Vest gas province started in 2021.
In 2024, the Troll licensees decided to accelerate gas production from Troll Vest. This will be done by installing two new well templates with a total of 8 new wells and a pipeline back to Troll A. According to the licensees, this project will accelerate about 55 billion scm of gas starting from 2026. At its peak, this will amount to 7 billion scm in a single year. This is the equivalent of about 80 TWh or about one-half of Norwegian power generation in 2023.
Several measures can yield improved recovery
There are multiple improved recovery measures that can contribute to realising parts of the resources that, as of 31 December 2023, are expected to remain after the field is shut down. These measures can help slow the decline in production.
The expected estimate for contingent (no decision to develop) liquids resources in fields is about 355 million scm, and 290 billion scm for gas. These resources are periodised in figure 5.6.
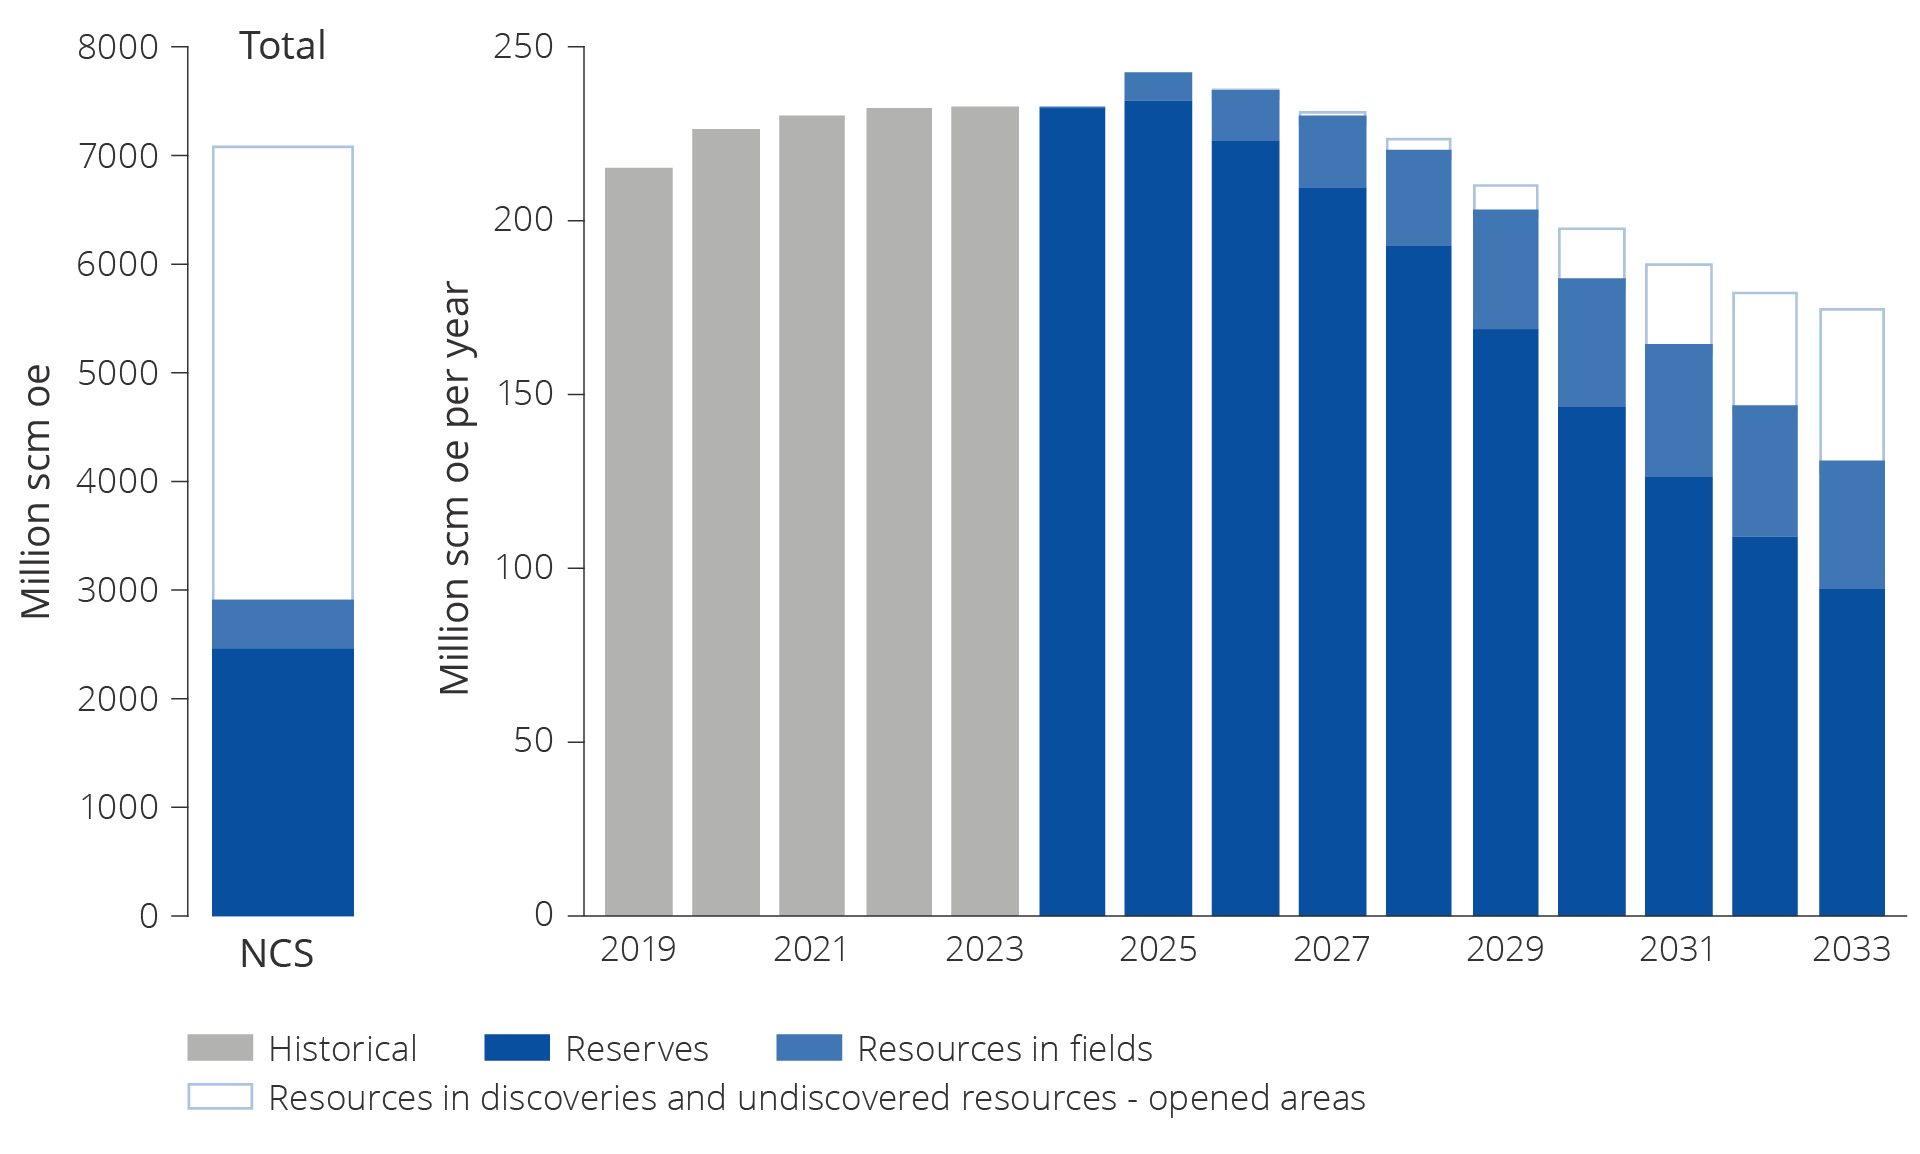
Figure 5.6 Remaining reserves and resources in fields. Historical total production from 2019–2023 and expected future production from reserves and resources in fields for the period between 2024–2033.
Many fields contain large volumes of oil beyond what is planned for production, and these fields are expected to shut down with considerable quantities oil stranded in the reservoirs. If some of this oil is produced before the field shuts down, production can be maintained for a longer period of time, and considerable value can be realised. Figure 5.7 shows produced oil, remaining oil reserves and remaining oil after planned production cessation for the largest oil fields as of 31 December 2023.
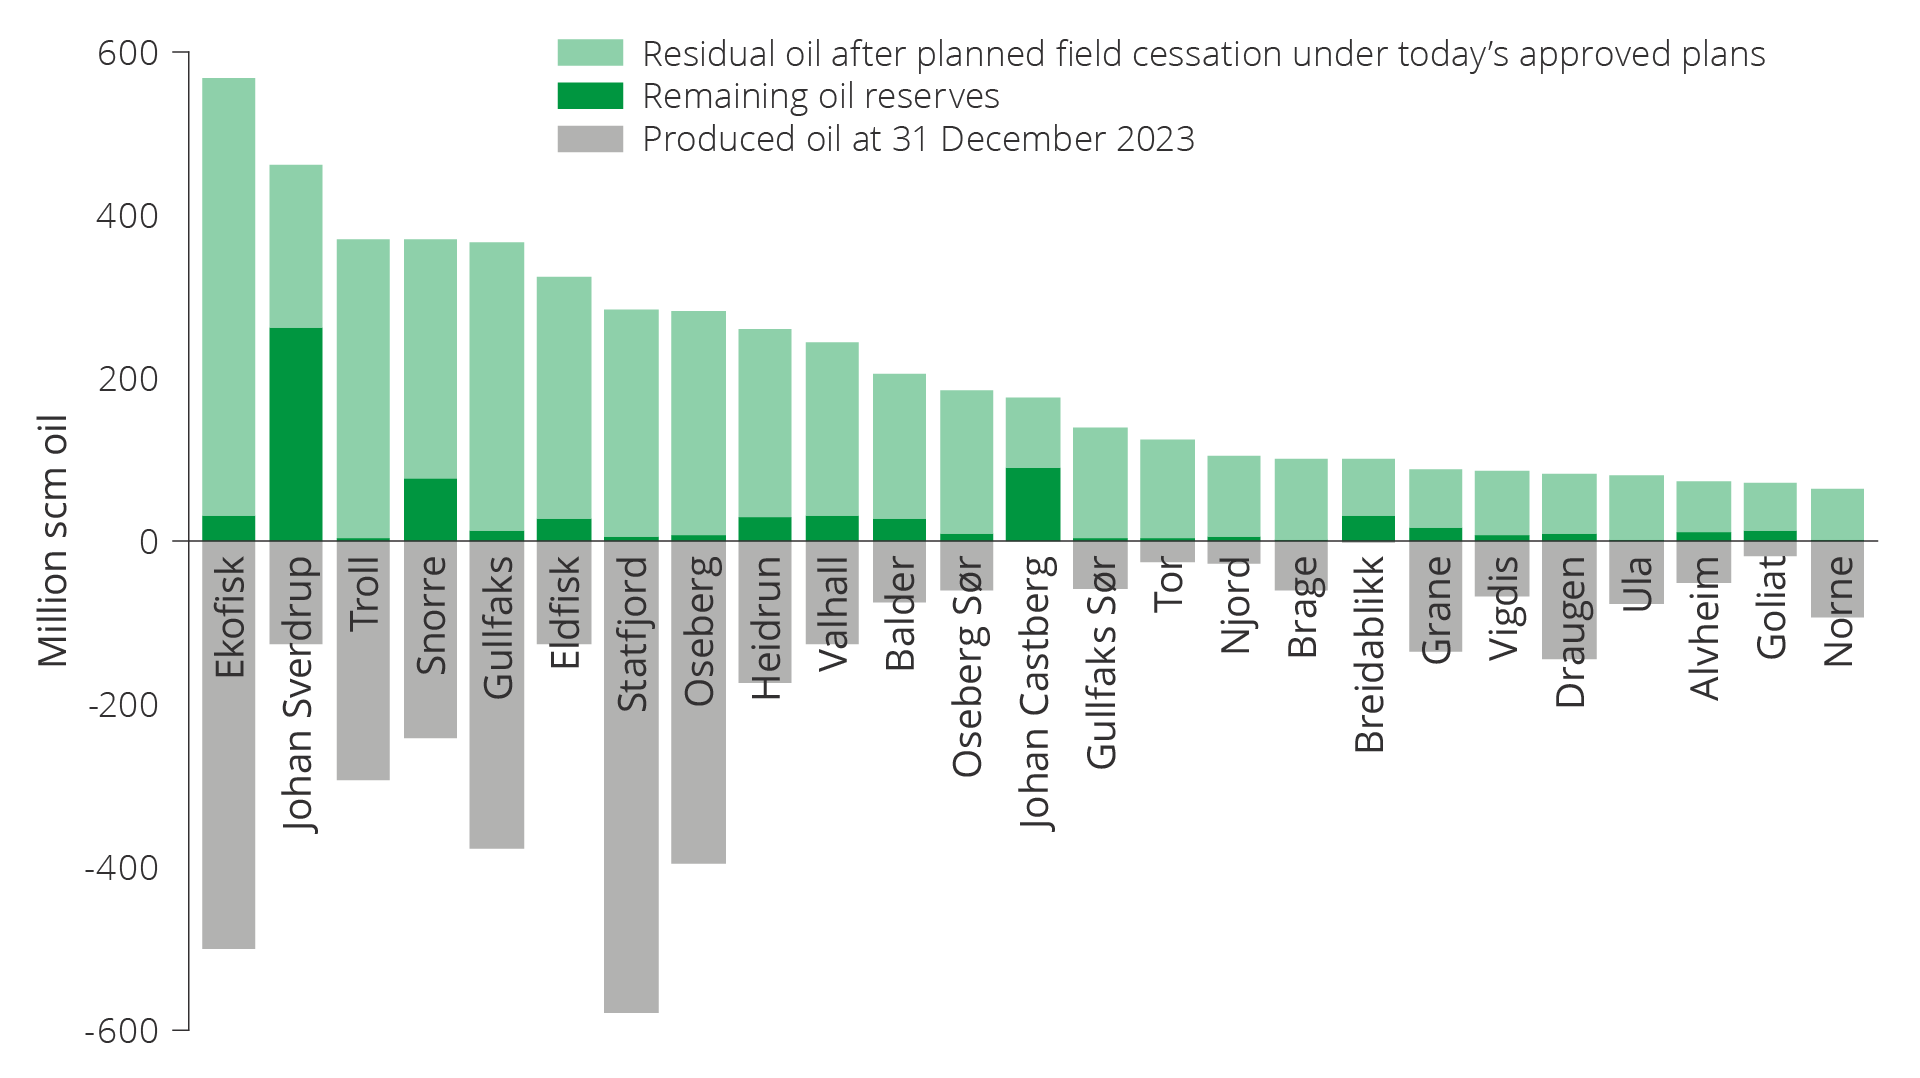
Figure 5.7 Remaining oil reserves, remaining oil after planned production cessation according to current plans and produced oil as of 31 December 2023.
Reported projects for improved recovery
The licensees are working continuously to map the resource base, drill new wells and implement other improved recovery measures on operating fields.
The projects the companies have reported to the authorities in connection with reporting for RNB 2024 (revised national budget) comprise 171 specific, but not yet approved projects for increased petroleum production and lifetime extensions.
Improved recovery measures on the fields
Wells are new development wells (injection and production wells) on the fields that are planned to be drilled from existing slots on fixed facilities or seabed templates.
Further development covers various measures to further develop fields, often by installing new infrastructure, for example seabed templates to add additional well slots for drilling or new pipelines. This category also includes projects to re-develop fields that are no longer producing, and projects to replace the fields' power supply. Further development projects will often need to be assessed by the authorities.
Late-phase production is production at the tail end of a field's lifetime. Late-phase production is reported separately from other production, since there is considerable uncertainty associated with this. The uncertainty could be the facilities' technical lifetime or the profitability of production.
Low-pressure production mainly includes projects where the installation's inlet pressure is reduced, thereby increasing the production rate from reservoirs with lower pressure. Low-pressure production leads to reduced process capacity on the installation if no investment is simultaneously made for compression on the seabed or on the installation. Compression helps ensure that the pressure in the process plant remains the same, see also low-pressure production, Chapter 6.
Injection and advanced methods cover a broad spectrum of measures. This could be increased or optimised injection of, for example, water and/or gas. Using technologies to fracture tight reservoirs is another example of this type of project, see Chapter 4, EOR.
It is important to implement new technology, in order to realise new projects for the fields. Figure 5.8 illustrates the reported, but not yet approved, measures that could contribute to enhanced recovery of liquids. In total this will result in increased recovery of approximately 155 million scm oe of liquids, if the projects are implemented. Drilling new wells is the measure that represents the single largest contribution to improved recovery, while further development accounts for one-fourth of increased liquids resources.
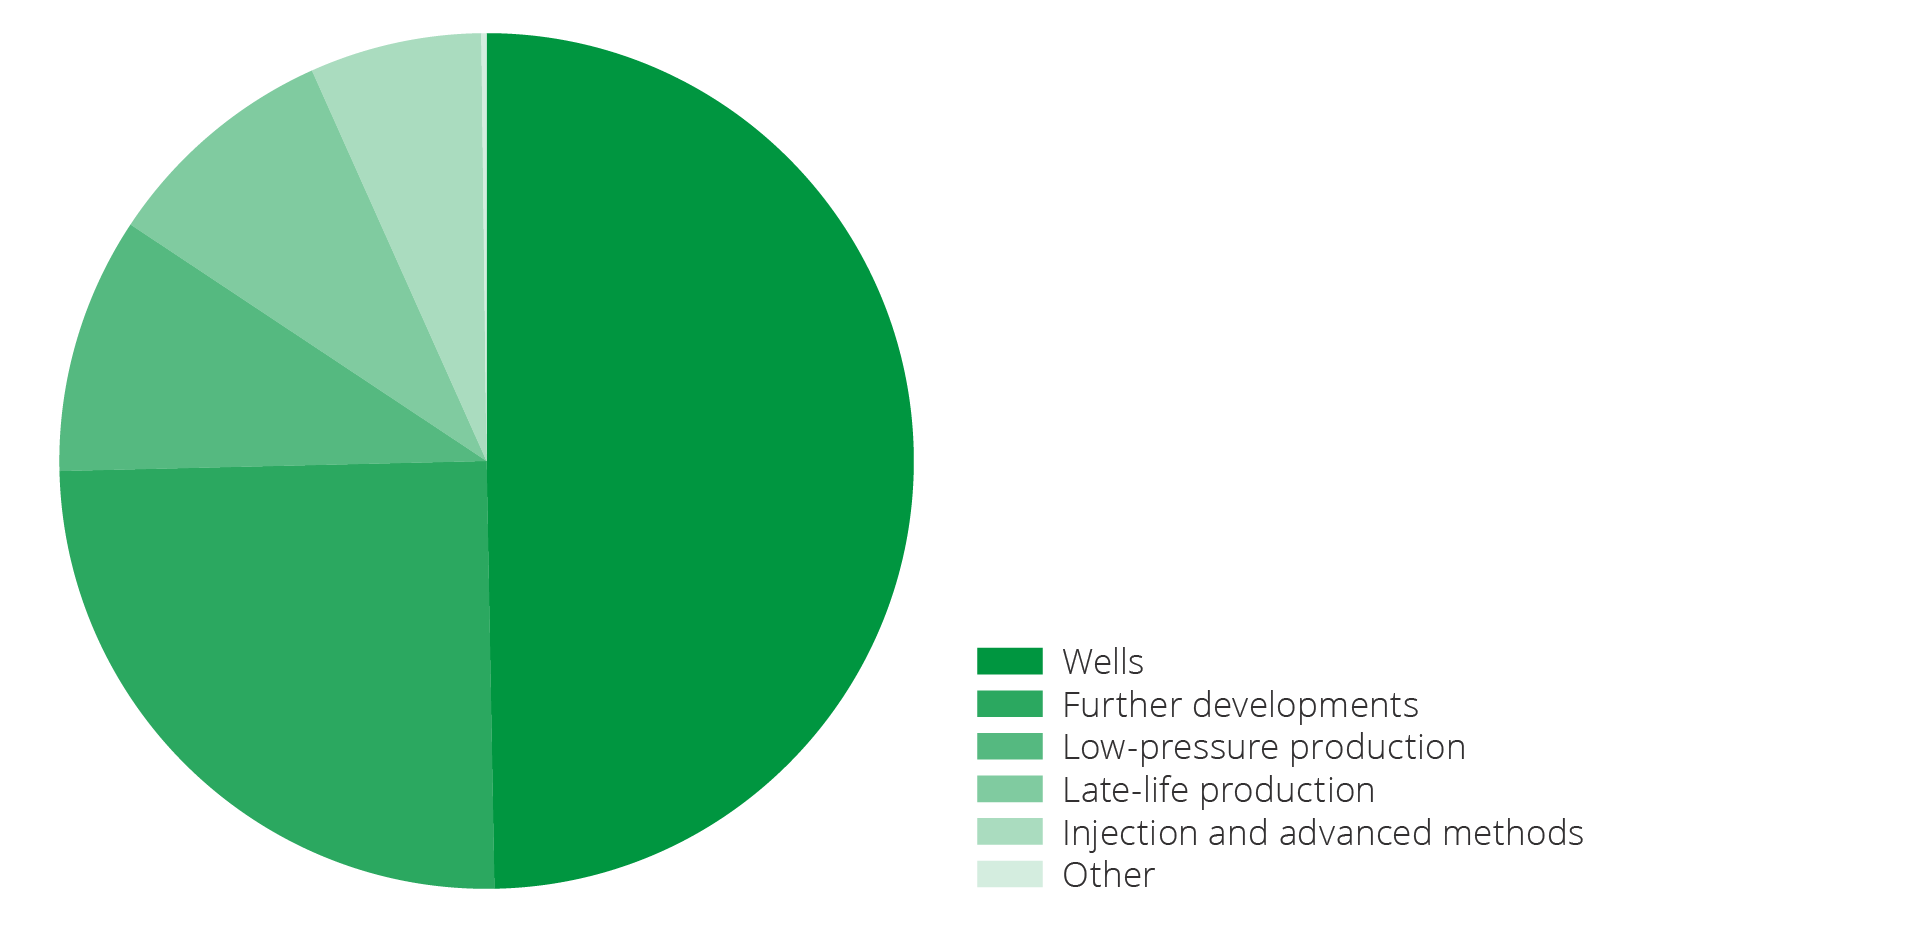
Figure 5.8 Potential measures reported in 2023 for increased recovery of liquids from fields, distributed across different project types. In total, this amounts to about 155 million scm oe of liquids.
Figure 5.9 shows reported, but not approved measures that can contribute to improved gas recovery. Overall, this can result in approximately 170 billion scm of gas if implemented.
The measure that provides the greatest contribution for improved gas recovery is low-pressure production, followed by wells and further development. There are very few reported projects within injection and advanced methods.
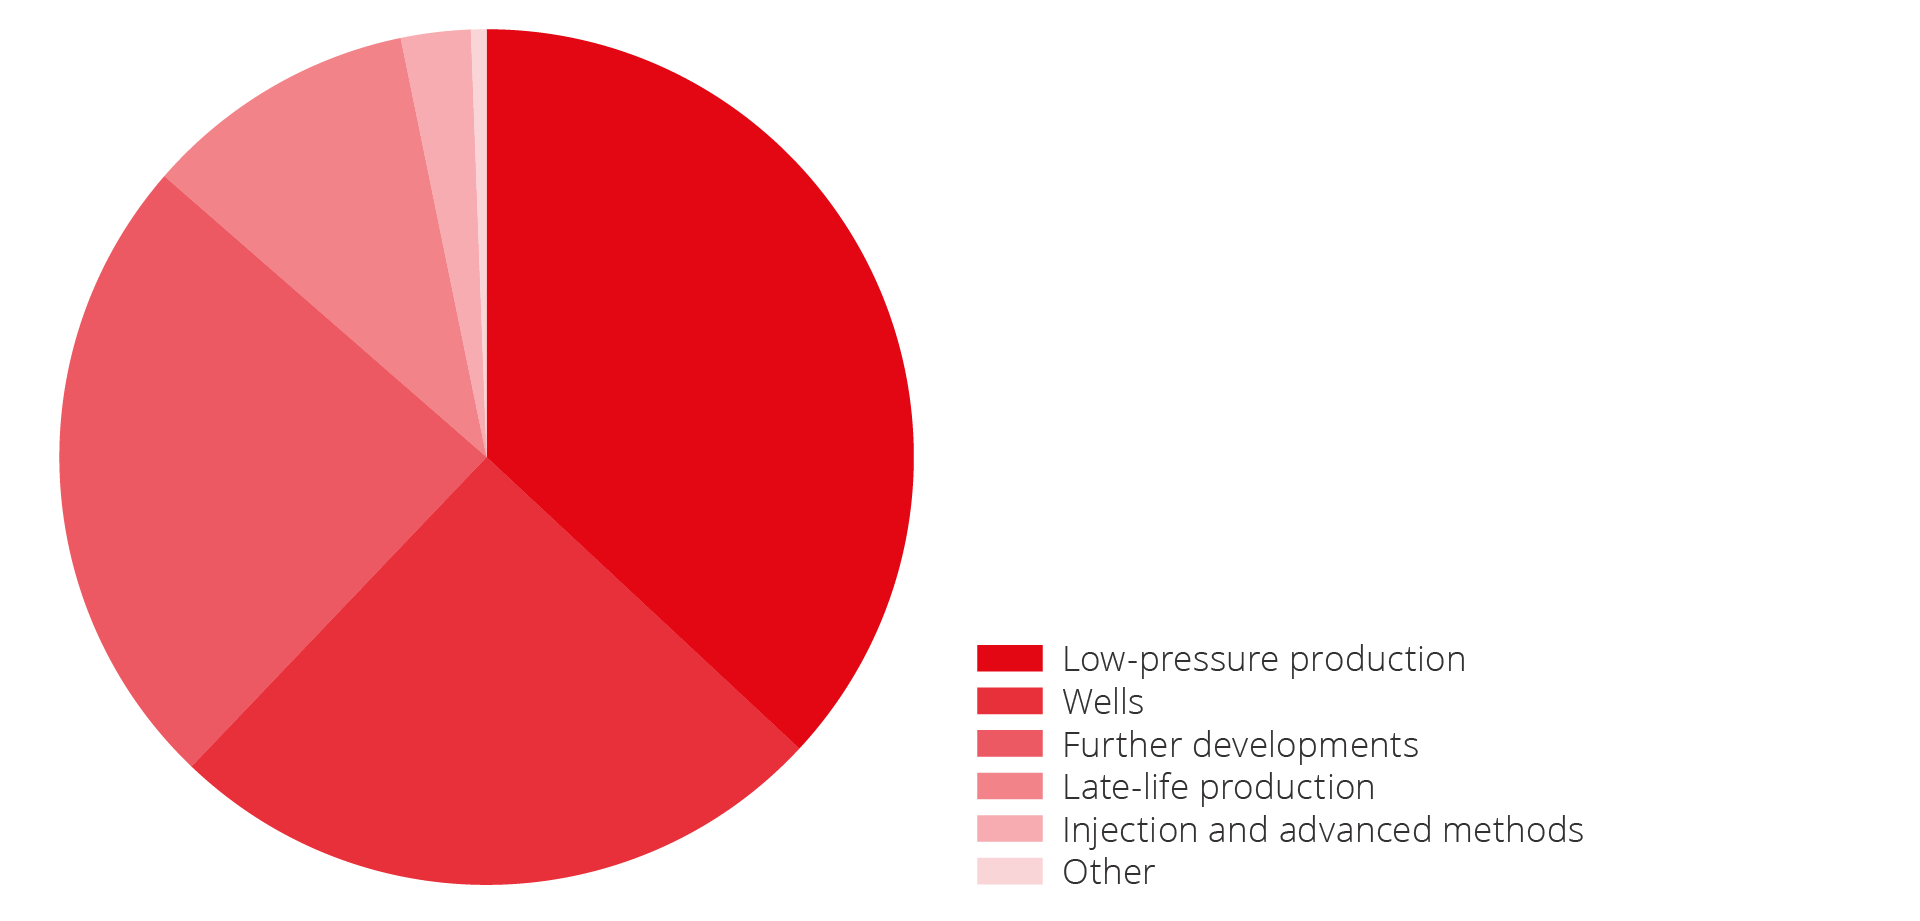
Figure 5.9 Potential measures for improved gas recovery from fields distributed across different project types. In total, this amounts to about 170 million scm oe of gas.
Market failure and improved recovery
The companies' required rate of return and absolute net present value requirements mean that fewer improved recovery projects prevail in the companies' project selection and decision-making processes(25). This means that socio-economically profitable projects are not implemented.
This was also emphasised by the Office of the Auditor General of Norway (the OAG) in their 2015 report, that showed that companies consistently have higher rates of return than the state. This indicates that fewer improved recovery projects are profitable when the companies' own required rates of return are applied.
According to the OAG, this, alongside the companies' limited access to capital, means that projects with a positive net present value with the companies' own required rates of return are not necessarily realised. Only the most commercially profitable projects (projects with high net present value) are realised, as the companies apply additional criteria before they accept a project. The OAG was concerned about a lack of focus on socio-economically profitable measures to increase production from mature fields.
New development wells
Measures to improve recovery are dominated by new wells, both in number and in volume. Drilling new development wells is entirely crucial to slow the decline in production, particularly for oil fields as illustrated in figure 5.10.
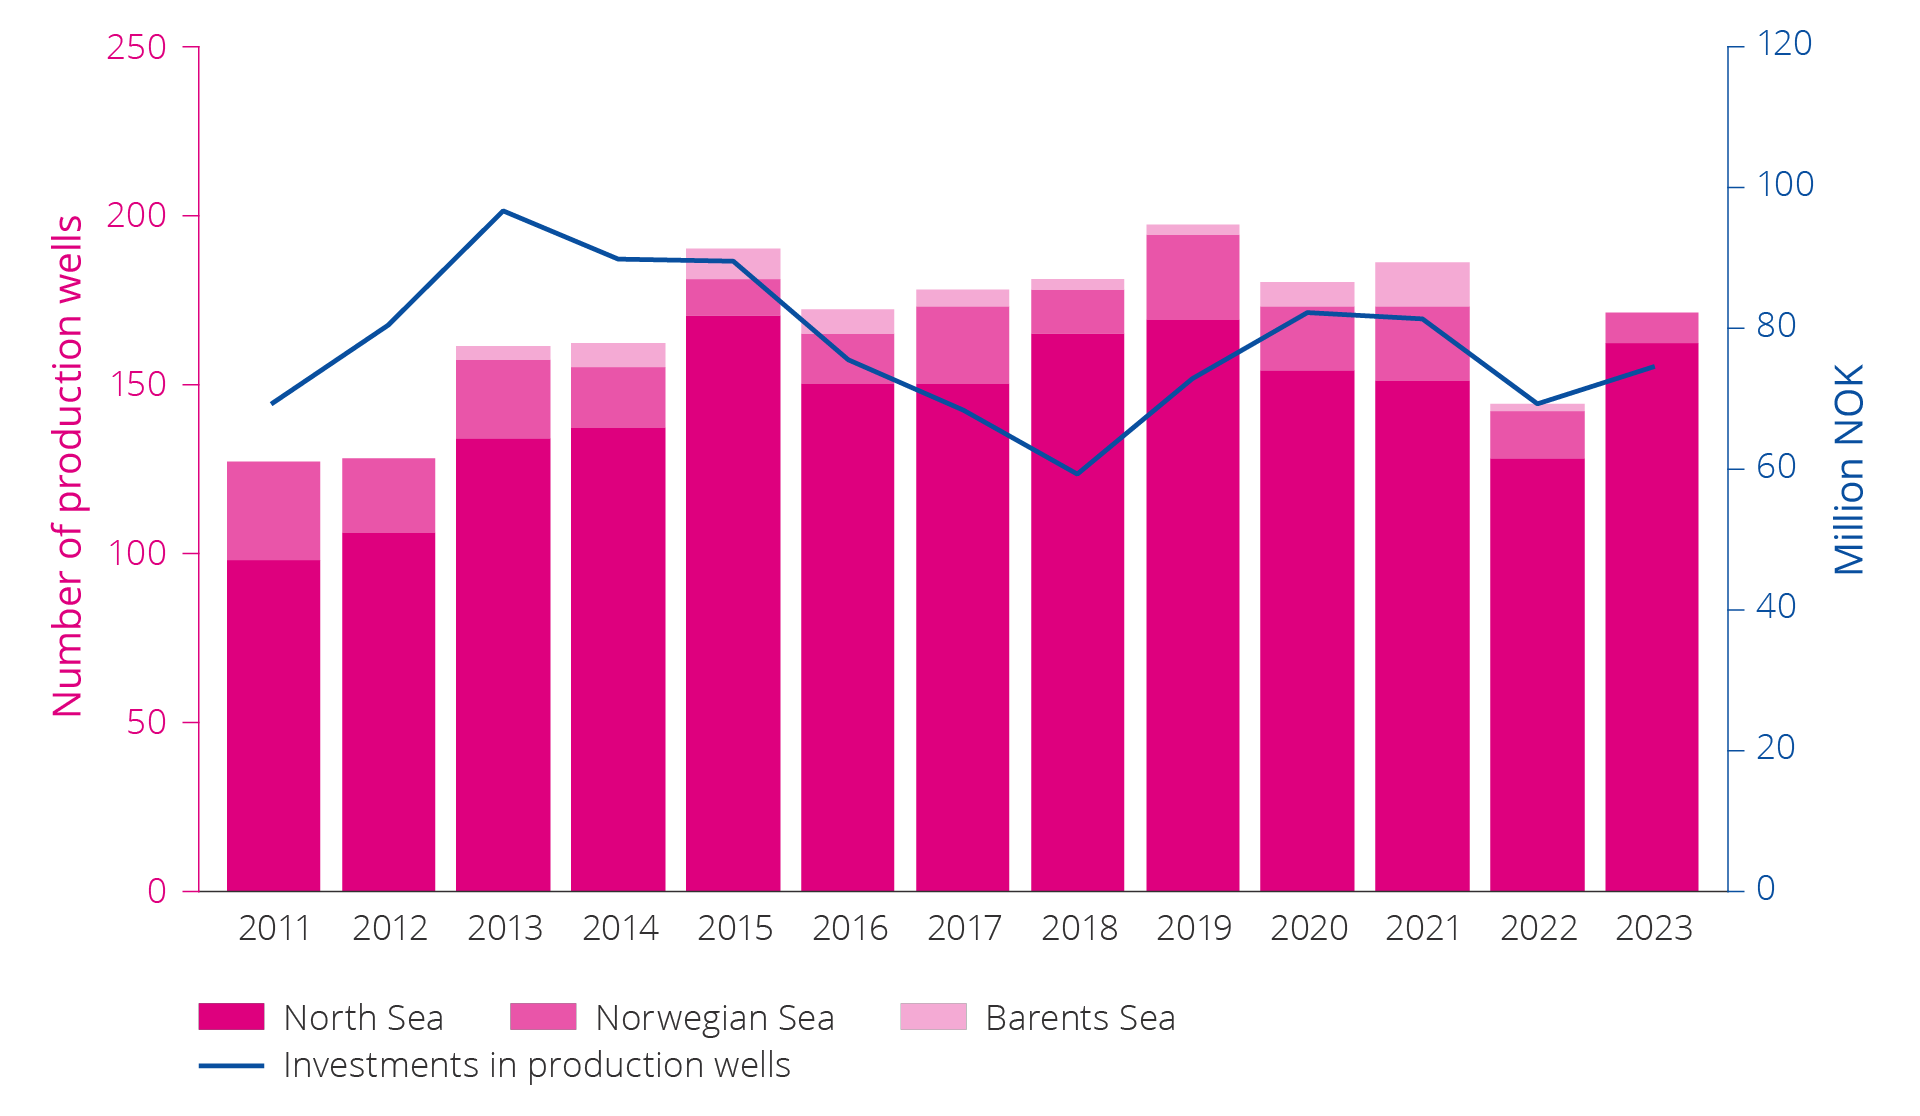
Figure 5.10 Number of development wells and investment in production drilling on the NCS over time from 2011–2023.
Low-pressure production
The pressure differential between the reservoir and the wellhead on the installation is what makes it possible to produce oil and gas. When petroleum is produced from a reservoir without injecting a corresponding quantity, the reservoir pressure will be reduced.
Gas fields do not normally utilise injection for pressure support. Declining reservoir pressure means that the wells will eventually produce at lower rates (volume per unit of time) as a result of the reduced pressure differential. One measure that can be implemented to maintain higher production rates is lowering wellhead pressure.
Lower wellhead pressure increases the production rate from the wells and ensures that a greater share of the resources can be recovered. This is achieved either by installing compressors between the wellheads and the process plant, or by lowering the receiving pressure at the installation/onshore facility. Åsgard and Ormen Lange are examples of fields that have, or are in the process of, installing seabed compression. Onshore compression for the Ormen Lange field started in 2019, and the field is now being further developed with subsea compression. The plan for development and operation was approved in 2022. Two compressor stations that handle rich gas will be installed on the seabed near the wellheads. This is expected to improve recovery by up to 30-50 billion scm of gas from Ormen Lange, which is expected to increase the field's recovery rate from 75 to 85 per cent; see figure 5.11.
If low-pressure production is implemented by reducing the receiving pressure at the installation/onshore facility, processing capacity will be affected. At this point, it may be necessary to modify the export compressors, in order to continue delivering gas that satisfies the required export pressure.
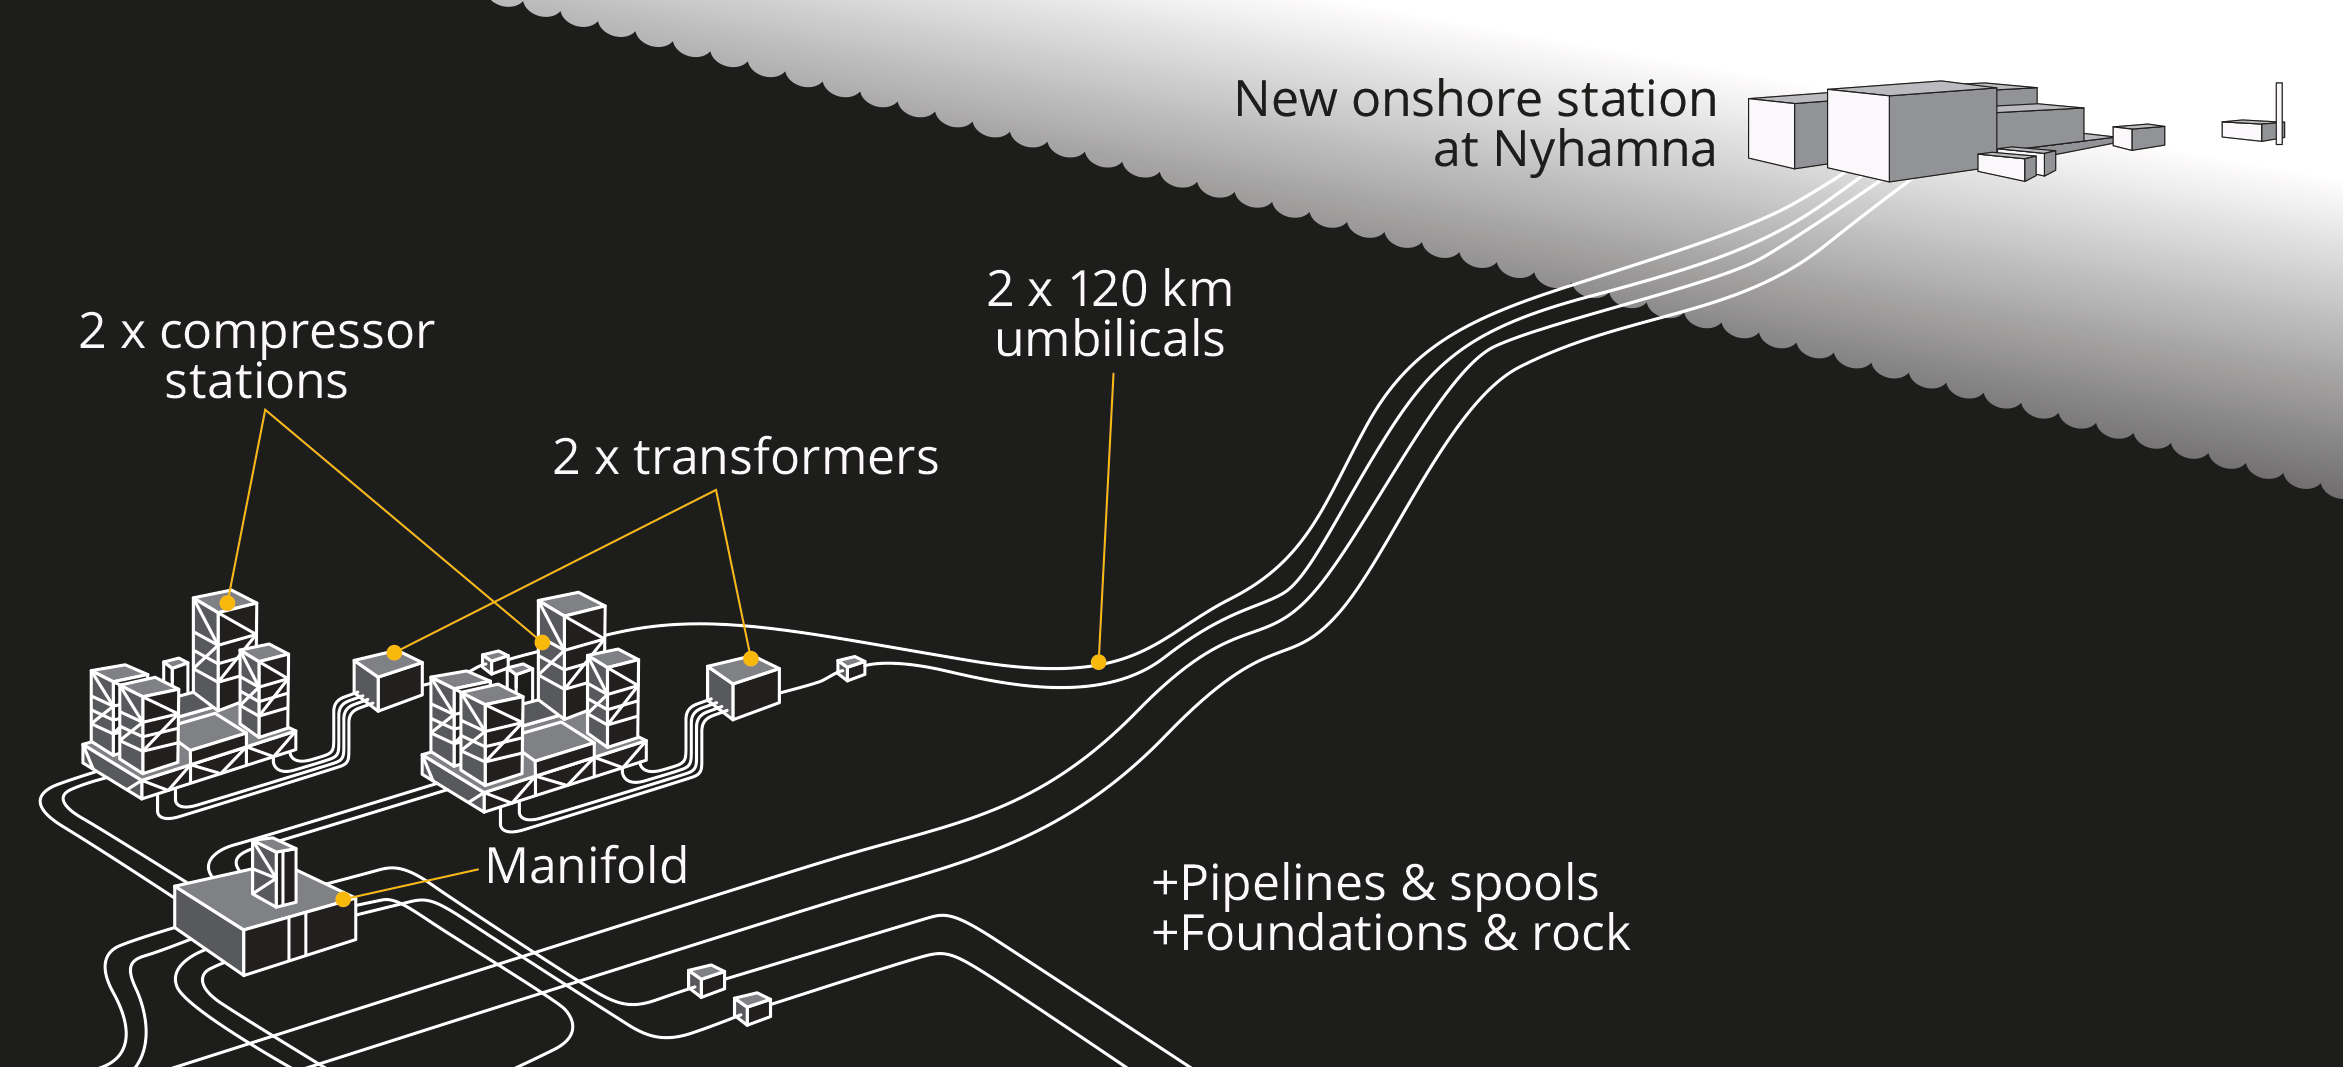
Figure 5.11 Ormen Lange subsea compression (adjusted according to illustration from Shell).
Phasing in discoveries to existing fields and infrastructure
Phasing in discoveries to existing fields can help extend the lifetime of the host field and thereby ensure continued profitable production and improved recovery.
The example in figure 5.12 is from the NCS and shows that a new discovery helps keep unit costs down. This can contribute to an extended field lifetime and provide incentives for further exploration in the area.
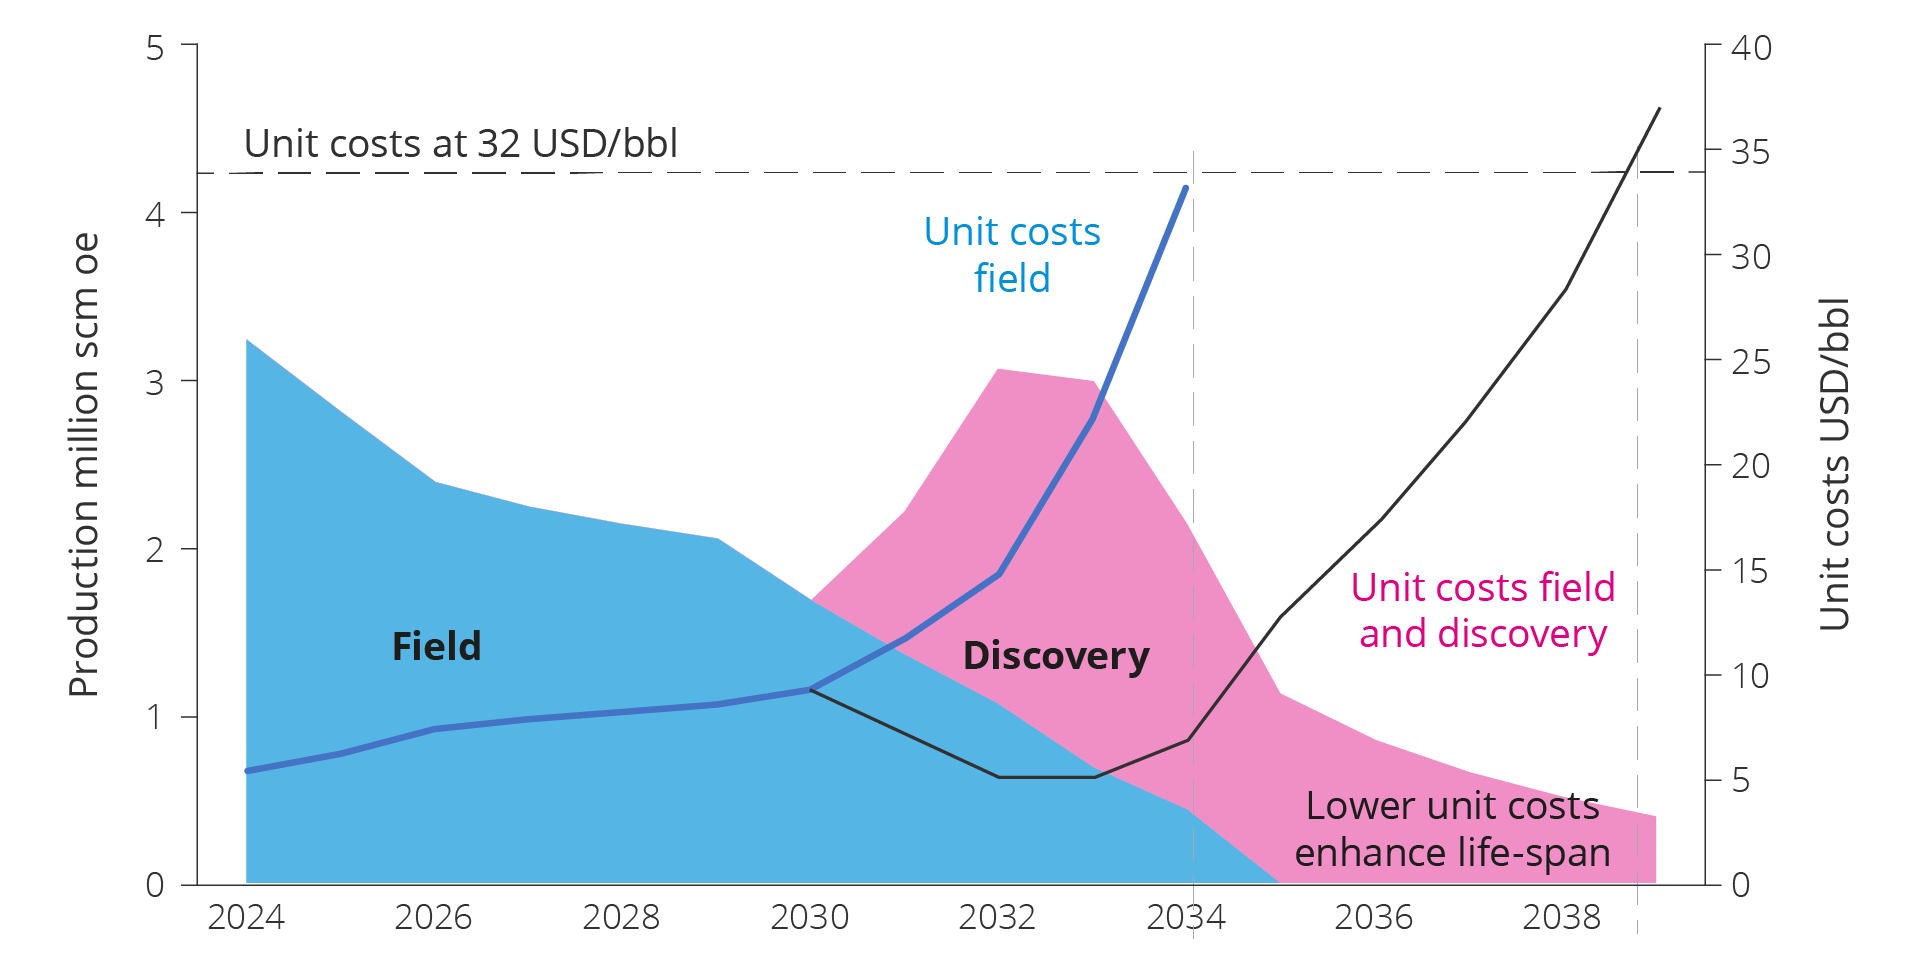
Figure 5.12 Connecting new discoveries to existing fields and infrastructure.
Time-critical resources
Time is a critical factor for a tie-back to a producing field (host field) due to its limited lifetime as well as rising unit costs as the host field approaches shutdown. It is important that the phase-in takes place before the unit cost of the host becomes too high. For this reason, future development of discoveries is not only dependent on available capacity, but also capacity at low unit costs; see chapter 6, exploration creates substantial values.
Several of the phase-in projects are in addition complex, and low capacity in process and transport systems or competing alternatives can affect the solution selection. Different ownership structures can also make it challenging to find good solutions across fields, discoveries and infrastructure.
Unit costs and need for consolidation
Eventually, the access to resources from new discoveries will be insufficient to counteract production decline from the fields, and there will be a need for consolidation to avoid exceedingly high unit costs. Consolidation may result in decommissioning of certain installations and optimisation of remaining infrastructure utilisation.
The decommissioning of installations may also result in the loss of exploration opportunities or other projects aimed at increasing access to resources in an area. The value of these resources must be weighed against the cost of maintaining infrastructure with high unit costs. Area analyses indicate that the loss of resources and value as a result of decommissioning can be mitigated in areas with well-developed infrastructure, by re-directing resources to another host field. However, this is difficult to achieve in practice; see fact box on market failure in the phase-in of discoveries. Experience indicates that fields, discoveries and undiscovered resources must be viewed in context before such decisions are made, so that necessary studies for this are conducted in time.
Resources and challenges in discoveries
The production decline can be slowed if discoveries are developed and put on stream; see figure 5.13. At the end of 2023, there were 79 discoveries (see note in resource classes 4F, 5F, 7F in the Resource Accounts for 2023) on the NCS where no decision had yet been made to develop, but where the licensees are considering development.
Resources in discoveries total 494 million scm oe, split between 261 million scm of liquids and 233 billion scm of gas. Together, the size of the resources in the 79 discoveries is on par with the original resources in the Åsgard field.
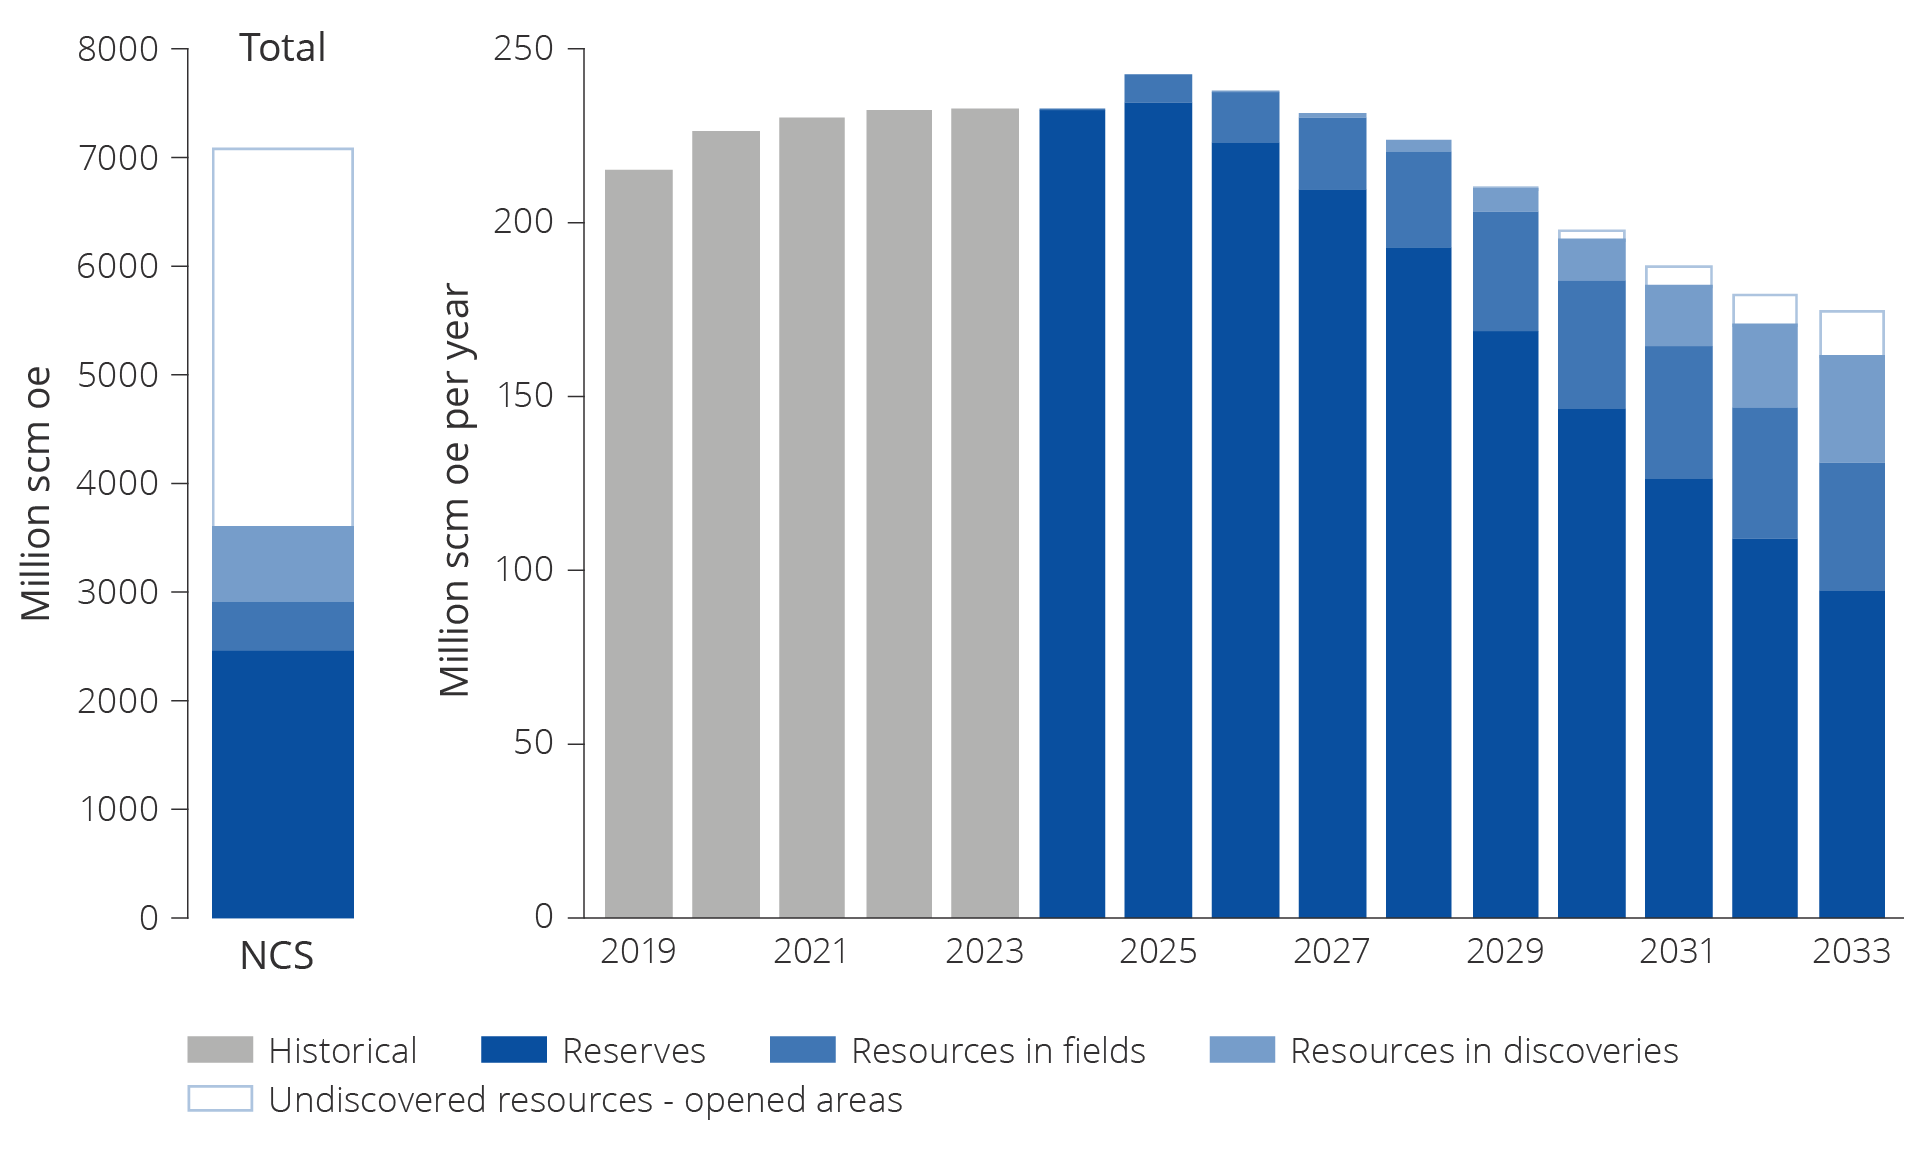
Figure 5.13 Remaining reserves and resources in fields and discoveries. Historical total production from 2019–2023 and expected future production from reserves and resources in fields for the period from 2024–2033.
The discovery portfolio is shown in figure 5.14 according to size per NCS area. There are certain larger discoveries and several minor ones in all three petroleum provinces on the Norwegian shelf. Most discoveries are in the North Sea.
There are few discoveries of sufficient size to help maintain production in the future. The largest discoveries are 7324/8-1 (Wisting) in the Barents Sea, 6406/9-1 (Linnorm) in the Norwegian Sea and 35/2-1 (Peon) in the North Sea.
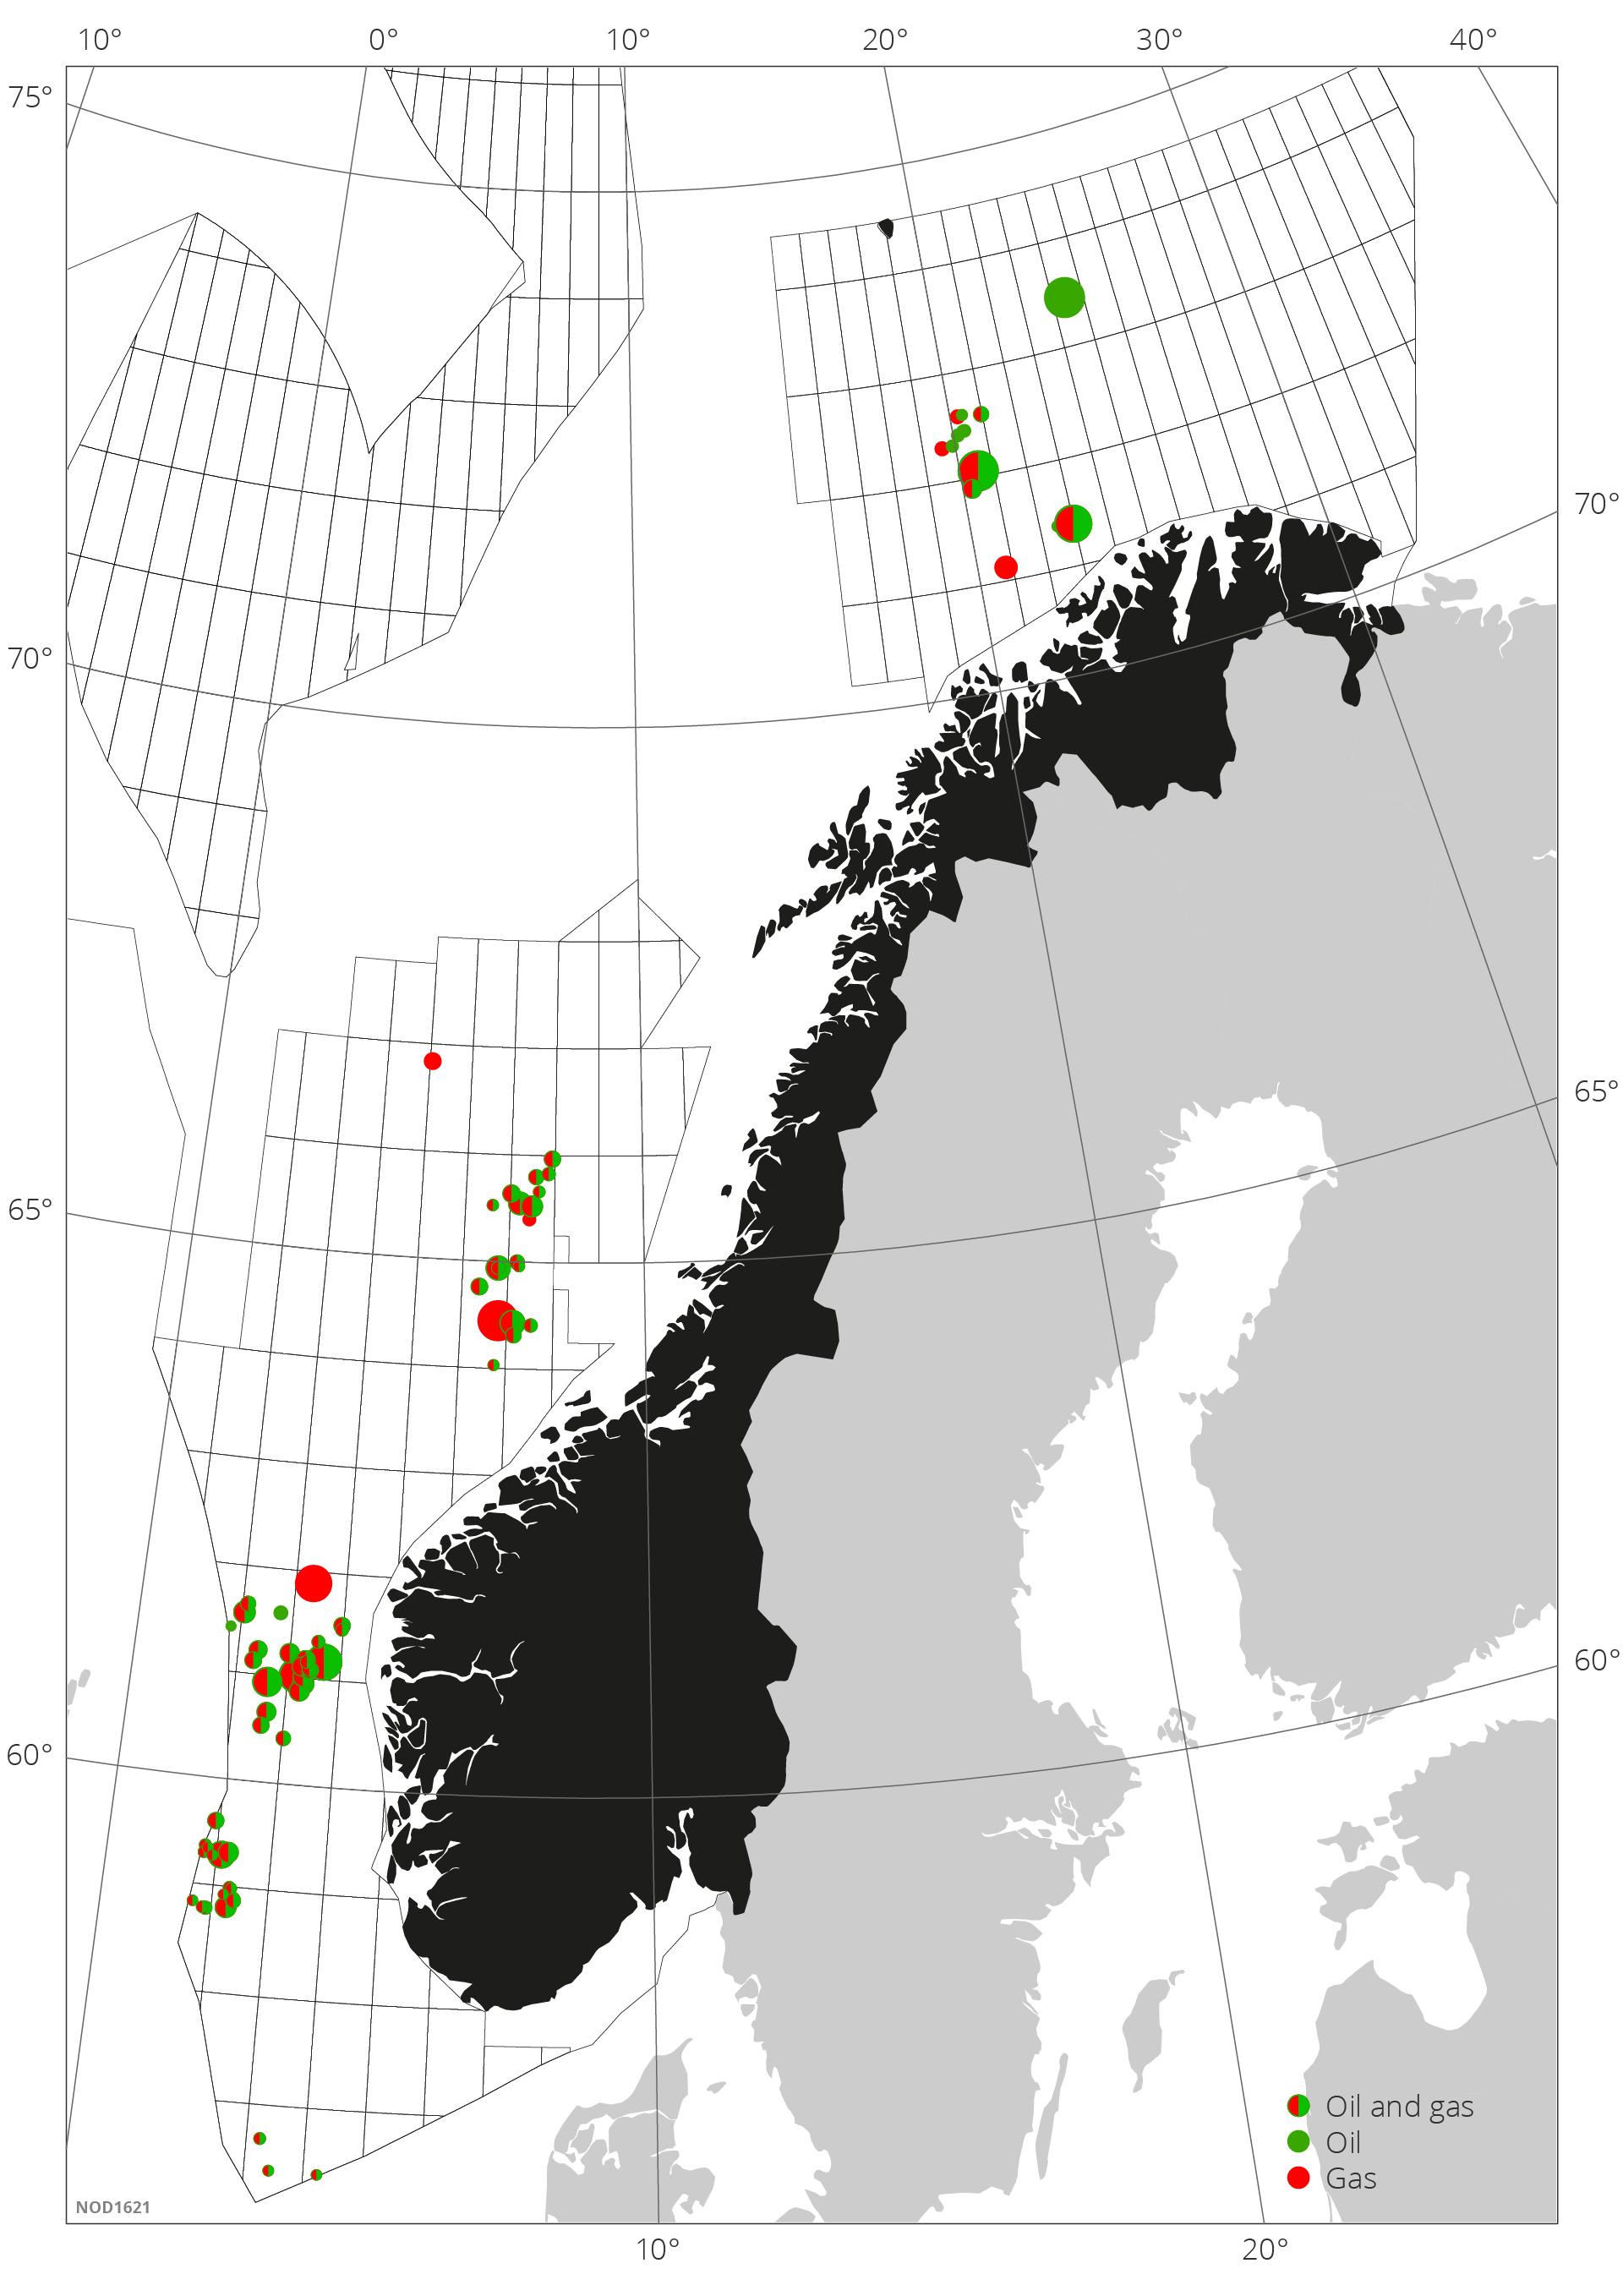
Figure 5.14 Discovery portfolio as reported in RNB (including all discoveries in resource classes 4F, 5F and 7F at the end of 2023). Phase (oil = green, gas = red) is indicated in circles. The size of the circles represents the relative size of the discoveries, so the largest circle illustrates the discovery with the biggest volume.
Tie-backs to existing infrastructure
Most discoveries in the portfolio are located near existing infrastructure and are planned for development as tie-backs/phase-ins to existing infrastructure; see figure 5.15.
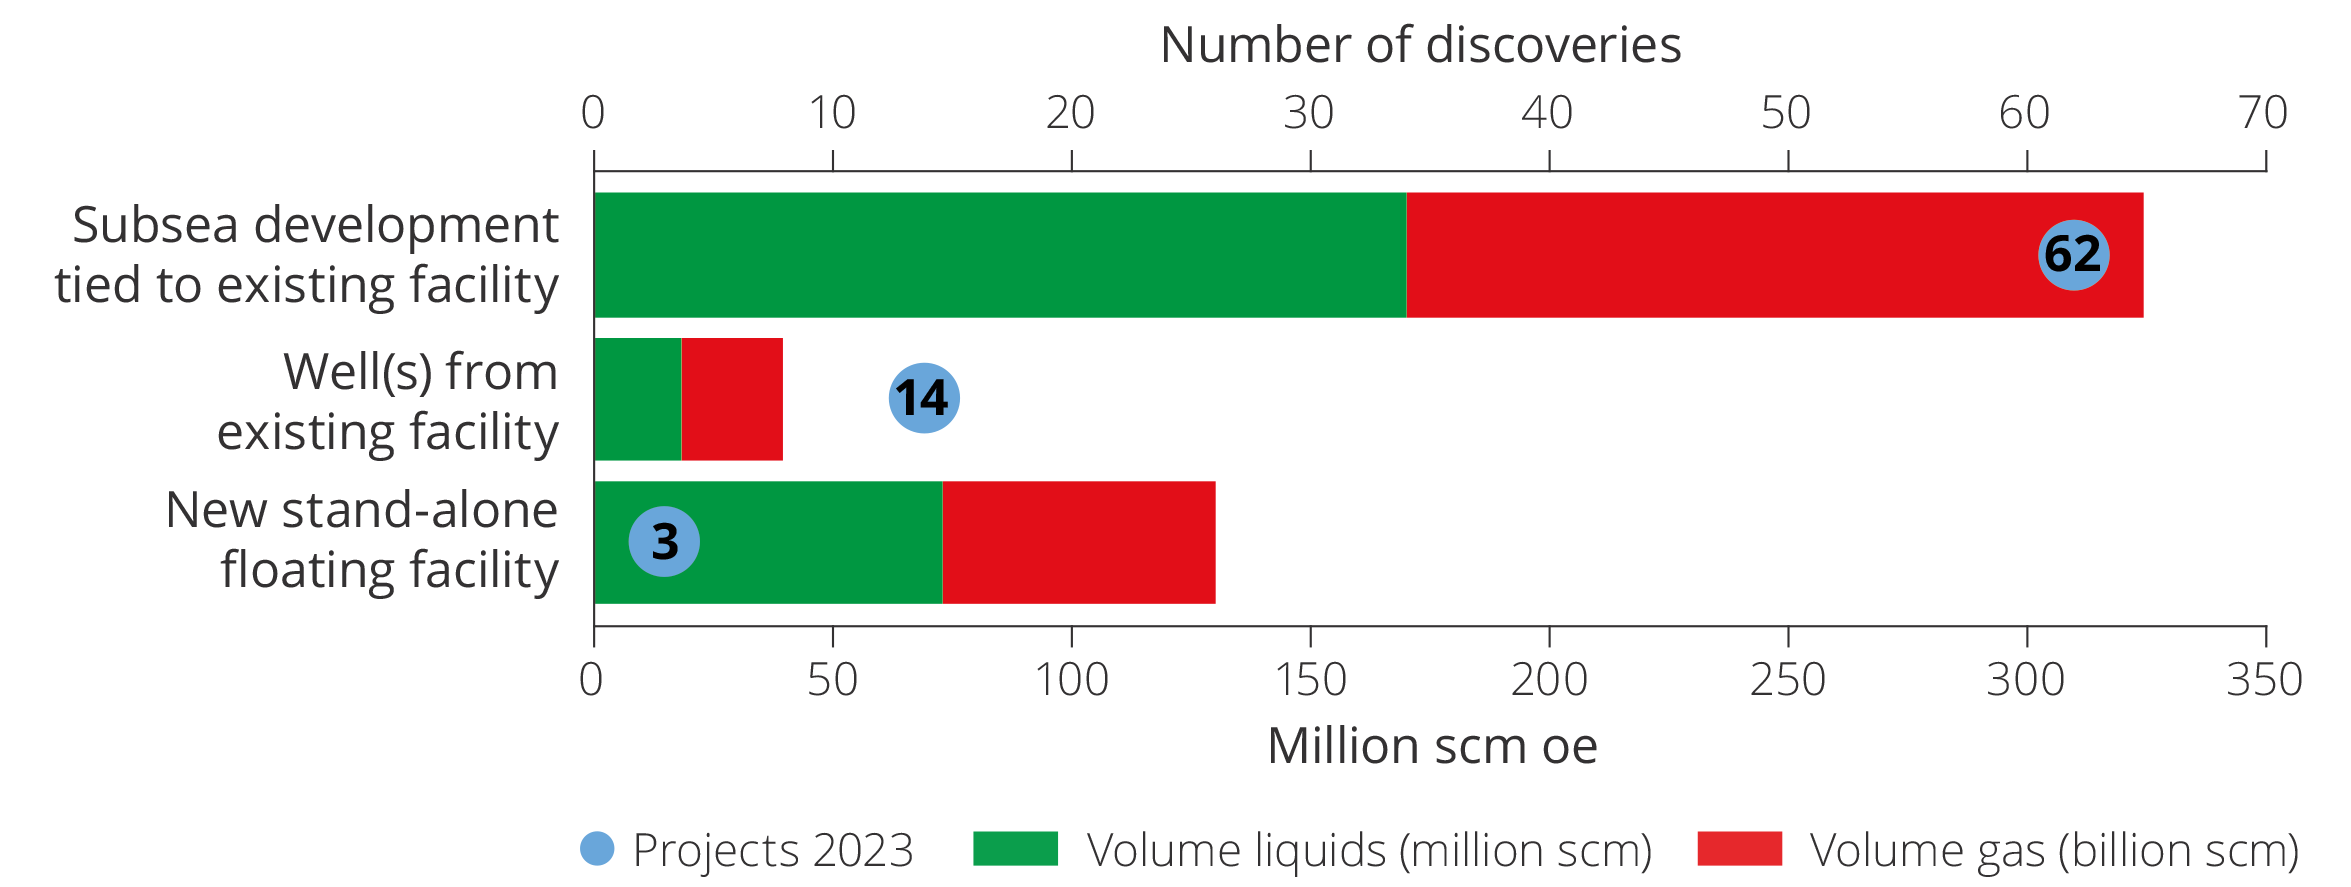
Figure 5.15 Likely development solutions for the 79 discoveries in the discovery portfolio as of 31 December 2023, and total resources per development solution.
Development with phase-in to existing fields or other major development projects is planned for 76 of the 79 discoveries in the portfolio.
The most common concept is subsea developments. This is the most likely solution for 62 of the discoveries. Another possible solution for smaller discoveries close to infrastructure, is to use vacant well slots on existing fields. This solution has been presumed for 14 discoveries.
Market failure in phasing in discoveries to existing fields and infrastructure
Connecting a discovery to a producing field frequently requires complex and time-consuming negotiations. This is often caused by differing ownership compositions in the production licenses, and that the owners can be on both sides of the table.
In addition to complex ownership compositions, the owners often have other special interests linked to nearby infrastructure that complicate a straightforward approach. Different strategic interests and asymmetrical information will challenge the negotiations and involve considerable transaction costs and plenty of time.
Maximum value creation can be achieved if negotiations result in the same solution that would have been chosen if the owners of host and satellite fields are the same.
However, free negotiations will not necessarily lead to such a solution. On the contrary, they can lead to a loss of efficiency.
One reason why negotiations do not necessarily lead to the best solution is that the host field is in a monopoly position. Stand-alone development is not profitable and the absence of other host fields in affordable proximity leave the field stranded. Monopoly solutions can frequently result in overpricing and under-supply.
Furthermore, different access to information (asymmetrical information) between contracting parties can result in prolonged negotiations, if they succeed at all. Another market failure may arise from vertical integration, where the owner of the infrastructure is also the user.
Market failure presents multiple reasons for the authorities to intervene in tie-back agreements. At the same time, the authorities face some of the same challenges themselves, for example asymmetrical information, which makes it difficult to achieve efficient direct regulation.
The Norwegian policy is therefore to address each negotiated tie-back agreement separately. The Regulations relating to the use of facilities by others(27) outlines several principles and procedures for the parties' negotiations, in an effort to reduce transaction costs and prevent exceedingly lengthy negotiations.
Stand-alone developments
Investment in stand- alone production facilities require relatively large discoveries or coordination of multiple small discoveries. Coordination of multiple discoveries leverages economics of scale and contributes to lower unit costs compared to developing and producing the discoveries separately. Despite the obvious rationality of coordinating discoveries, such coordinated solutions may not necessarily be realised due to differing ownership interests and asymmetrical information as discussed in the market failure box above.
Stand-alone developments in areas without access to adequate process or transport capacity, or where the distance to existing infrastructure is significant, can be crucial for the development of other resources in the area. Establishing new capacity will allow for phasing-in future discoveries, and will make it possible to develop older discoveries that are not profitable today.
New infrastructure in these areas should have the flexibility to accommodate other discoveries, proven or future. The Norwegian Offshore Directorate has been particularly concerned with ensuring that the development of 7324/8-1 (Wisting) has the flexibility to also accommodate future additional resources. This particular area in the Barents Sea, has significant resource potential, but there is no existing infrastructure.
7324/8-1 (Wisting)
7324/8-1 (Wisting) in the Barents Sea is the largest oil discovery on the NCS that has yet to be developed. The licensees are working on the project, which is also a strategically important for developing infrastructure in this region. If the development solution has the flexible capacity to accommodate future additional resources, the value of the oil and gas resources in the area will increase.
Different solutions are being considered for the gas volumes, including a coordinated solution with the Johan Castberg and Snøhvit fields. More information about this can be found in the Norwegian Offshore Directorate's annual report for 2023.
Too few discoveries are realised
In addition to high returns, licensees on the NCS require the development of discoveries to be economically resilient against oil and gas prices that are substantially lower than forecasted (see also fact box on market failure and improved recovery in chapter 5).
As a consequence, socio-economically profitable discoveries can end up not being developed and investments, production and value creation on the NCS would decrease for society.
Break-even price as a criterion for decision-making
The break-even price illustrates a project's resilience against lower market prices. It is defined as the average future oil price a discovery needs to achieve in order to cover all future investments and operating costs and simultaneously yield a good return on capital.
Since the oil price plunge in 2014, break-even price requirements have increasingly been used as a criterion to assess whether or not to develop a discovery. For example, a 30 USD/bbl break-even price requirement could mean that projects with a higher break-even price are not realised. Break-even price requirements are also used to choose development concept(29).
Break-even price developments
The Norwegian Offshore Directorate has compared the relationship between break-even prices and actual oil prices from 2010 to 2024 for 94 different projects, 71 of which were discoveries. This comparison shows that, with the exception of 2 projects, the break-even price was lower than the oil price when the PDO was approved. With a few exceptions, the calculated break-even price has been below USD 60.
During the period from 2010 until the oil price plunge in 2014, the break-even price was higher than during the subsequent period leading up to the pandemic in 2020. The results are shown in figure 5.16.
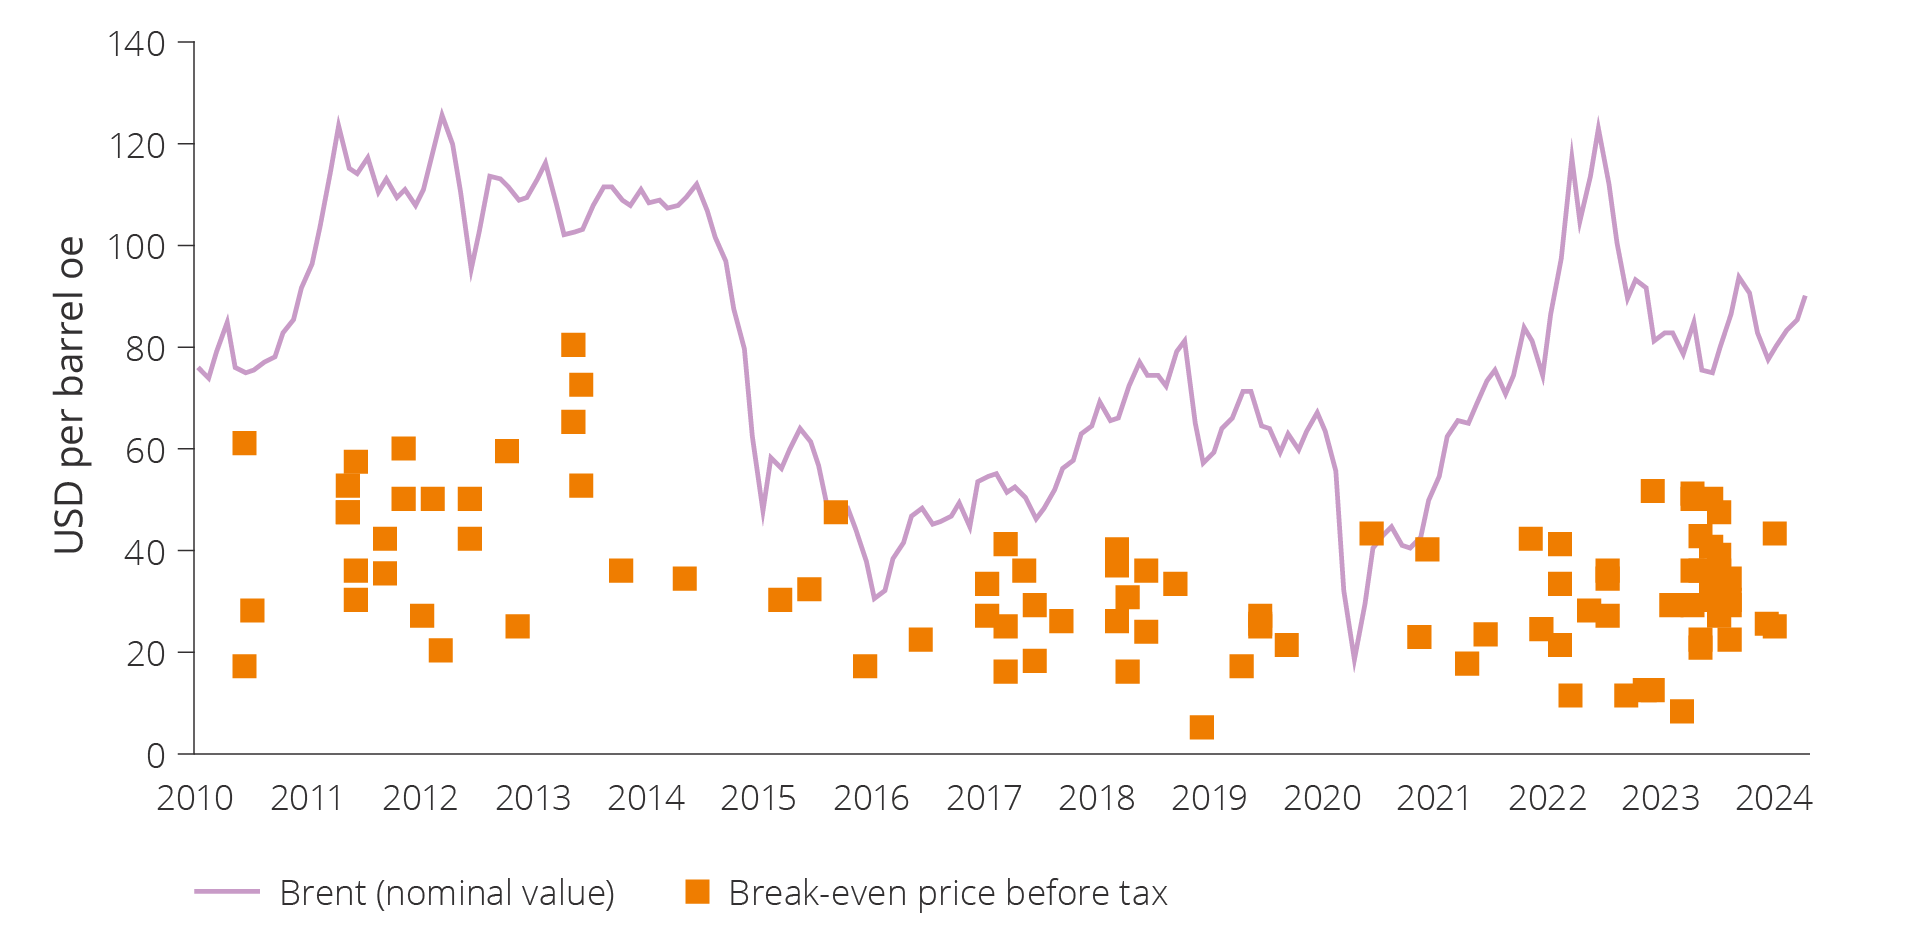
Figure 5.16 Break-even prices before tax for development projects with PDO, amended PDO or PDO exemption. The figure shows the break-even price for different discoveries (fields) when the PDO was approved. The break-even price is calculated with a 7 per cent discount rate.
More PDOs were submitted after 2020 than during the preceding period. As many as 13 PDOs were submitted in 2022. There have been more discoveries with a break-even price exceeding 40 USD/barrel after 2020, compared to the period following the oil price decline in 2014 up to 2020.
There are various explanations for this development. One could be the temporary amendments to the Petroleum Tax Act(30), which in a situation characterised by immense future uncertainty, were introduced to prevent development projects from being shelved during the 2020 pandemic.
This adjustment, combined with oil and gas prices eventually rising from a very low level in 2020, prevented the projects from being put on hold. The increased prices also led to a gradual rise in future price expectations, thereby reducing uncertainty about the future.
The comparison shows that the value of all projects realised under the temporary tax amendment from 2020–2022 is significant. The net present value amounts to 450 billion 2024-NOK. The projects are ranked according to their net present value as shown in figure 5.17.
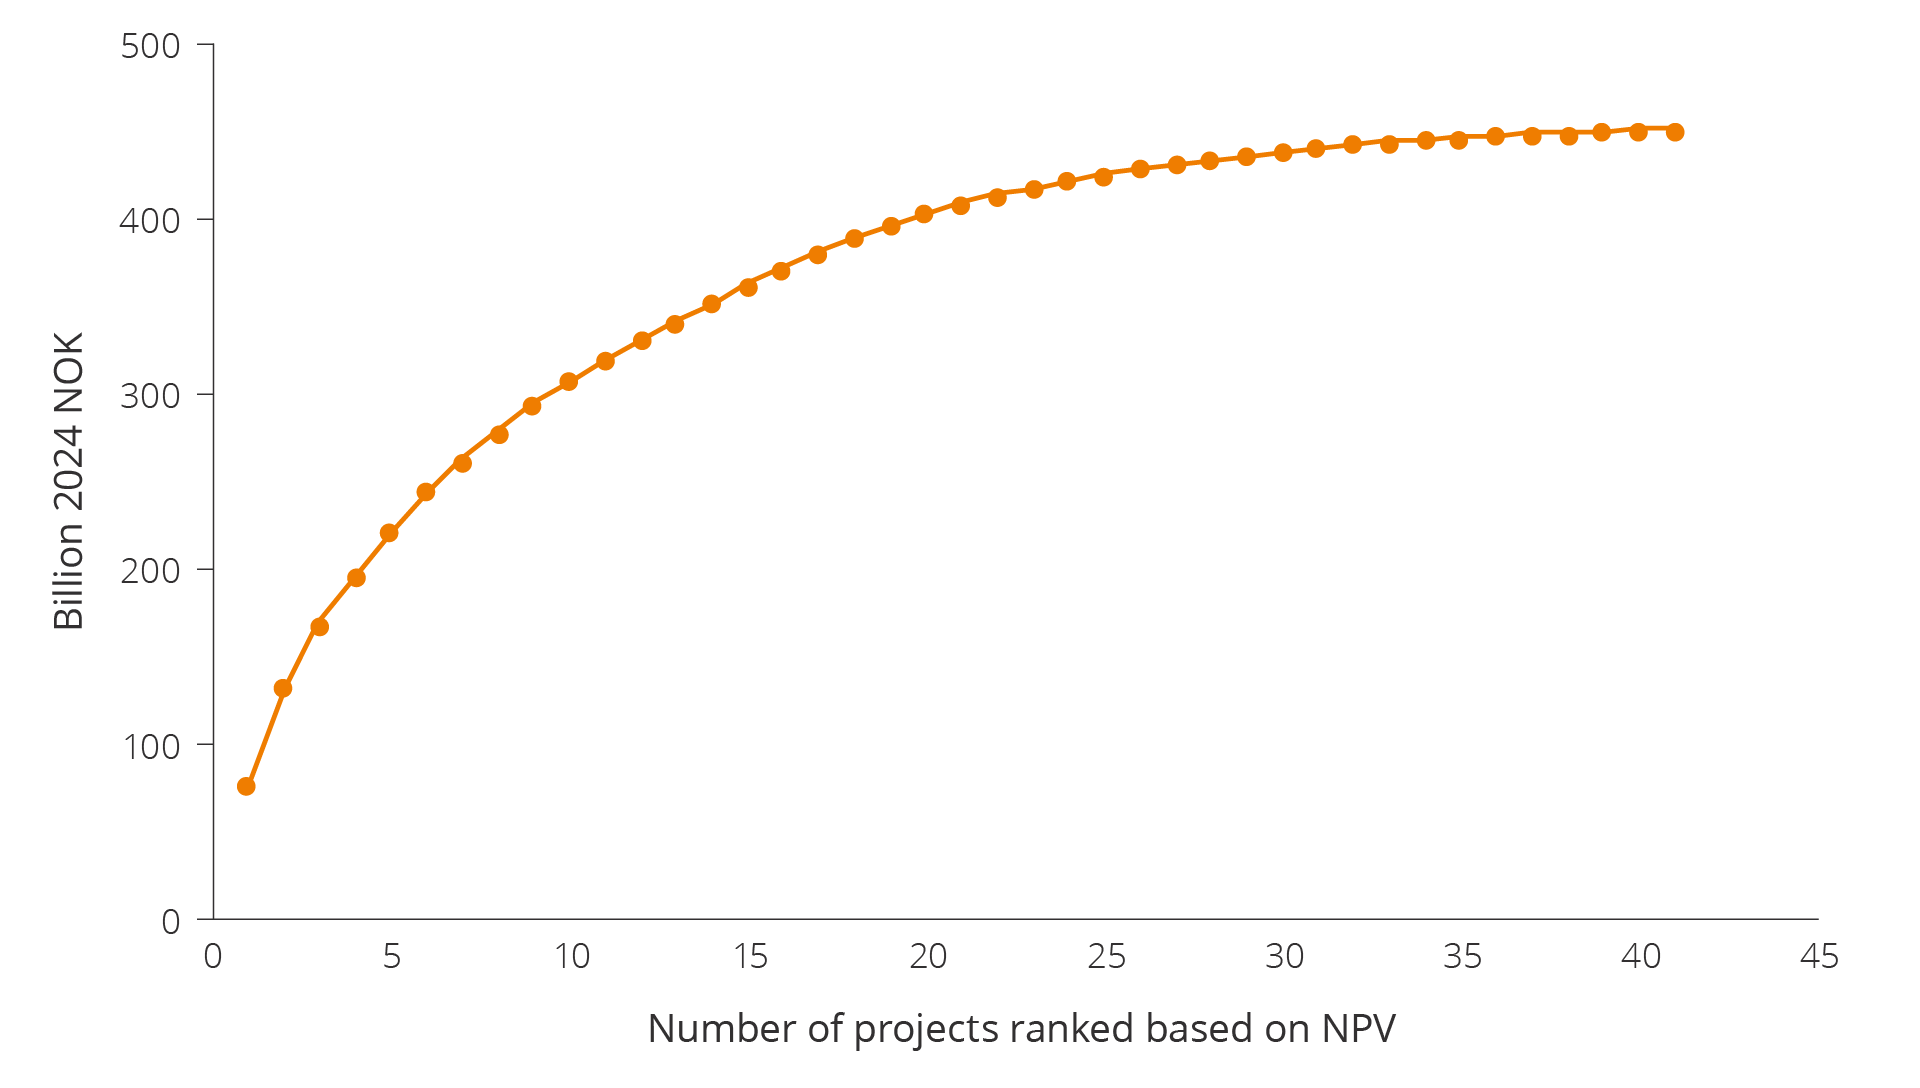
Figure 5.17 Accumulated value from projects realised under the temporary tax amendment in 2020–2022. Product prices are projections from the national budget/revised national budget.
Undeveloped gas discoveries
82 gas discoveries have yet to be developed. Two of the largest are 35/2-1 (Peon), a very shallow gas discovery in the North Sea, and 6406/9-1 (Linnorm) in the Norwegian Sea, which has somewhat tight reservoirs deep below the seabed. Extraction is highly unlikely for 47 of these discoveries; resource class 6; see chapter 3).
Shallow or tight reservoir are two of the reasons why discoveries are not developed. One of the primary challenges associated with shallow reservoirs is low pressure. Challenges associated with tight reservoirs include low flow rates.
Other reasons include difficult gas compositions that can be expensive to produce or treat. There could also be a lack of nearby infrastructure. Licensees and operators de-prioritise the development due to a lack of personnel, technology and materials. The reasons for delaying developments are diverse and often complex; see also market failure in chapter 3.
Targeted efforts to implement technology to increased productivity in tight and shallow gas reservoirs can contribute to improved recovery and value creation and is further discussed in chapter 6.
Examples of undeveloped gas discoveries
35/2-1 (Peon)
Peon in the North Sea is one of the largest gas discoveries on the NCS that has yet to be developed. The discovery was made in 2005 and is located north of the Gjøa field. 27 billion scm of gas has been proven. The resources are located less than 1000 metres below sea level and in somewhat unconsolidated sandstone. The gas is dry, meaning that it consists of nearly pure methane (99.5 per cent).
One of the primary challenges associated with shallow reservoirs is low original pressure and therefore low gas density (Resource report (2019)(31). This makes it difficult to achieve effective drainage of sufficient volumes per well.
Because the reservoir in 35/2-1 (Peon) is very shallow, a test well was drilled in 2020 to confirm the possibility of drilling a relief well. Compression may be needed to recover the gas, either offshore or at a receiving facility. As of 2024, the licensees are working on studies to choose a development solution.
6406/9-1 (Linnorm)
In the Norwegian Sea several discoveries were made in tight reservoirs, including 6406/9-1 (Linnorm). This reservoir is located 5000 metres below sea level and has a relatively high content of both CO2 and H2S. Recovery is difficult due to pressure as high as 840 bars, temperature as high as 184 degrees and a complex reservoir with variable quality.
This discovery consists of large accumulations of gas in deep and tight reservoirs. High pressure, high temperature and cementation as a result of increasing depth all contribute to difficult extraction of the resources (see also Resource report 2017(32).
Poor gas quality can represent a considerable cost for discoveries that already face other challenges, such as considerable water depth, a tight reservoir or a significant distance to existing infrastructure.
In some instances, delaying a development could open up new possibilities. New technology can help ensure that more of the gas in tight zones can be recovered. This can also result in a diminished need for investments to remove CO2 due to the new opportunities for dilution.
Exploration builds the foundation for long-term production
There are still substantial undiscovered resources on the NCS. Undiscovered resources are the volumes of petroleum estimated to be recoverable from accumulations that have not yet been proven by wells. To secure sufficient resources and sustain both activity and production over time, exploration must be intensified, both near existing infrastructure and in less mature areas.
Undiscovered resources represent significant opportunities in both mature and less explored areas. Increased understanding, better data coverage, new ways of working and the application of emerging technologies can lead to new exploration opportunities and result in profitable discoveries.
The expected undiscovered resources contain assumptions concerning the number and size of undiscovered petroleum accumulations. Based on these assumptions, and including estimates for well counts of future wildcat wells, discovery rates and lead times from discovery to first oil, a production forecast for these future discoveries is calculated.
The volumes we project that can come on stream until 2033 are shown in figure 5.18. Since it can take several years from when a discovery is made until it comes on stream, production from exploration will be limited leading up to 2030.
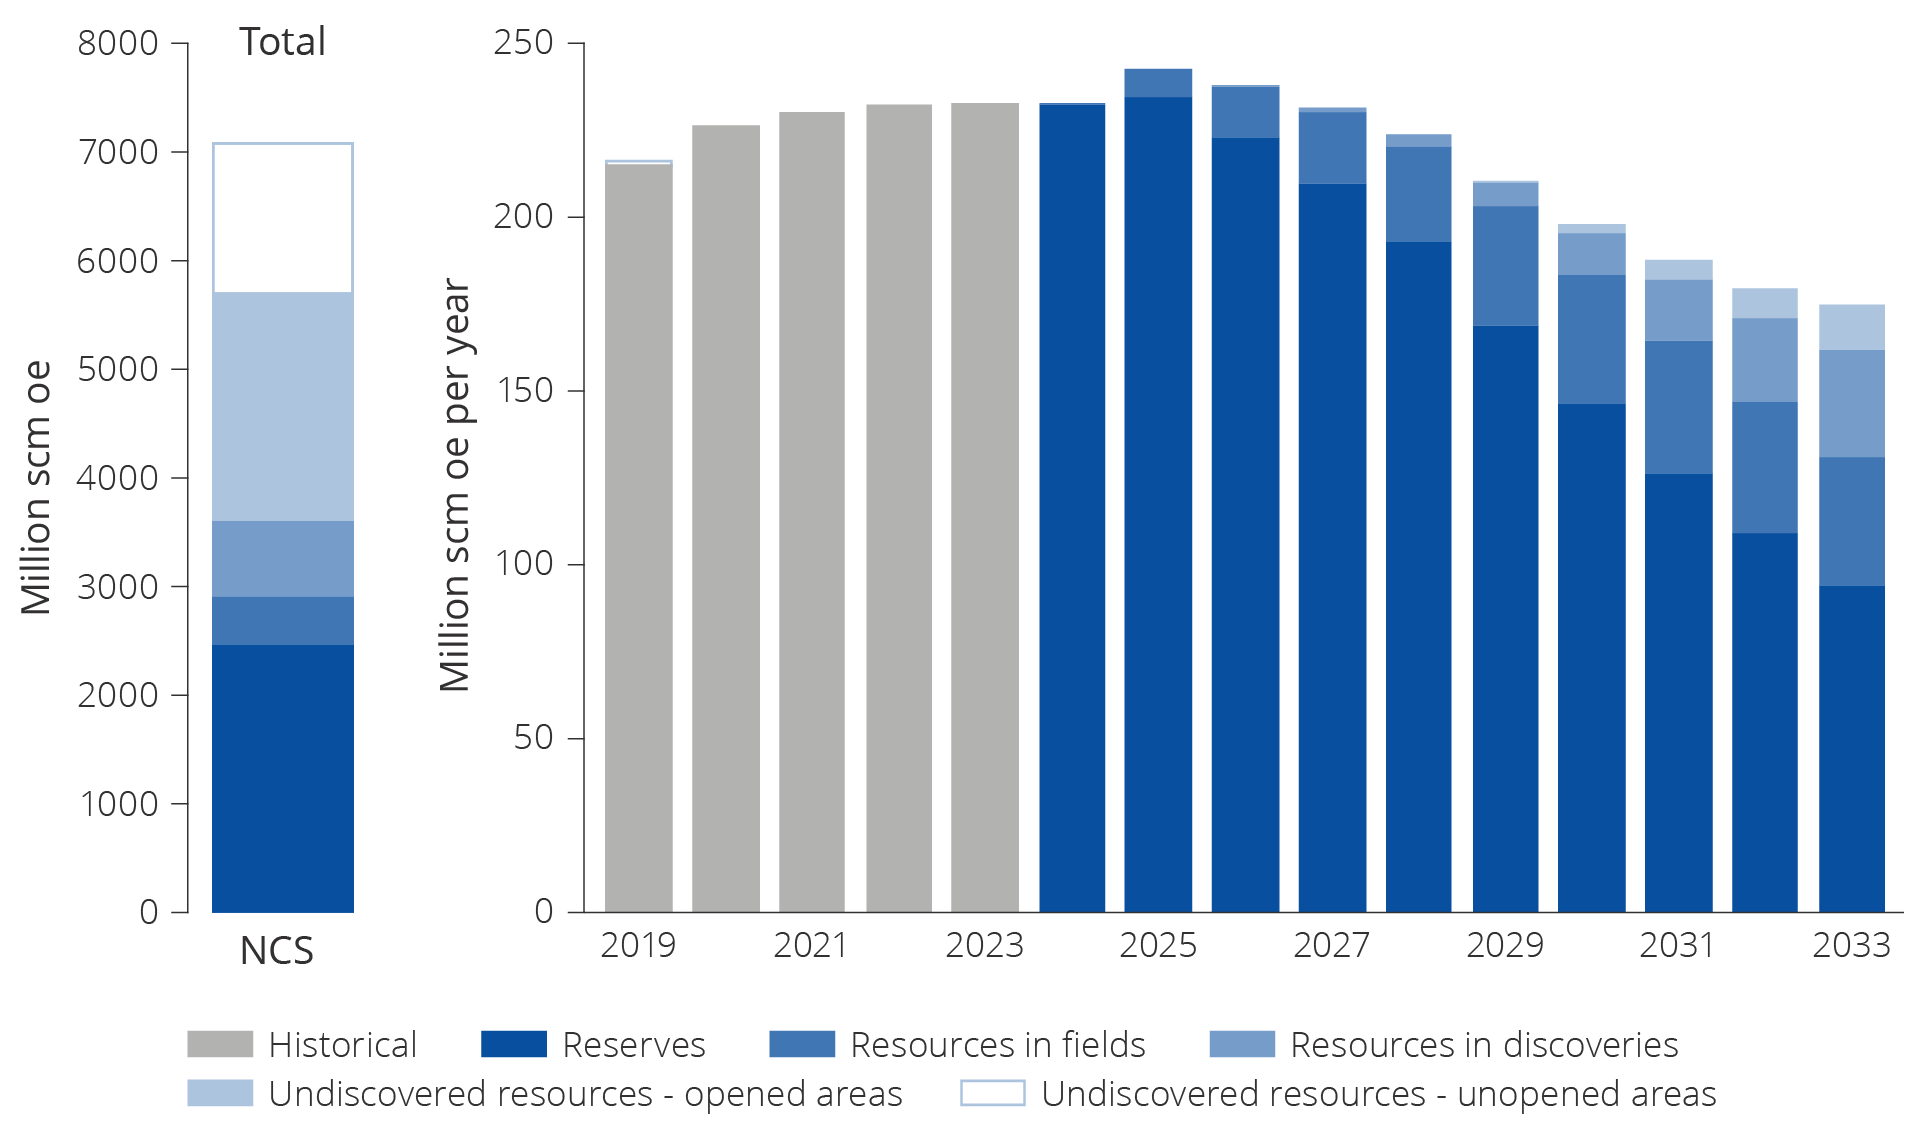
Figure 5.18 Remaining reserves and resources. Total historical production 2019–2023, expected future production from reserves and resources in fields and discoveries and undiscovered resources in opened areas in 2024–2033.
Substantial undiscovered resources
The Norwegian Offshore Directorates responsibility is to have the best knowledge on the resources on the NCS. It is therefore important to maintain the best possible and most up-to-date overview of the resource base. This is achieved through the Directorate's own geological work and data collection, by obtaining and processing external data, including data from the industry. Continuous review and application of established methodologies to evaluate the resource potential and increase the understanding of the resource base are key.
The updated estimate for undiscovered resources is 3480 million scm oe (figure 4.3, chapter 4). More than half (60 per cent) of the undiscovered resources are expected to be in areas already opened for petroleum activities. They are distributed across the shelf with 28 per cent in the Barents Sea, 14 per cent in the Norwegian Sea and 18 per cent in the North Sea. Figure 5.19 shows the distribution of resources in opened and unopened acreage for each region.
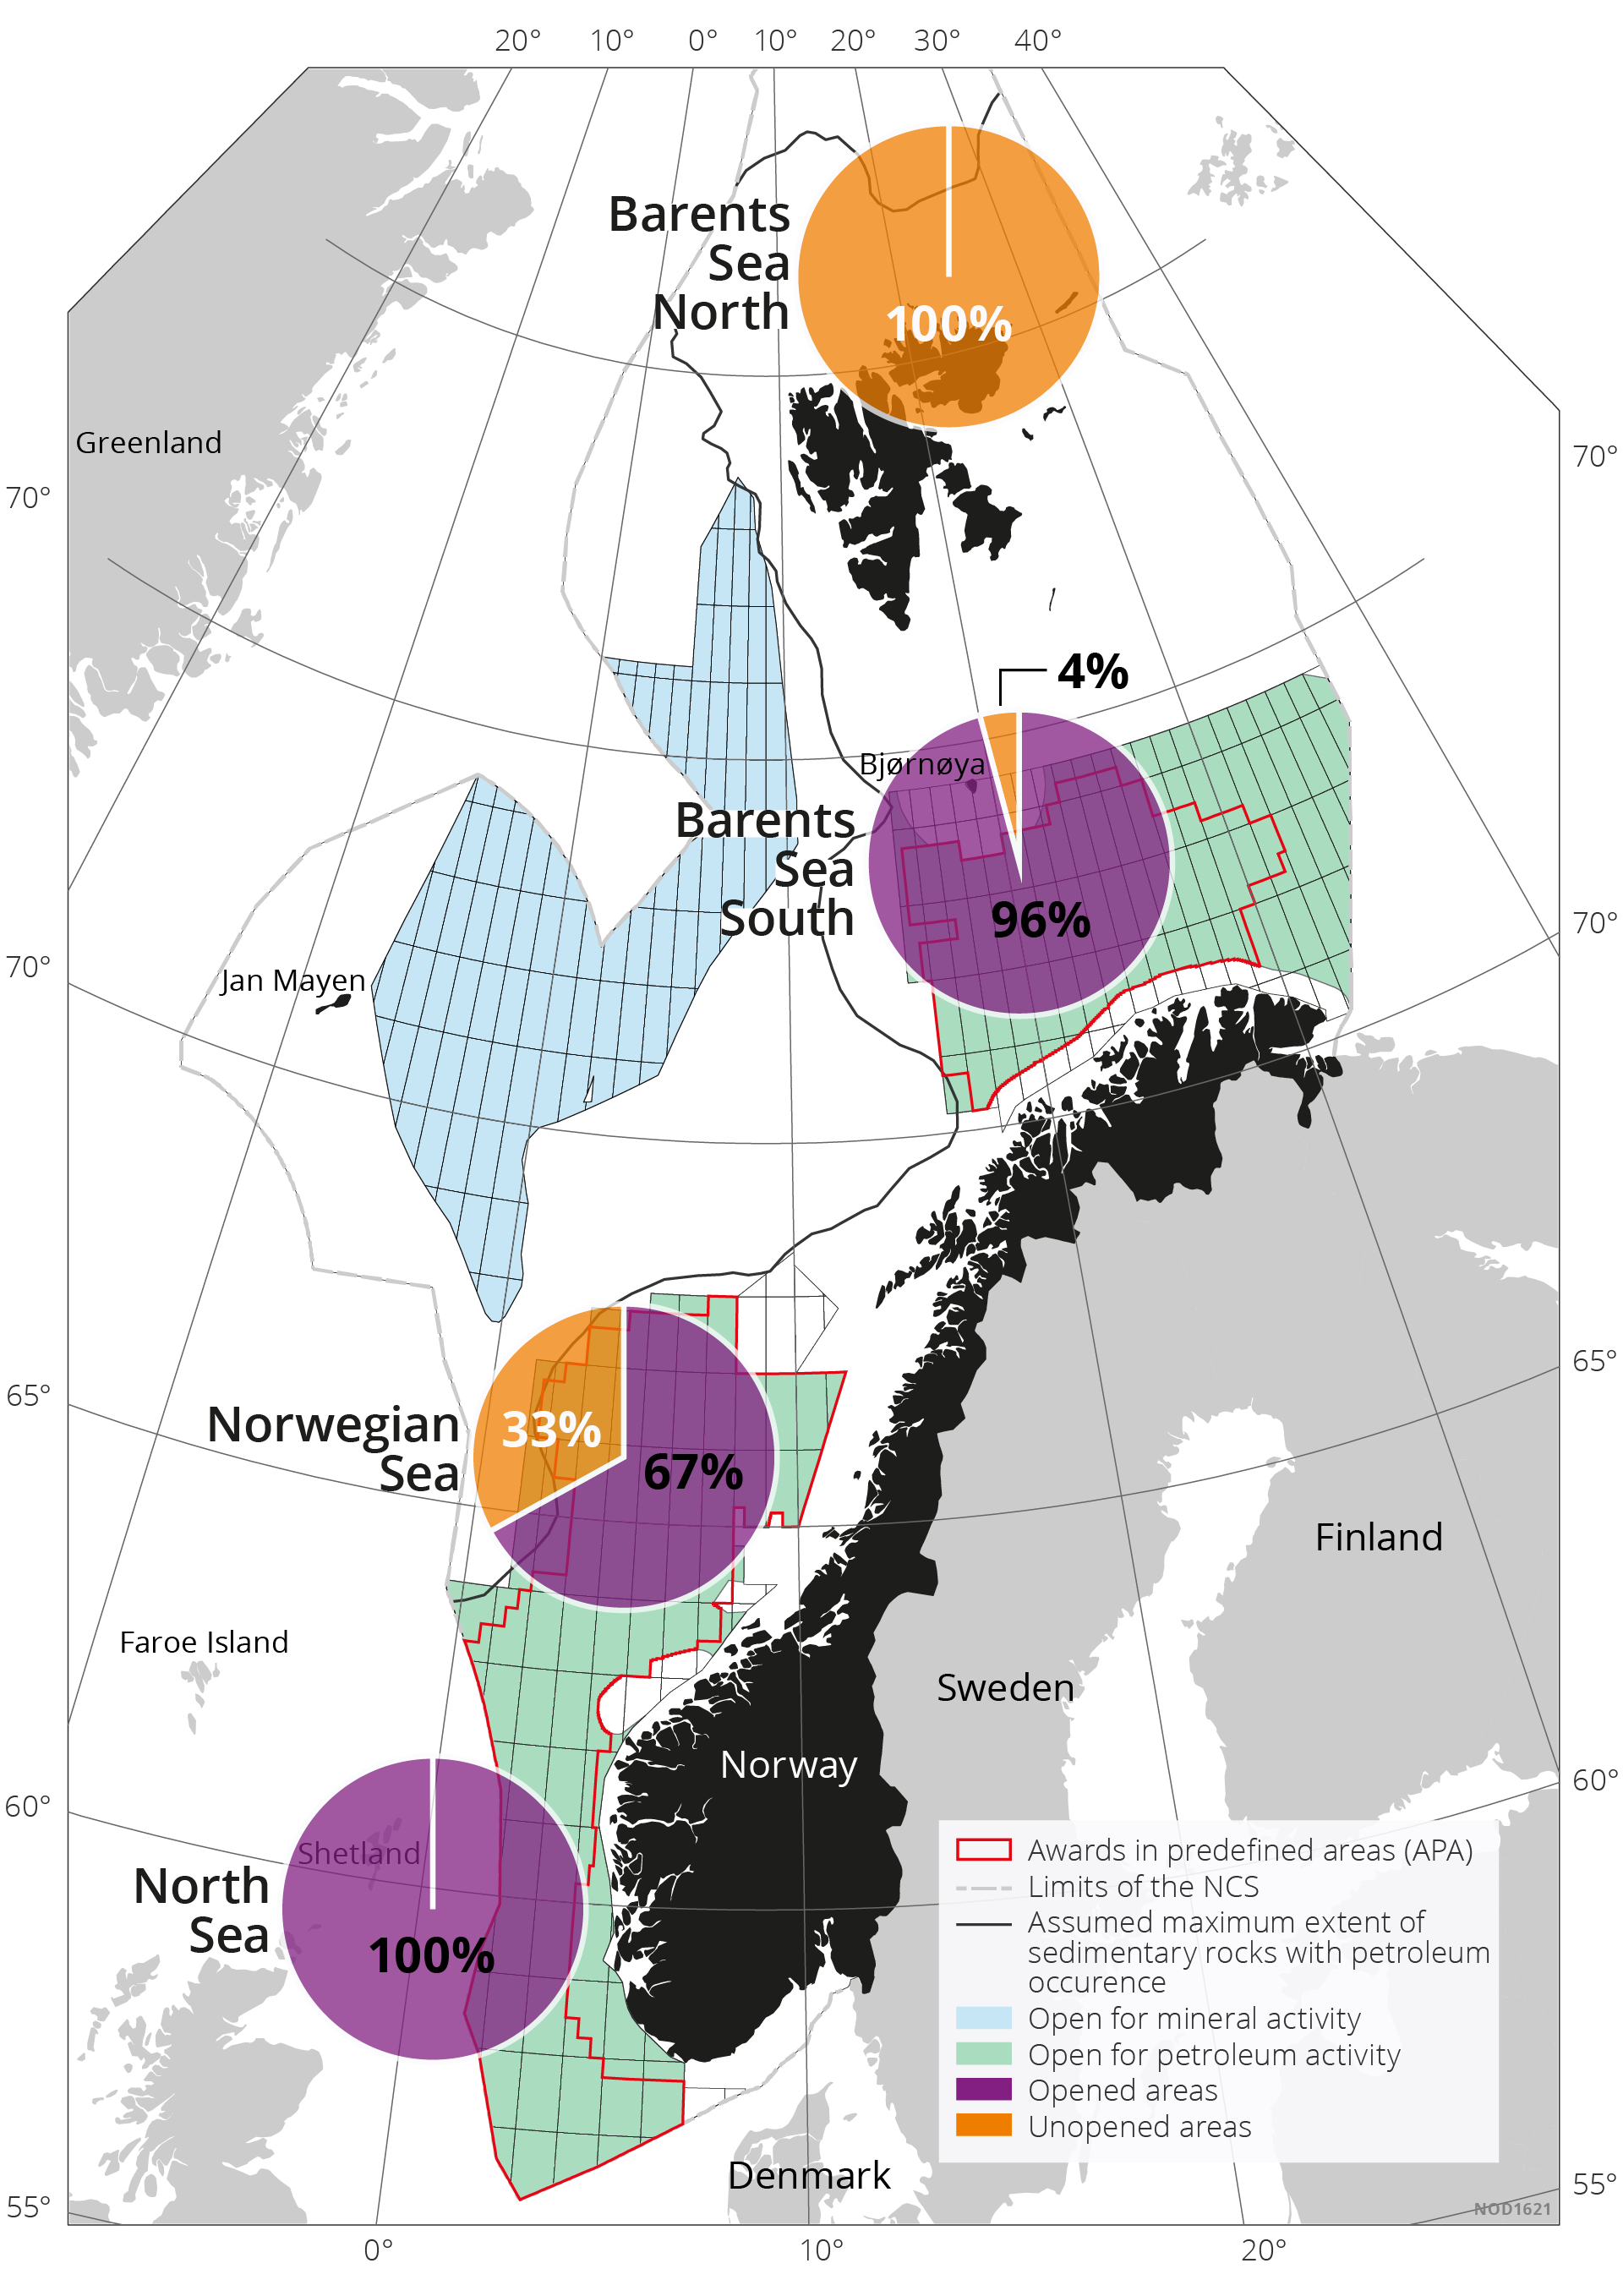
Figure 5.19 Percentage distribution of undiscovered resources across opened and unopened areas.
Tables 5.1 and 5.2 reflect the probability distribution with P95 and P05 estimates. The tables reflect the likely volume of undiscovered resources greater than or equal to 95 per cent and 5 per cent, respectively.
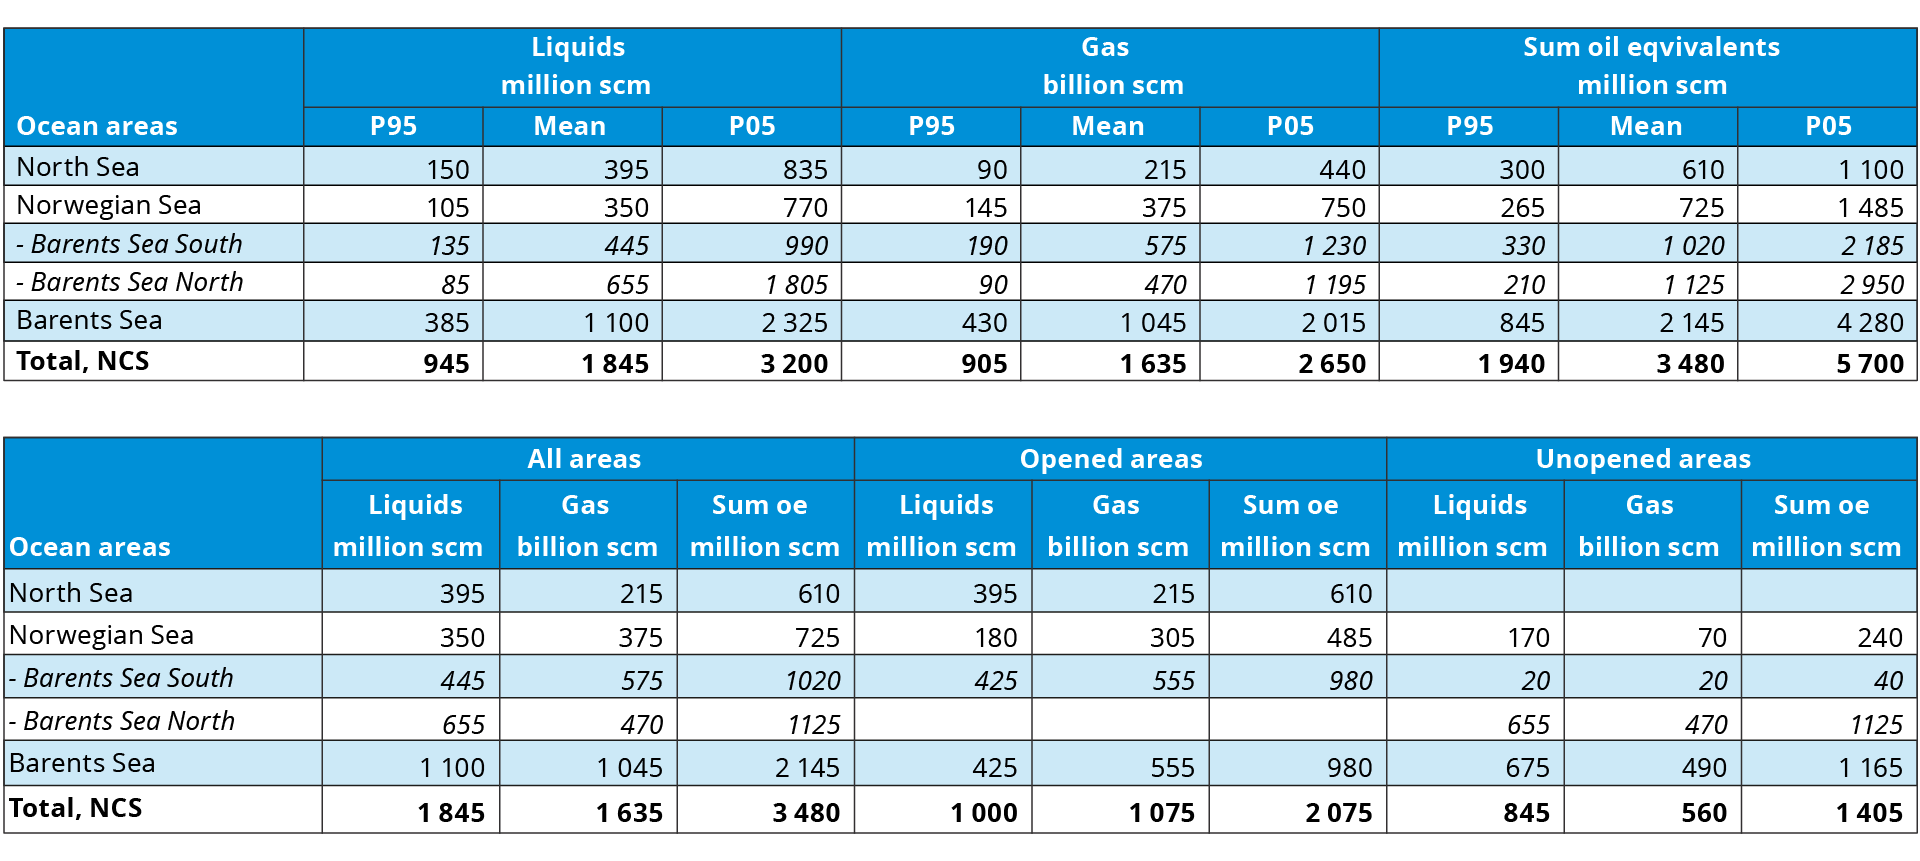
Table 5.1 and 5.2 Resource accounts as of 31 December 2023.
Estimating undiscovered resources
The Norwegian Offshore Directorate uses a statistical method called “play analysis” to calculate undiscovered petroleum resources. The method systematises and describes the geological understanding of an area in defining plays.
The analyses of more than 70 plays form the basis for the estimated undiscovered resources. Some of the most important parameters that are incorporated in the analyses are the number of prospects and leads (potential petroleum accumulations), volume and likelihood of success. The Directorate also receives information about mapped prospects and leads through applications in licencing rounds and from documentation in active and relinquished production licences which supplement the analyses.
Well information, discovery rates and recovery rates, as well as other data collected through the Directorates field work or seismic mapping are further included in the analyses. All plays are initially analysed individually and afterwards dependencies between relevant models are applied. The resulting estimated resources are then summarised by area, in order to achieve an overall estimate for the North Sea, Norwegian Sea and Barents Sea (south and north), respectively.
The estimates for undiscovered resources in areas open for petroleum activities are updated on an annual basis. The update is based assessments surrounding the previous year's exploration results, any potential new studies as well as relevant information from the companies. In areas that have not been opened for petroleum activities, the estimates are only updated if for example new data has been acquired and has provided significant new information.
The extent to which the estimates will change in the light of new well results will depend on both, the extent to which the well results deviate from expected results, and often the amount of data available (knowledgebase) before the well was drilled. Estimates for a mature play with multiple wells and numerous discoveries will typically not change to the extent of, for example, a play without discoveries or previous wells.
Even if the database of an analysis is extensive, estimates will always be accompanied by a certain level of uncertainty. The drilling of wells is the only way to prove or disprove the occurrence and size of hydrocarbon accumulations. There is less uncertainty in areas where several wells have already been drilled, since large quantities of well data and geological information have led to increased knowledge about the area.
The expression ‘yet-to-find’ is frequently used for undiscovered resources. It implies an estimate of what will be discovered, rather than an estimate of what can be discovered. The Norwegian Offshore Directorate's estimate of undiscovered resources covers the oil and gas that can presumably be proven and produced with current knowledge and current technology. This estimate includes no assumptions concerning profitability or exploration activity.
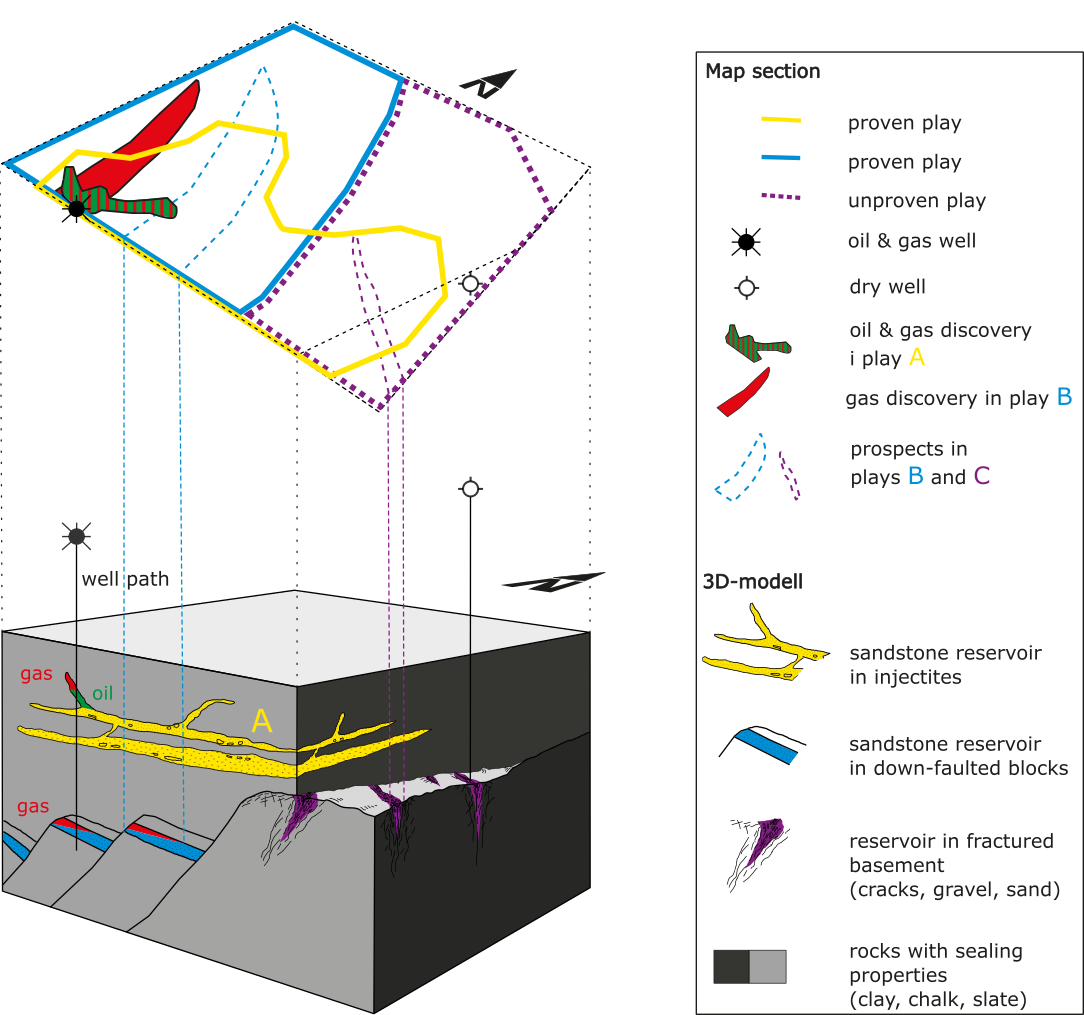
The t-dimensional map shows a projection of different plays, discoveries and wells based on their spatial location (3D block). The methodology, plays and prospects are explained in detail in Chapter 2 of the Resource report 2022 and Chapter 3 of Resource report 2020. In this figure, the discovery well in the west was drilled to test play A and B. The well proved oil and gas in play A and gas in play B, thereby confirming the plays. This means that the petroleum system is working: i.e. migration into reservoirs is working, the plays have traps that prevent oil and gas from migrating to the surface and a reservoir container is present. The eastern well tested play C, in this case reservoirs in fractured basement rock, but he well did not prove hydrocarbons (dry well). Play C was therefore not confirmed.
Undiscovered resources in unopened areas in the Barents Sea
An important part of the Norwegian Offshore Directorate's work has historically been to map unopened areas in an effort to increase understanding and knowledge of the geology in these areas.
Since 2012, we have mainly been gathering data in the Barents Sea North, particularly in the northeastern parts towards the Russian border.
Just over half of the total undiscovered resources in the Barents Sea are located in areas that have be opened for petroleum activities, mostly in the Barents Sea North (see table 5.1 and 5.2.)
This is the area with the greatest likelihood for major discoveries on the Norwegian shelf. The mapping revealed sizeable structures that could contain considerable amounts of oil and gas. Parts of this area could be a prospective petroleum province with several large basins, platforms and highs(33)(34).
The uncertainty is significant, as the mapping is based on limited 2D seismic data and no exploration wells, only shallow boreholes. None of the plays in the area have been confirmed with exploration wells.
Access to acreage
Good access to attractive exploration acreage in licencing rounds is important, in order to maintain exploration activity and facilitate new discoveries. There are two equal licencing rounds on the NCS, numbered rounds and awards in pre-defined areas (APA). Annual APA rounds have taken place since 1999. Numbered rounds in more frontier exploration areas have generally taken place every two years. The last numbered round was announced in 2020.
The number of awards per years is reflected in figure 5.20.
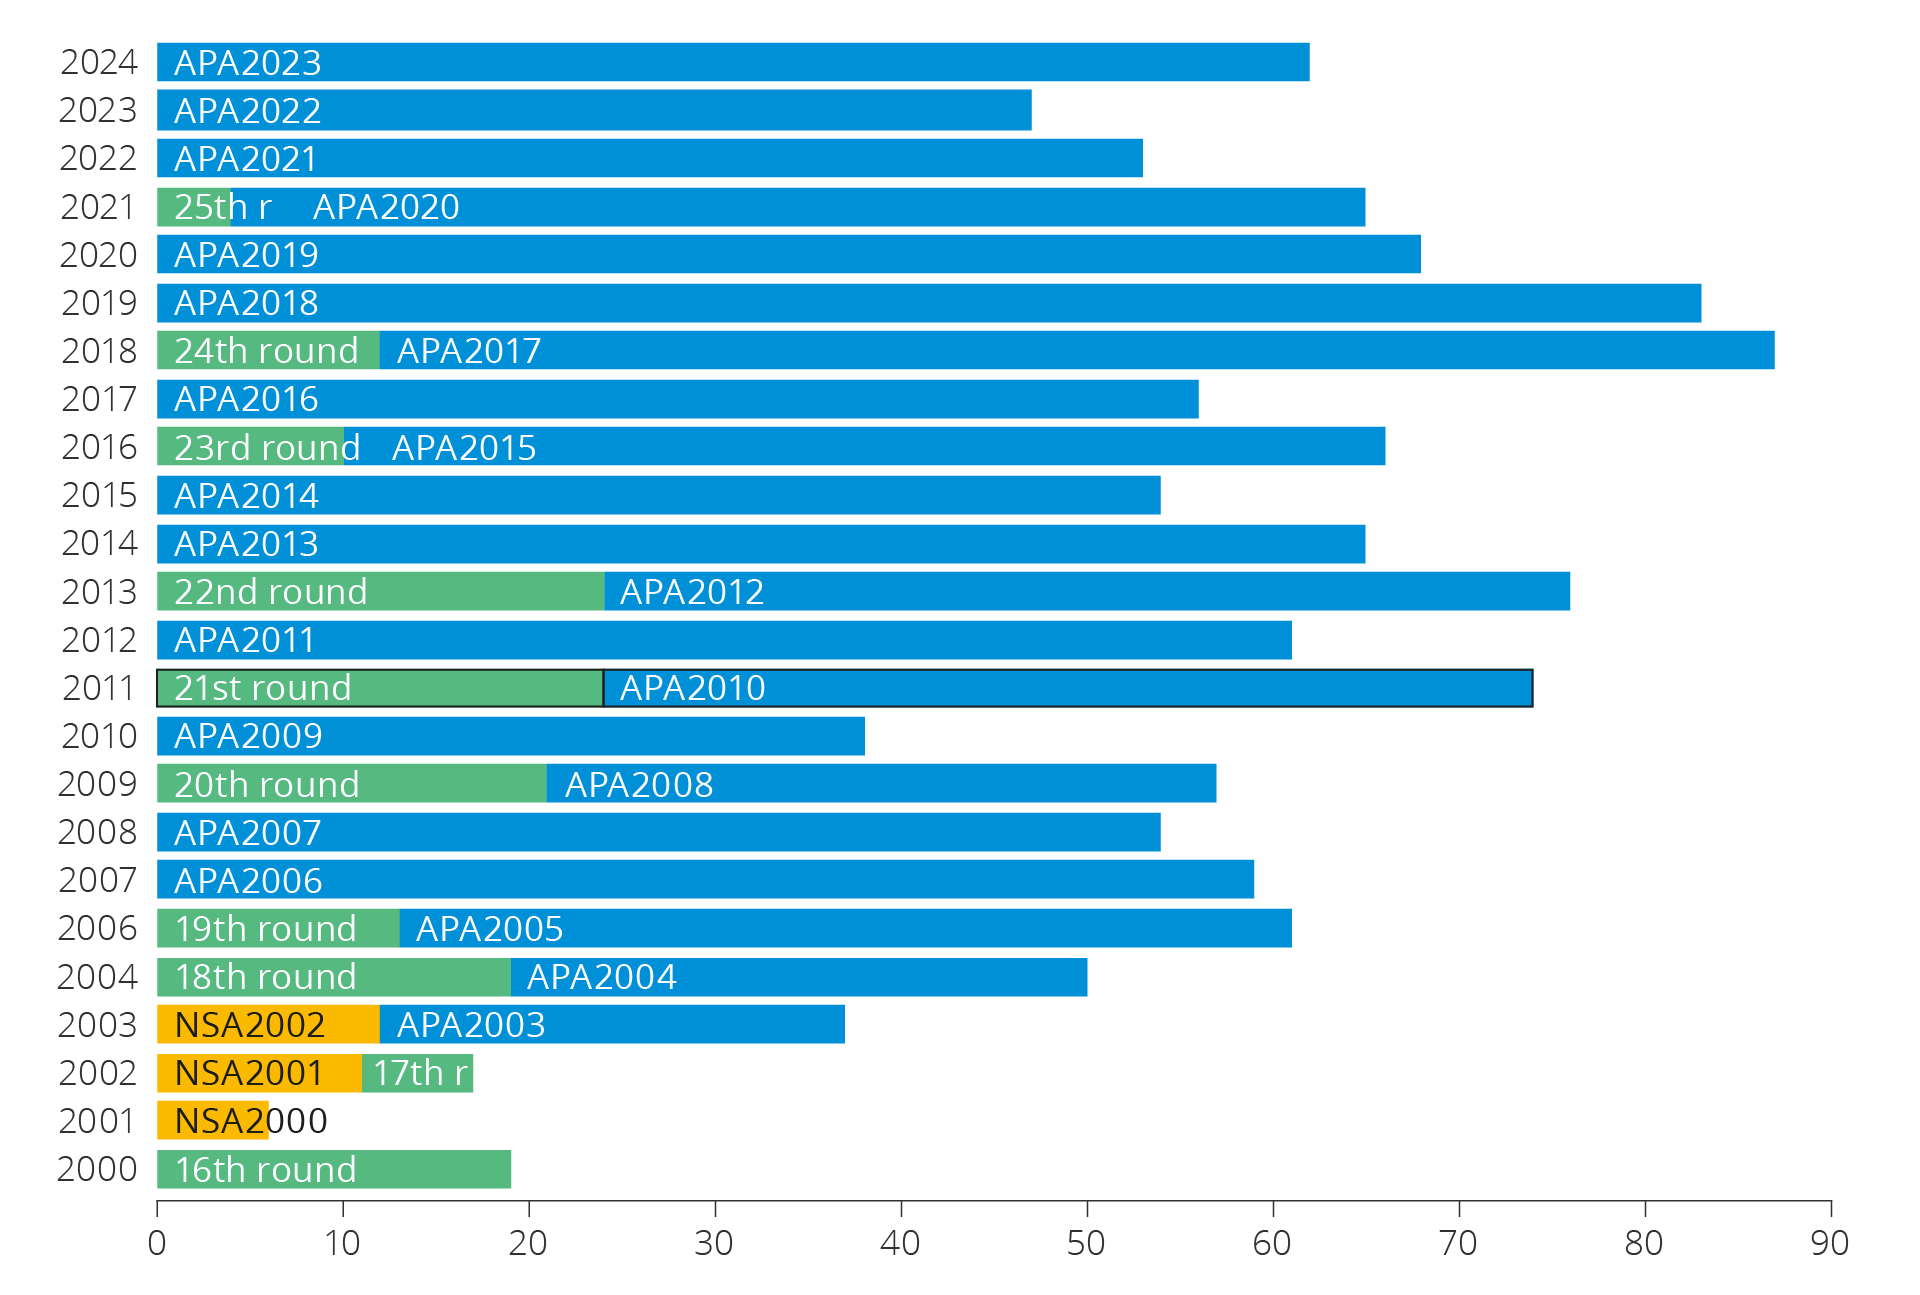
Figure 5.20 Number of production licences awarded since 2000.
The scope of available acreage is reflected in figure 5.21. This illustrates awarded, licensed and relinquished acreage in 1000 km2 increments.
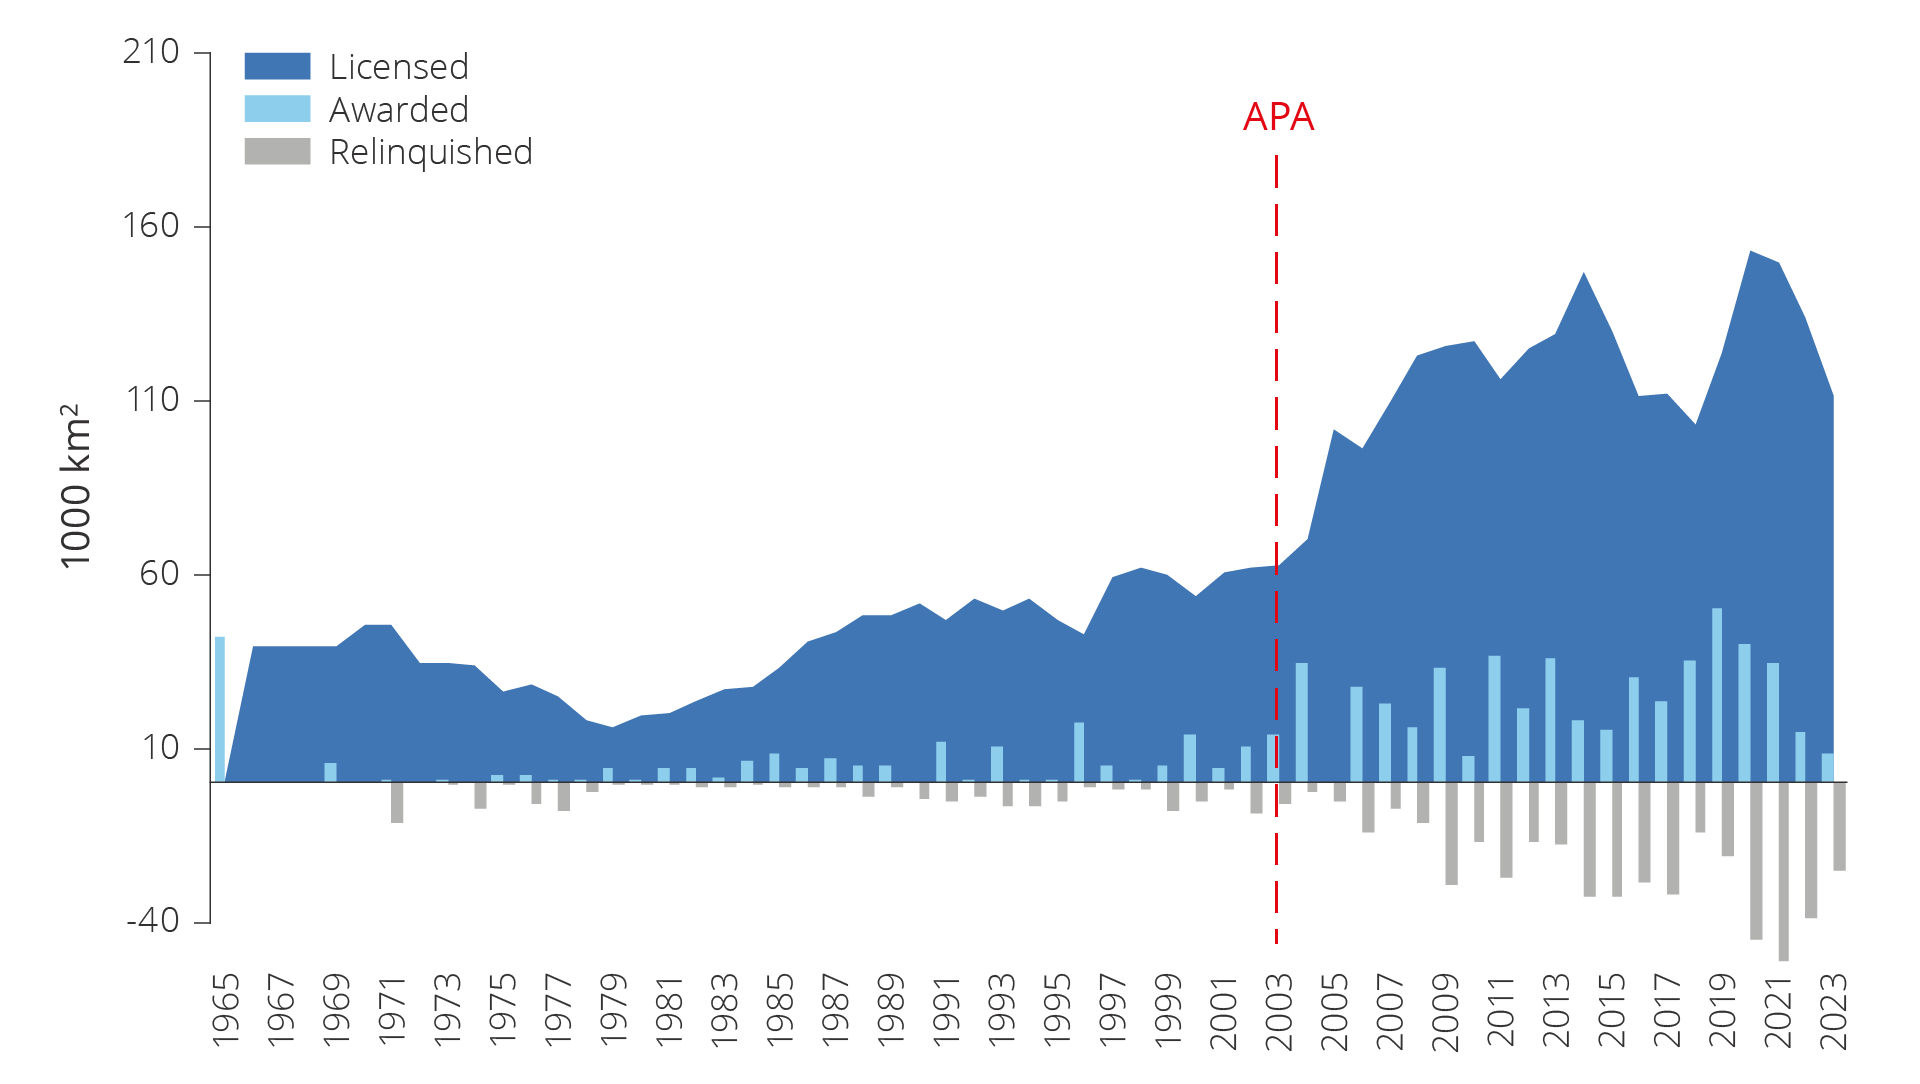
Figure 5.21 Development in available exploration acreage on the NCS.
Exploration trends 2019–2023
150 wildcat wells were completed on the NCS during the 2019-2023 period (see figure 5.22). During the preceding five-year period the number was 156. Between 2014-2023 the annual number of wells completed has been relatively stable at about 30 wells. The number of appraisal wells in 2019–2023 was 43, compared to 73 in 2014–2018. Overall, the number of exploration wells has declined by 16 per cent compared to the preceding five-year period, while the number of wildcat wells has been reduced by 4 per cent.
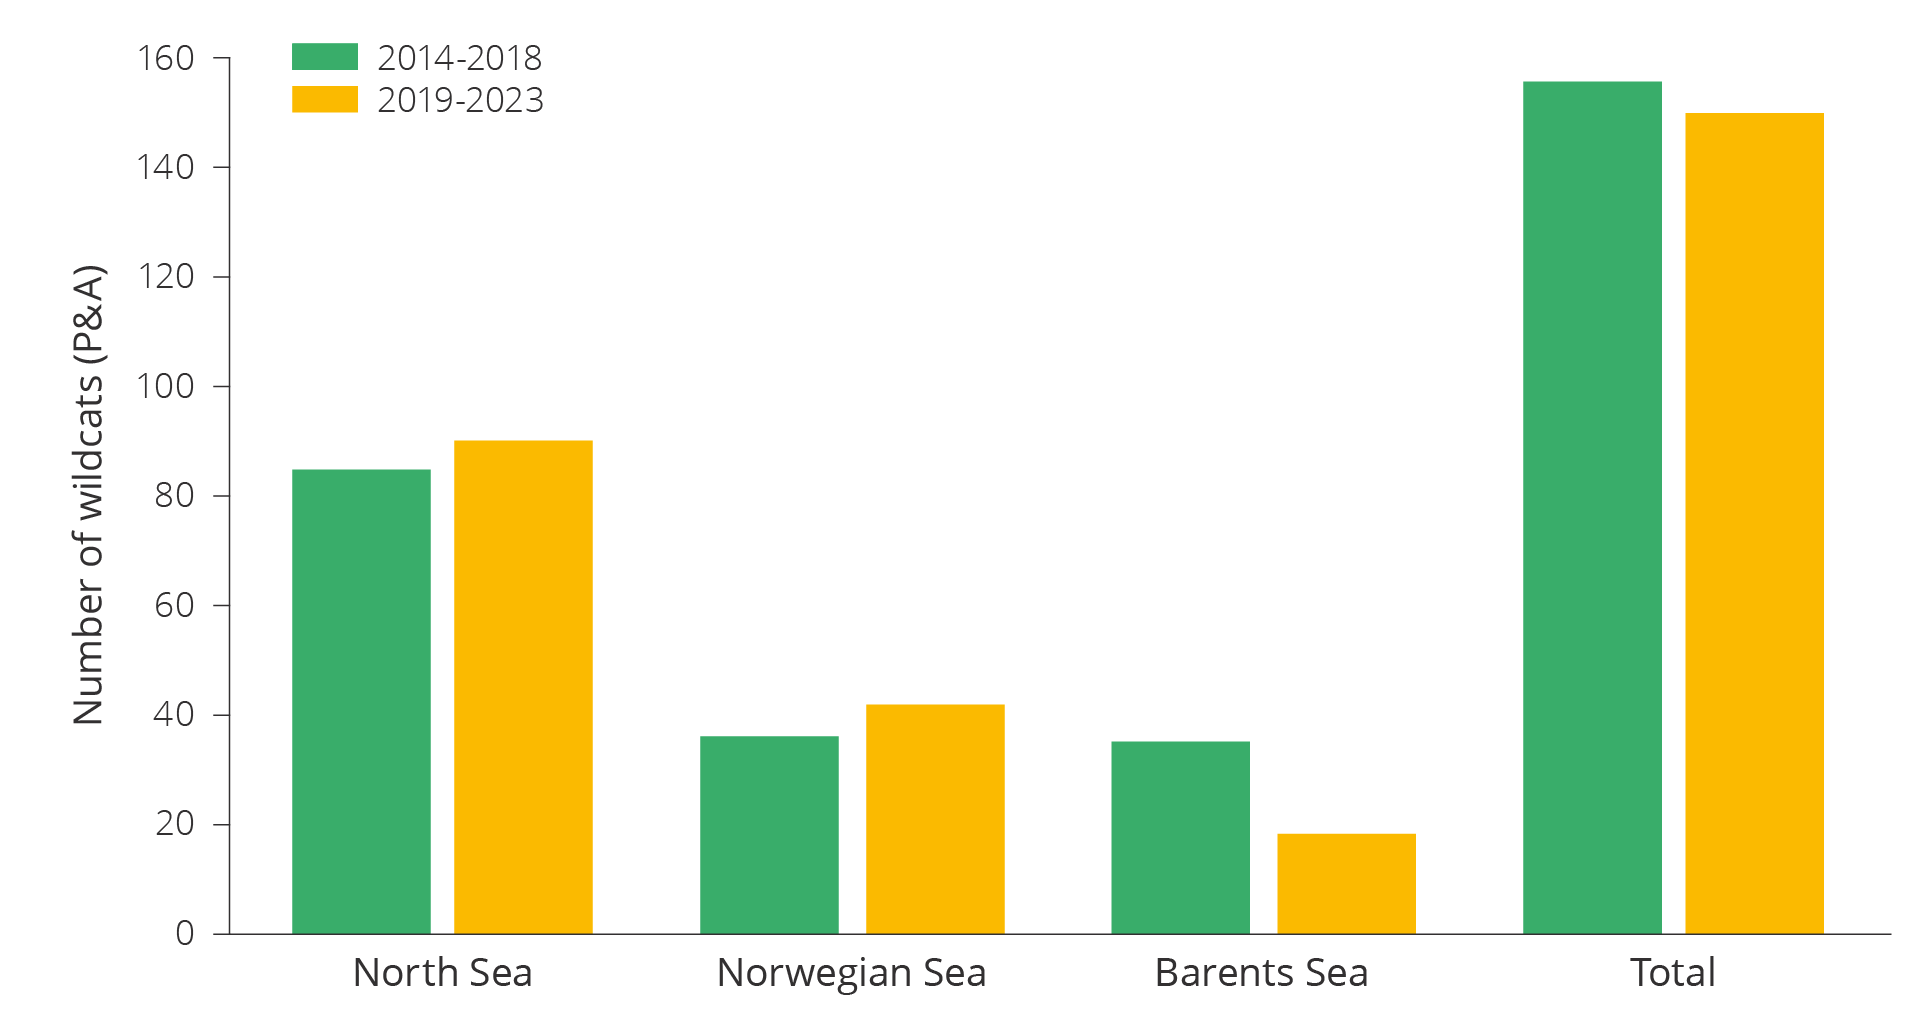
Figure 5.22 Completed wildcat wells on the NCS during the 2014–2023 period.
The number of wildcat wells in the North Sea has increased from 85 to 90 over the last five years, and from 36 to 42 in the Norwegian Sea, while the number in the Barents Sea has declined from 35 to 18.
76 discoveries were made between 2019–2023 as shown in figure 5.23. This is 2 less than the preceding five-year period. However, overall resources proven in discoveries between 2019–2023 amount to 40 million scm more than in the previous five-year period, totalling 290 million scm. It is particularly the North Sea where exploration has led to increased resource (see figure 5.24).
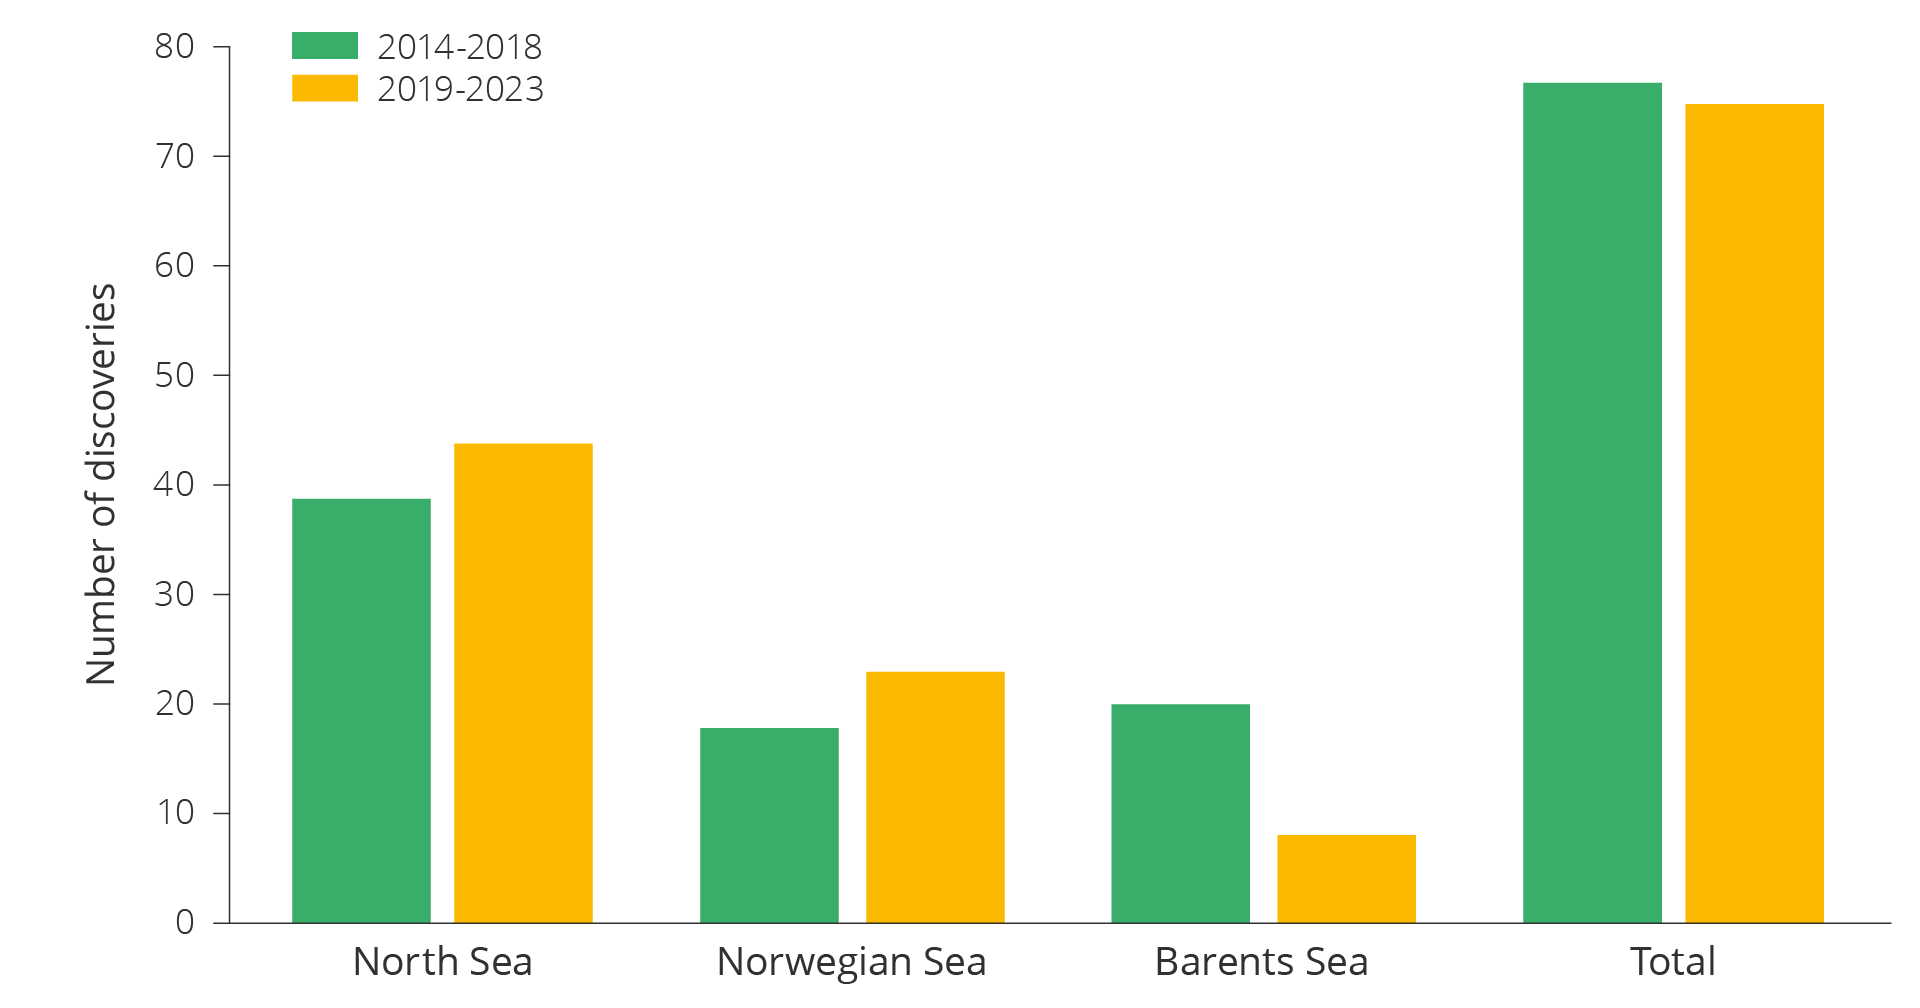
Figure 5.23 Number of discoveries on the NCS in 2014–2023.
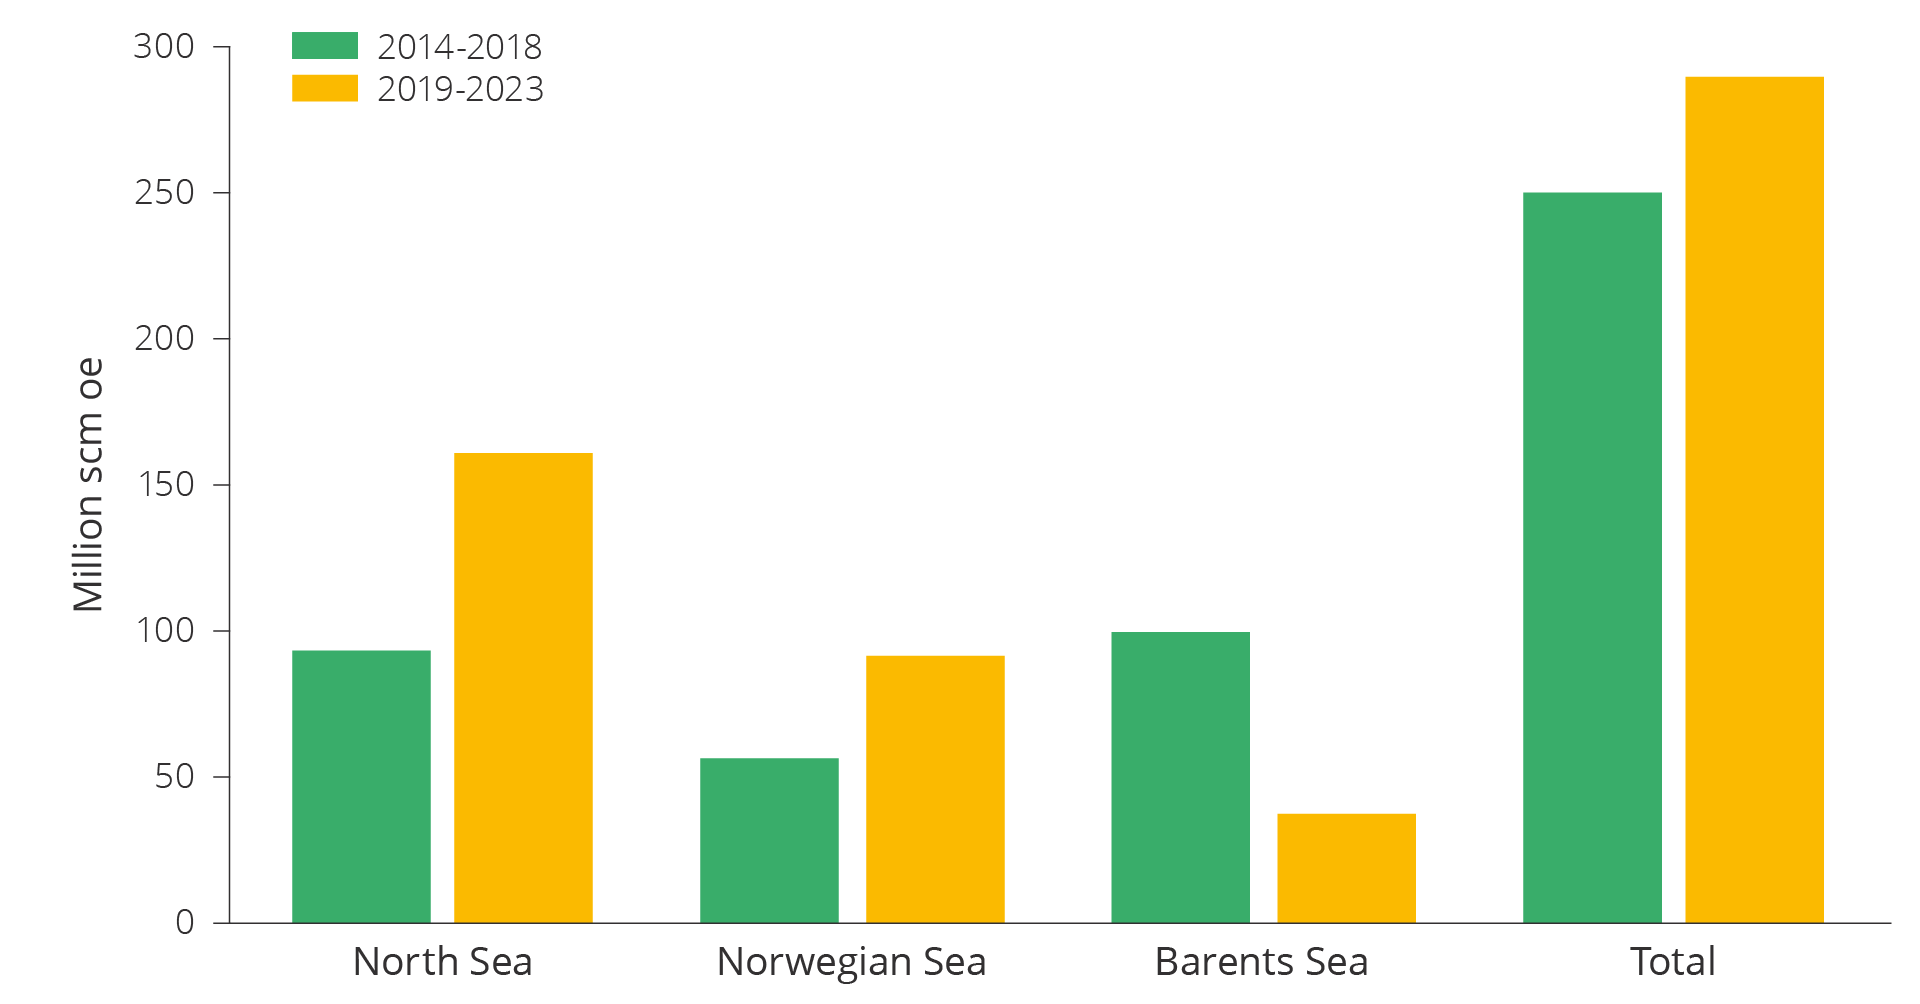
Figure 5.24 Resources in discoveries on the NCS in 2014–2023 (including resources in resource class 6).
Wildcat wells between 2019 and 2023 were largely drilled in known areas. The map on the left of figure 3.25 illustrates the density of wells drilled between 1966 and 2023.
There is a high concentration of wells in the Central Graben in the southern part of the North Sea, to the north in the Viking Graben, on the Tampen Spur and the Horda Platform in the middle and northern part of the North Sea. In the Norwegian Sea most wells were drilled on the Halten and Dønna Terraces. The Barents Sea sees the highest density in and around the Hammerfest Basin, also further north over the Loppa High and in the Johan Castberg area.
The map on the right in figure 5.25 shows that activity in the period between 2019–2023 is concentrated in the same areas as in the map on the left, with the exception of the southern part of the North Sea. There are few wells outside these areas. In the Norwegian Sea, the wells are concentrated on the Halten and Dønna terraces, with only few exceptions. During the first part of this five-year period multiple wells were drilled in less explored areas in the Barents Sea, while most wells were drilled in the Johan Castberg area toward the end of the period.
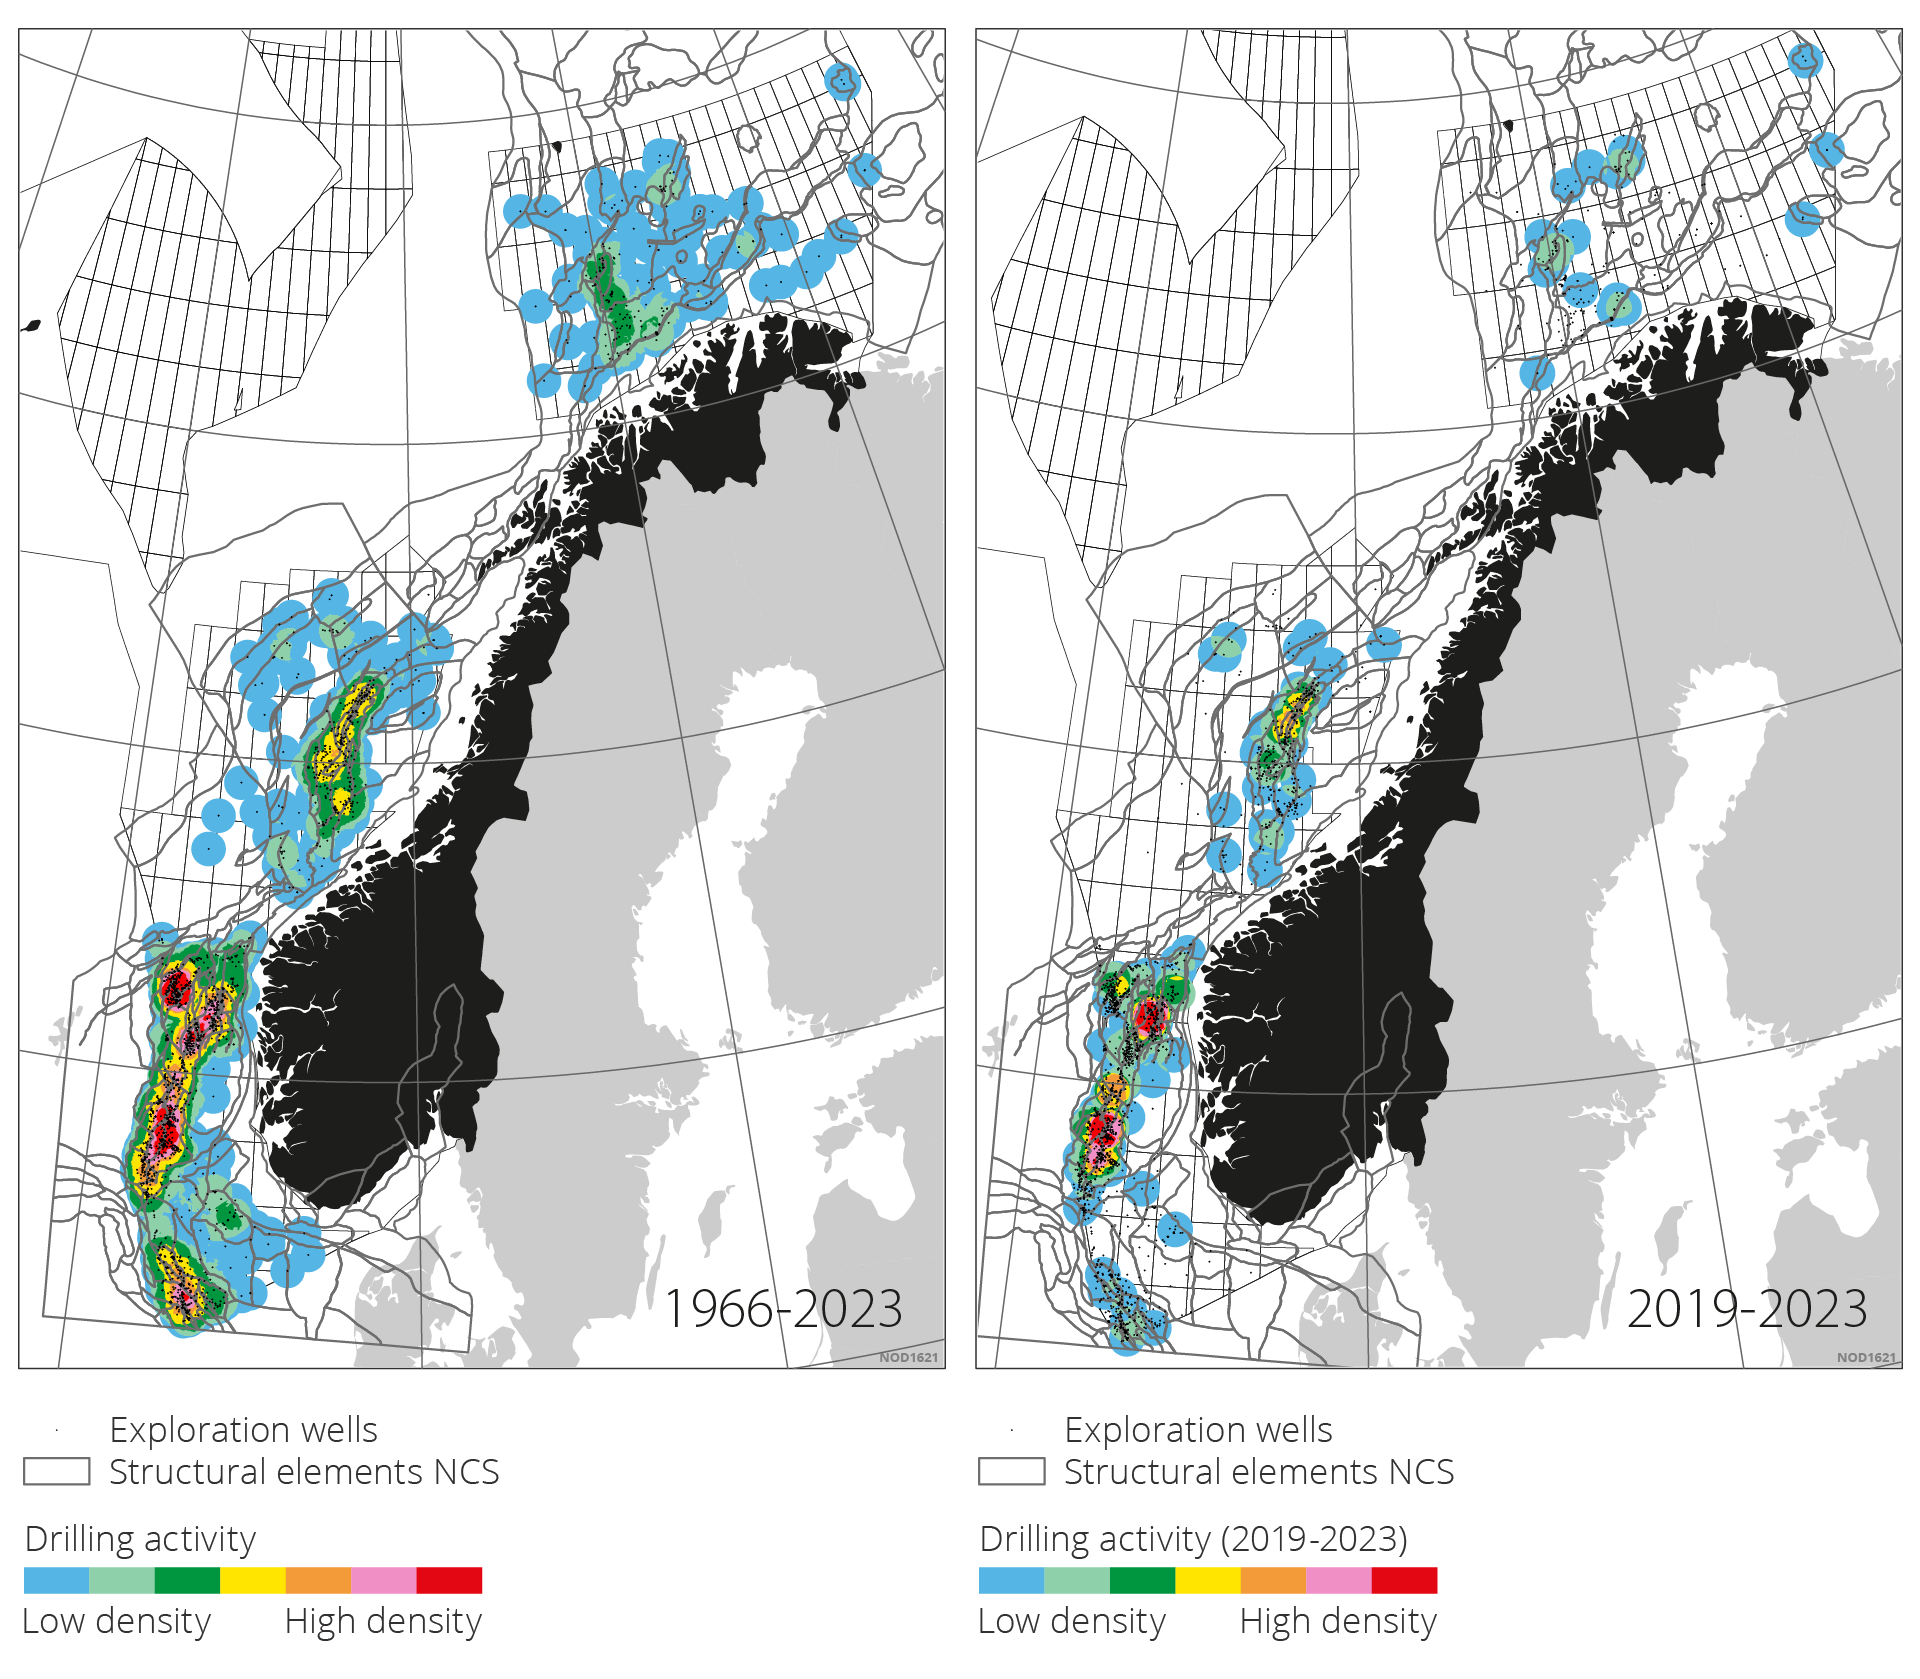
Figure 5.25 The maps illustrate well density. Areas with few wells are shown in blue. Areas with a high number of wells by area (high well density) are illustrated in red. There is a 30-kilometre buffer zone around the wells.
North Sea
Exploration activity in the southern-most part of the North Sea has been relatively low with 11 wildcat wells between 2019 and 2023. Results from these 11 wells turned out to be 3 minor discoveries, 2 of which are classified as resource class 6 (recovery unlikely). Exploration activity was also low in 2014–2018 with 10 wildcat wells, but results were better due to the 2/4-23 S (Julius) discovery in 2015, which is now part of the Fenris field. This field is under development.
The central part of the North Sea has seen high activity between 2019 and 2023 with 34 wildcat wells, compared with 25 in the previous five-year period. 8 of the wells were drilled on the Utsira High. The other wells were drilled in the Viking Graben and terraces leading up to the Utsira High. Discoveries have been made in 19 of the 34 wells, the largest of which were 25/8-20 B in 2021 (now included in the Balder field) and 25/7-11 S (Norma) in 2023.
The northern part of the North Sea has seen the most activity with45 exploration wells drilled in between 2019–2023 This is a reduction from 50 compared to the previous period. 22 of the wells were classified as discoveries. The three largest discoveries were 35/10-10 S (Carmen) in 2023, 30/2-5 S (Atlantis) in 2020 and 31/2-22 S (Blasto) in 2021. Exploration activity has been particularly high in the area west of the Fram field and towards the west flank of Troll (Lomre Terrace) with 15 of the 45 wells drilled in this area.
Norwegian Sea
42 wildcat wells were drilled in the Norwegian Sea between 2019–2023. This is 6 more wells drilled than between 2014–2018. 25 of these wells were drilled on the Halten and Dønna terraces. Discoveries were made in 19 of these wells, resulting in a technical discovery rate of 76 per cent.
In addition were 8 wells drilled on the Frøya High, Trøndelag Platform, Sørhøgda and Grønnøy High. One small discovery was made on the Grønnøy High, 6611/1-1 (Toutatis). All other wells were dry. A further 8 wells were drilled in the basins and synclines west and northwest of the Halten and Dønna terraces. Three minor gas discoveries were made here.
Barents Sea
Exploration activity was nearly cut in half between 2019–2023 compared to the previous five-year period. 18 wildcat wells were drilled in total, with only 1 in 2023. 8 discoveries were made.
The last wells, which the companies had committed to drill in the south-eastern part by the Barents Sea in the 23rd licensing round, were drilled in this period. This resulted in 2 dry wells on the Signalhorn Dome in 2019, 1 dry well on the Haapet Dome in 2020 and 1 minor gas discovery on the Fedynsky High in 2021. This discovery was made in a previously unproven play with reservoirs in carbonates in the Ørn Formation from the Late Carbon to Early Permian.
During the last part of this period 5 exploration wells were drilled around the Johan Castberg, Snøhvit and Goliat fields. Discoveries were made in all wells. The largest discovery was 7122/9-1 (Lupa), which was made in late 2022. Three discoveries were made in the Johan Castberg area that could provide considerable additional resources for the field, the largest of which were 7220/7-4 (Isflak) and 7220/8-2 S (Snøfonn Nord).
Significance of exploring for future production
Total resource growth and the number of discoveries from exploration activity since 2000 is shown in figure 5.26.
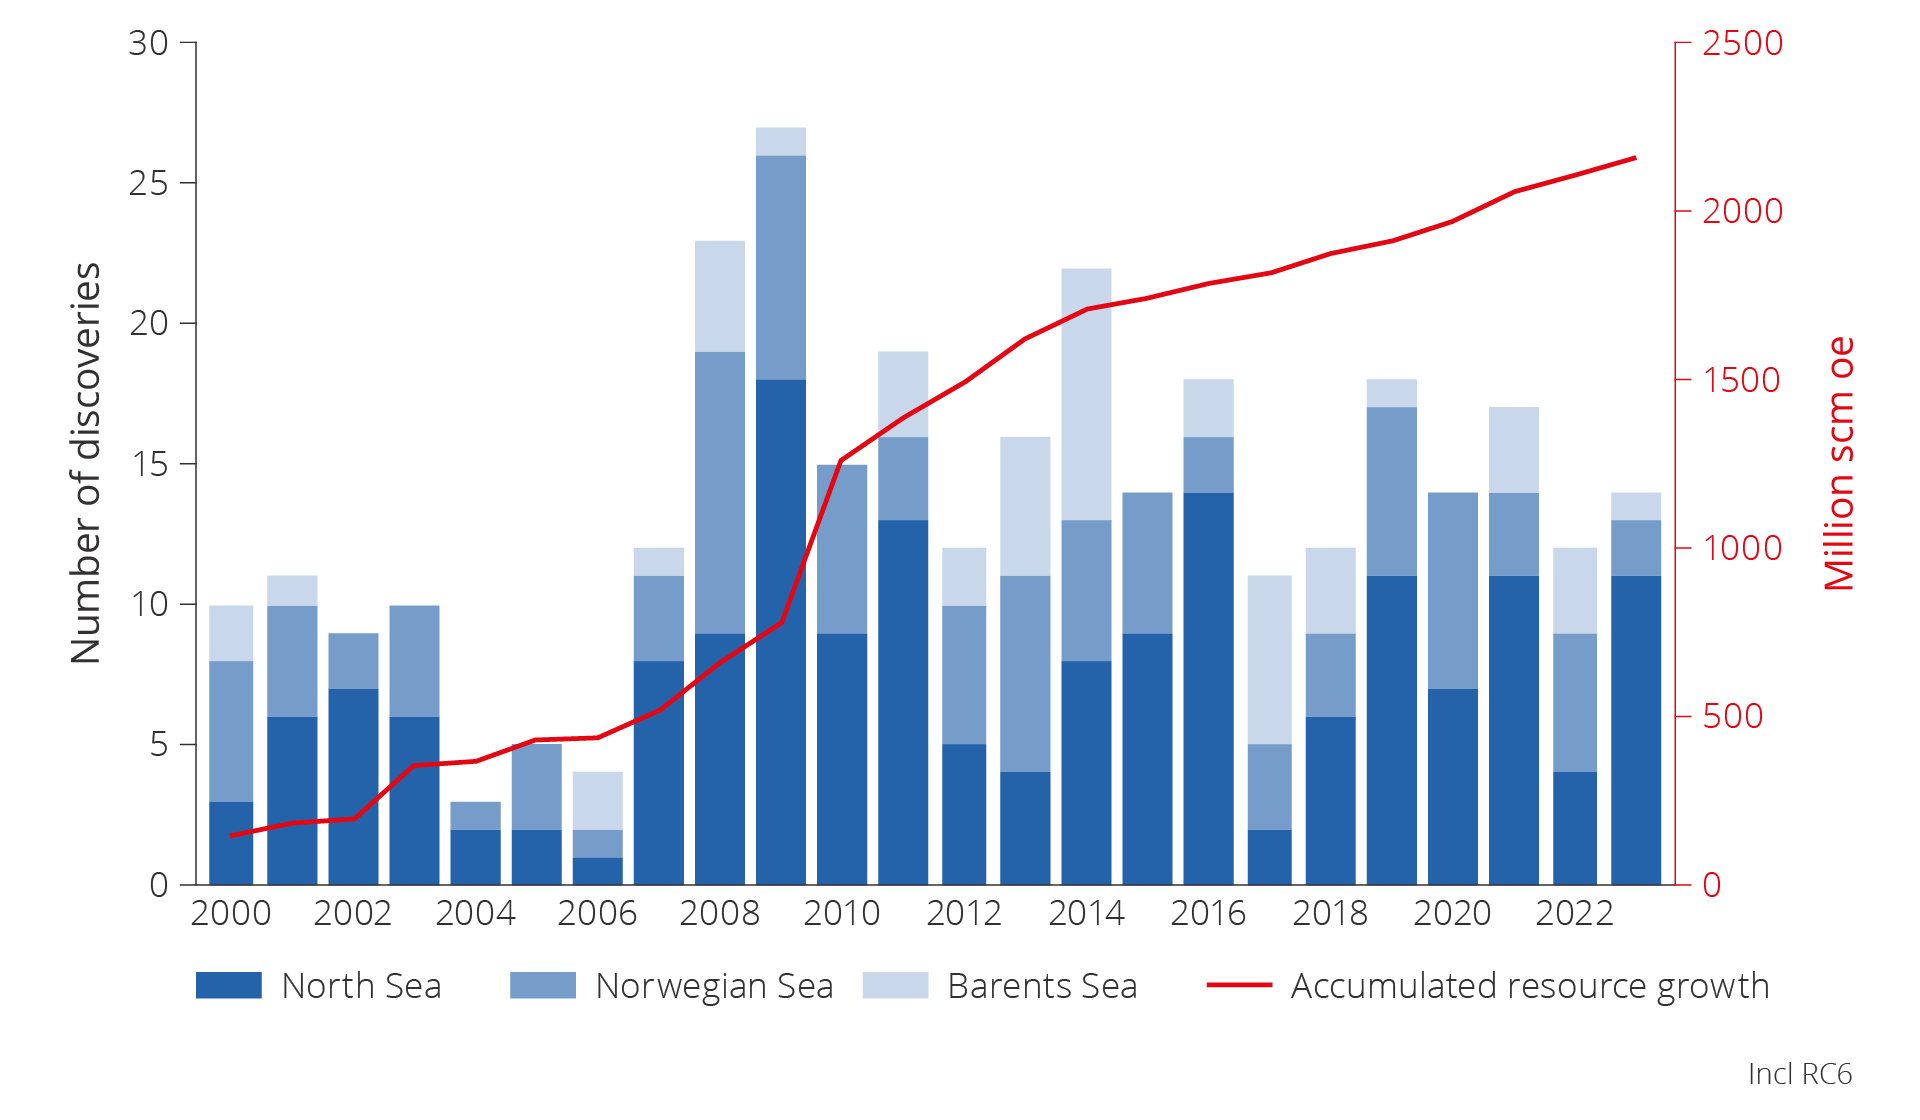
Figure 5.26 Number of discoveries per NCS area and total resource growth, 2000–2023.
Even though exploration activity remains relatively stable and discoveries are being made, resource growth falls short of counteracting the effect of declining production from existing fields after 2027. Figure 5.27 illustrates the effect that exploration activity over the last 20 years has on total production (in dark purple). The new discoveries have helped slowing the decline in production from 2017 and are expected to keep production relatively stable, before it declines rapidly after 2027–2028.

Figure 5.27 Effect of exploration activity over the last 20 years on historical and future total production.
The discoveries made are consistently small. Multiple wildcat wells need to be drilled annually to slow the decline in production compared to the average drilled since 2016. More and larger discoveries will have to be made. The opportunity to make major discoveries is greatest in less explored parts of already opened areas, as well as areas that have not yet been opened for petroleum activities.
Smaller discoveries
International experience shows that major discoveries are made early in the exploration phase in a new petroleum province, and that the discovery size declines proportional as petroleum provinces mature. This also applies on the NCS as shown in figure 5.28.
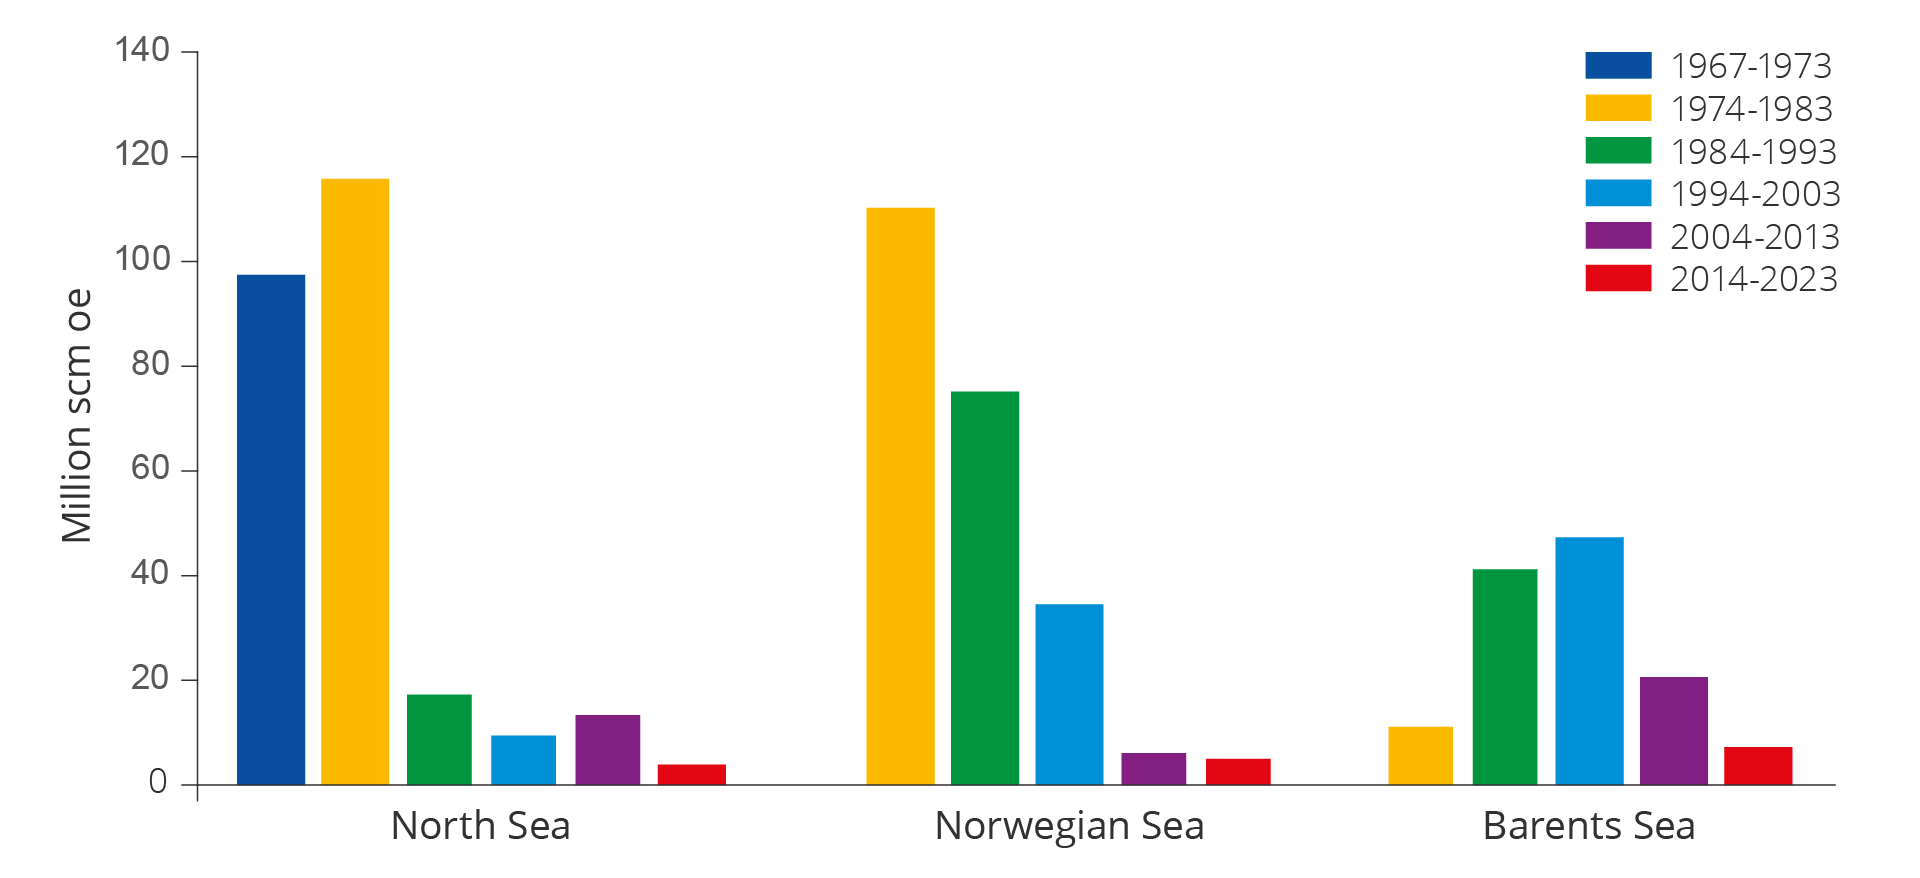
Figure 5.28 Average discovery size distributed across areas and periods (without resource class 6).
The largest discoveries, with the exception of Ormen Lange in 1997 and Johan Sverdrup in 2010, were made in the 1970s and 1980s. The average size of discoveries over the last ten years has totalled about 5.2 million scm oe on the NCS, with 3.5 in the North Sea, 4.8 in the Norwegian Sea and 7.2 in the Barents Sea.
The decline in average discovery size reflects a natural evolution for a mature petroleum province where no new areas are opened. With a decline in discovery size, production from the major fields needs to be replaced by multiple small discoveries. This development, with the number of producing fields and production per field, is shown in figure 5.29.
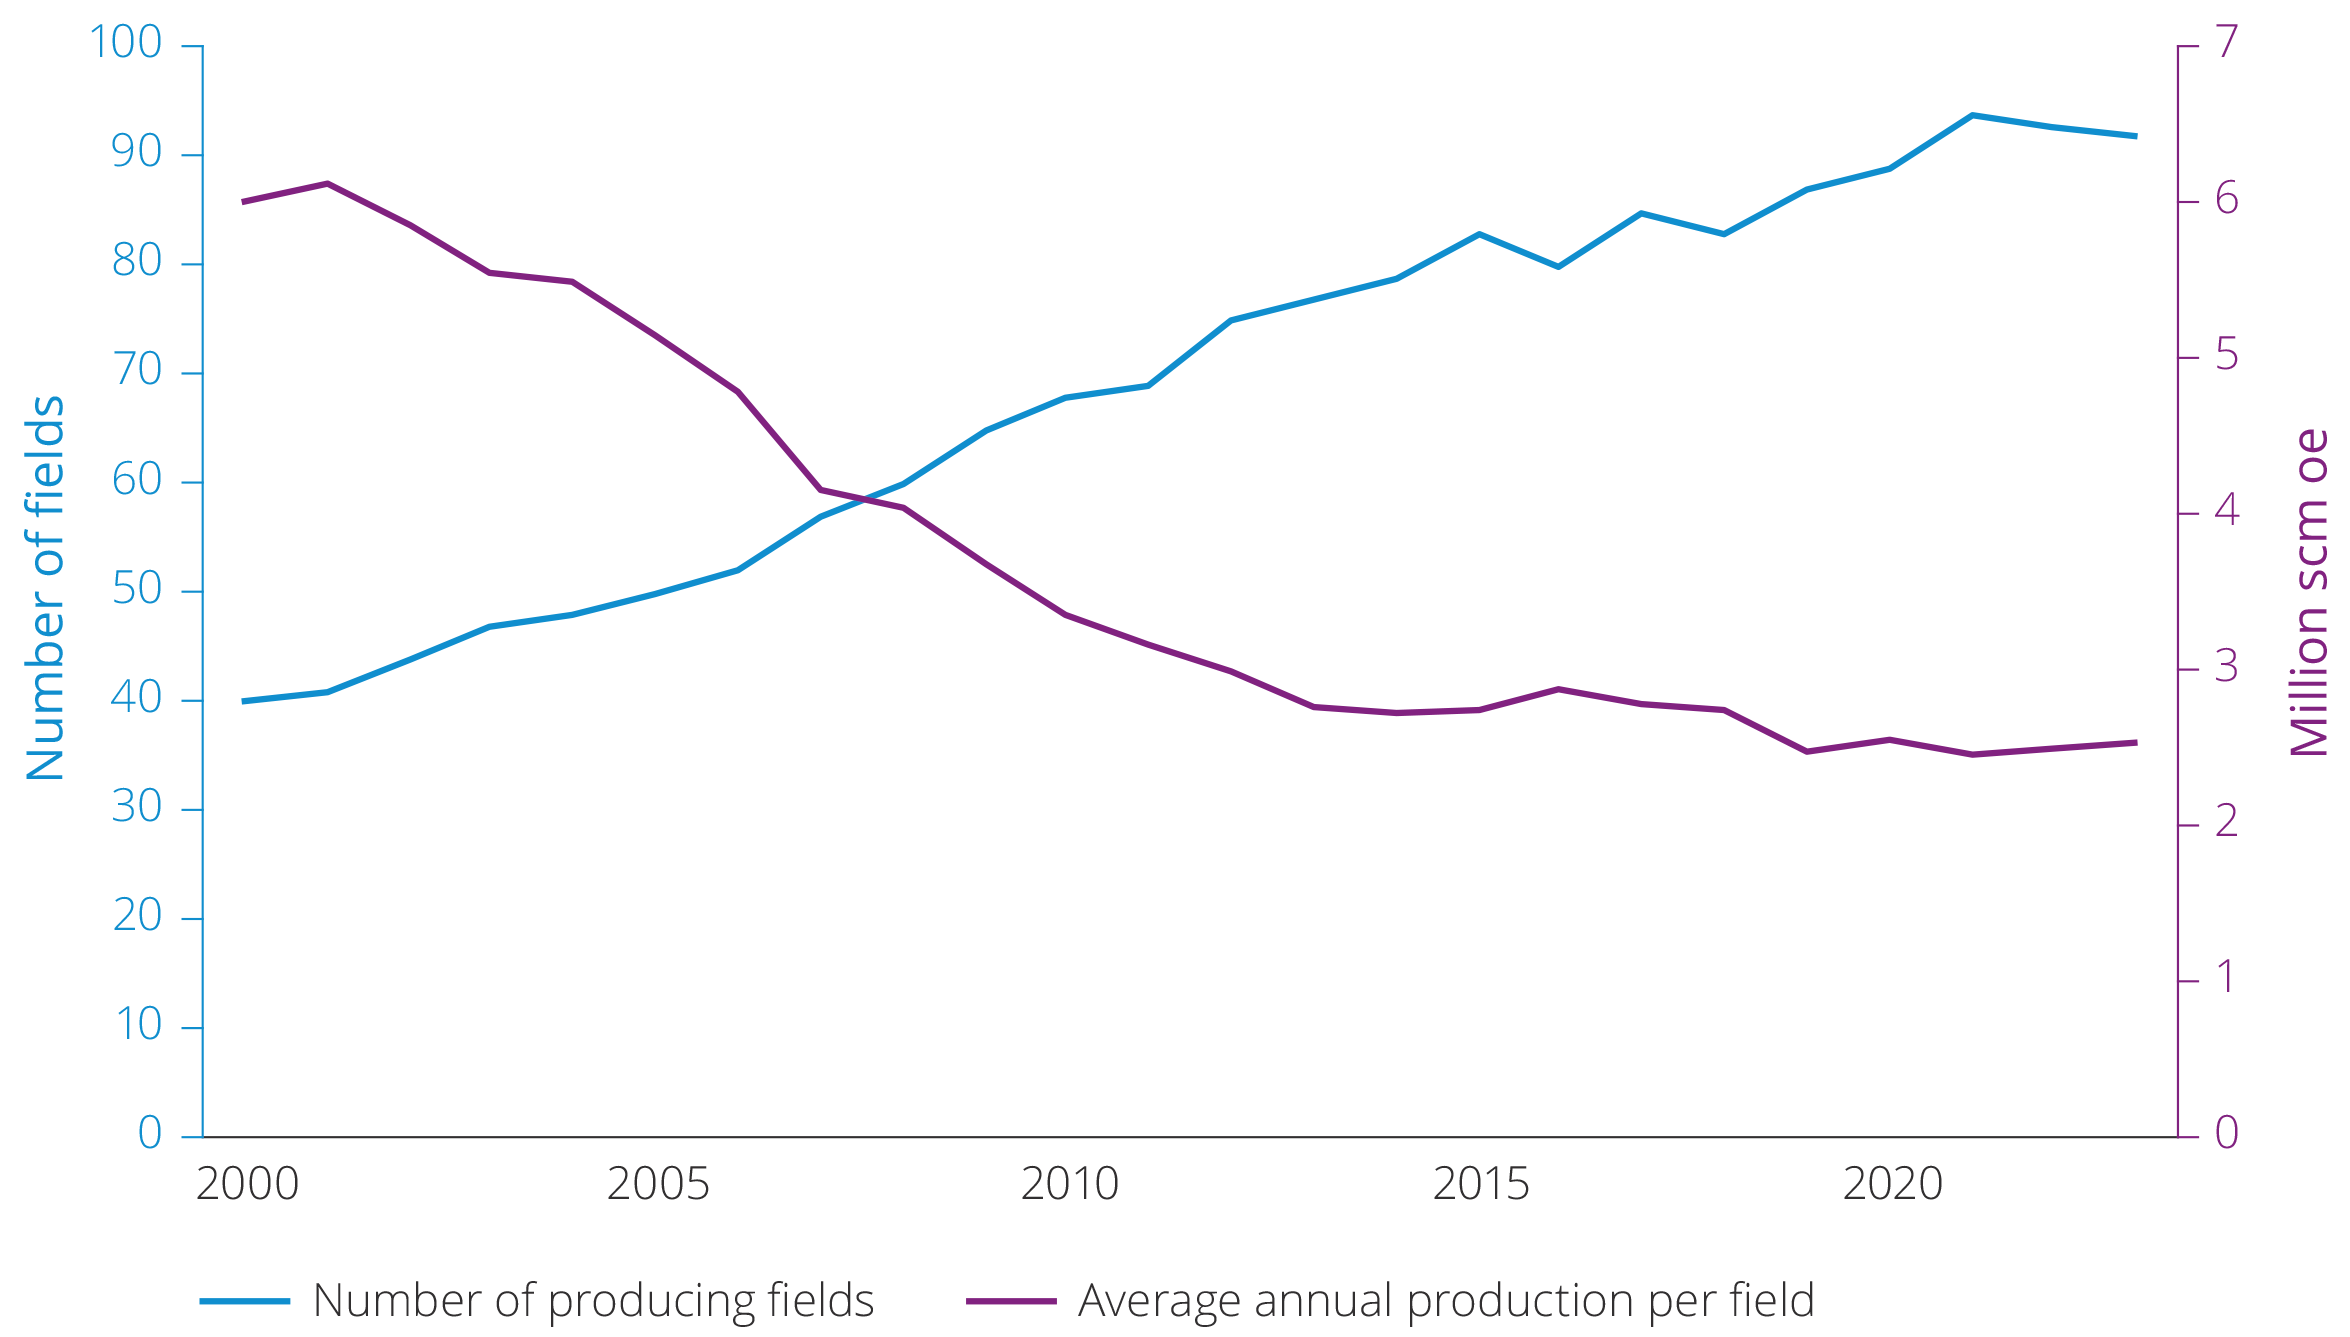
Figure 5.29 Development in number of producing fields and production per field, 2000–2023.
Annual resource growth from exploration has been lower than annual production, with the exception of Johan Sverdrup in 2010, as highlighted in figure 5.30.
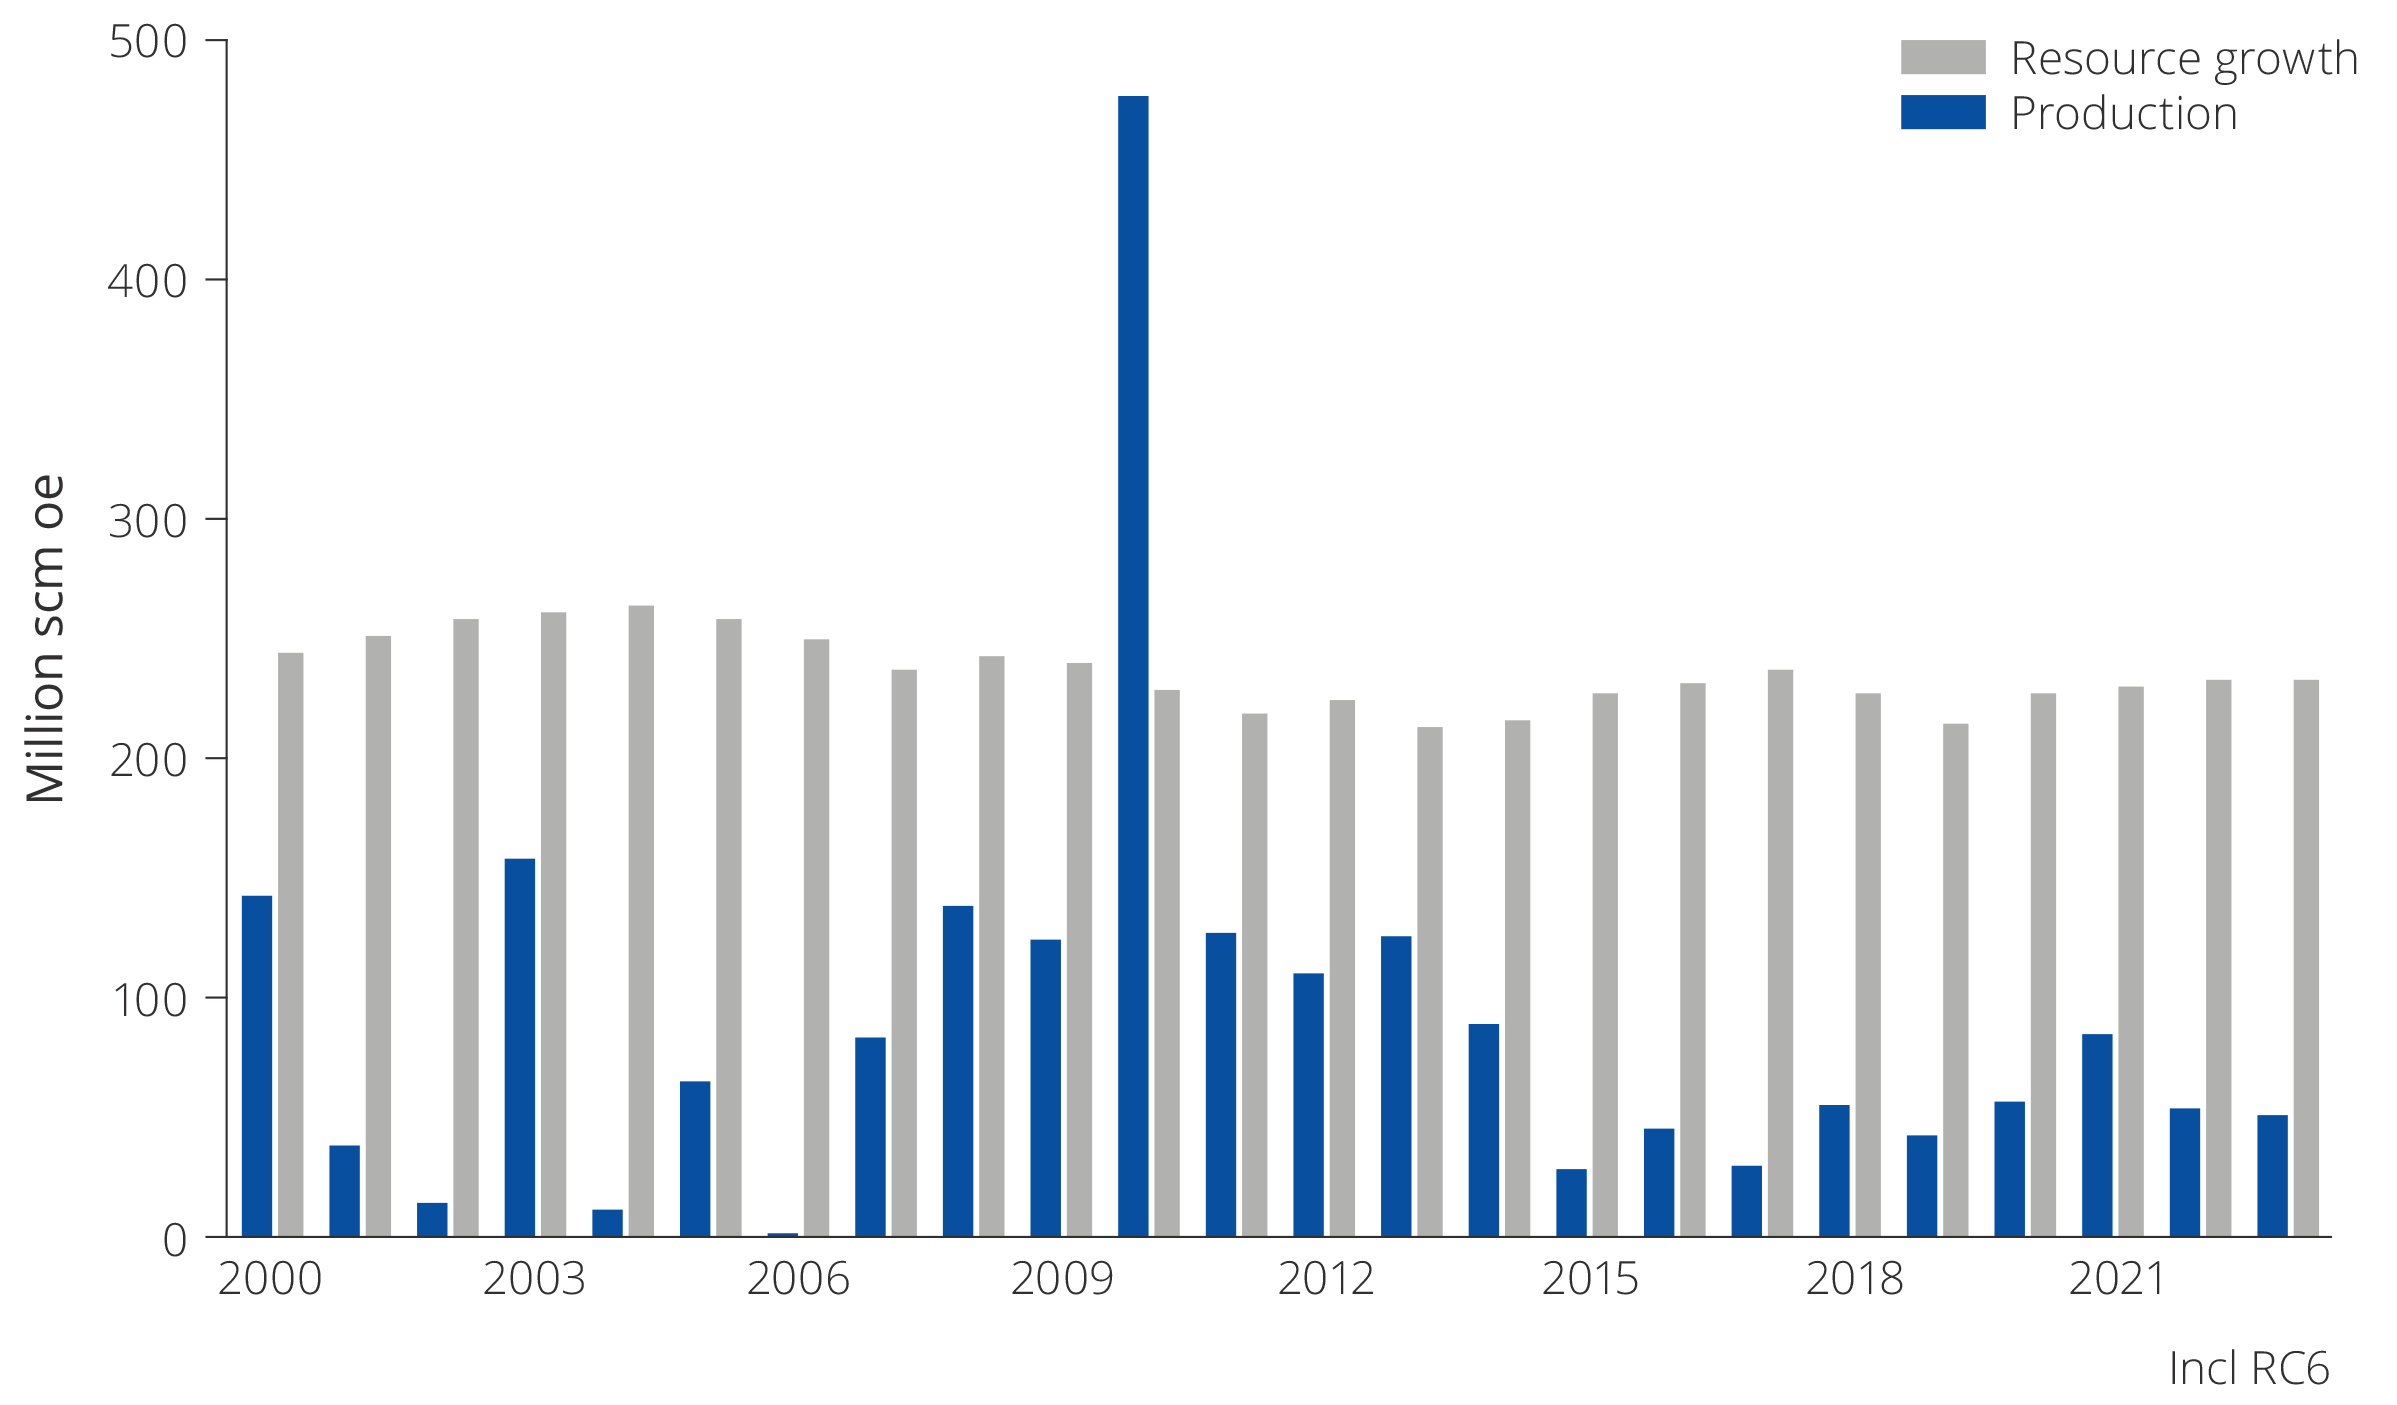
Figure 5.30 Annual production and resource growth from exploration, 2000–2023 (including resource class 6).
Maintaining the success rate despite smaller discoveries
As a petroleum province matures and the "easy" and major discoveries have been made, fewer significant accumulations be left to find. The average discovery size will decline if nonew prospective areas are opened. This development is clear on the NCS and is illustrated by the blue columns in figure 5.30.
At the same time, knowledge and understanding of the geology in an area will increase due to access to additional and better data. This can be data from exploration wells, collected seismic and improve geological models.
Continuous technological advancements contribute to enhanced mapping, which in turn helps maintain the success rate. The success rate remains high on the NCS, despite it becoming more challenging to find new accumulations and the discoveries are becoming smaller. Developments in the technical success rate are shown in the same figure as the discovery's average size in the figure under.
This reflects the fact that advances in technology, better mapping, more and improved use of data as well as increased understanding of the geology has helped slow the effect of gradually depleting the resources in opened areas(35).
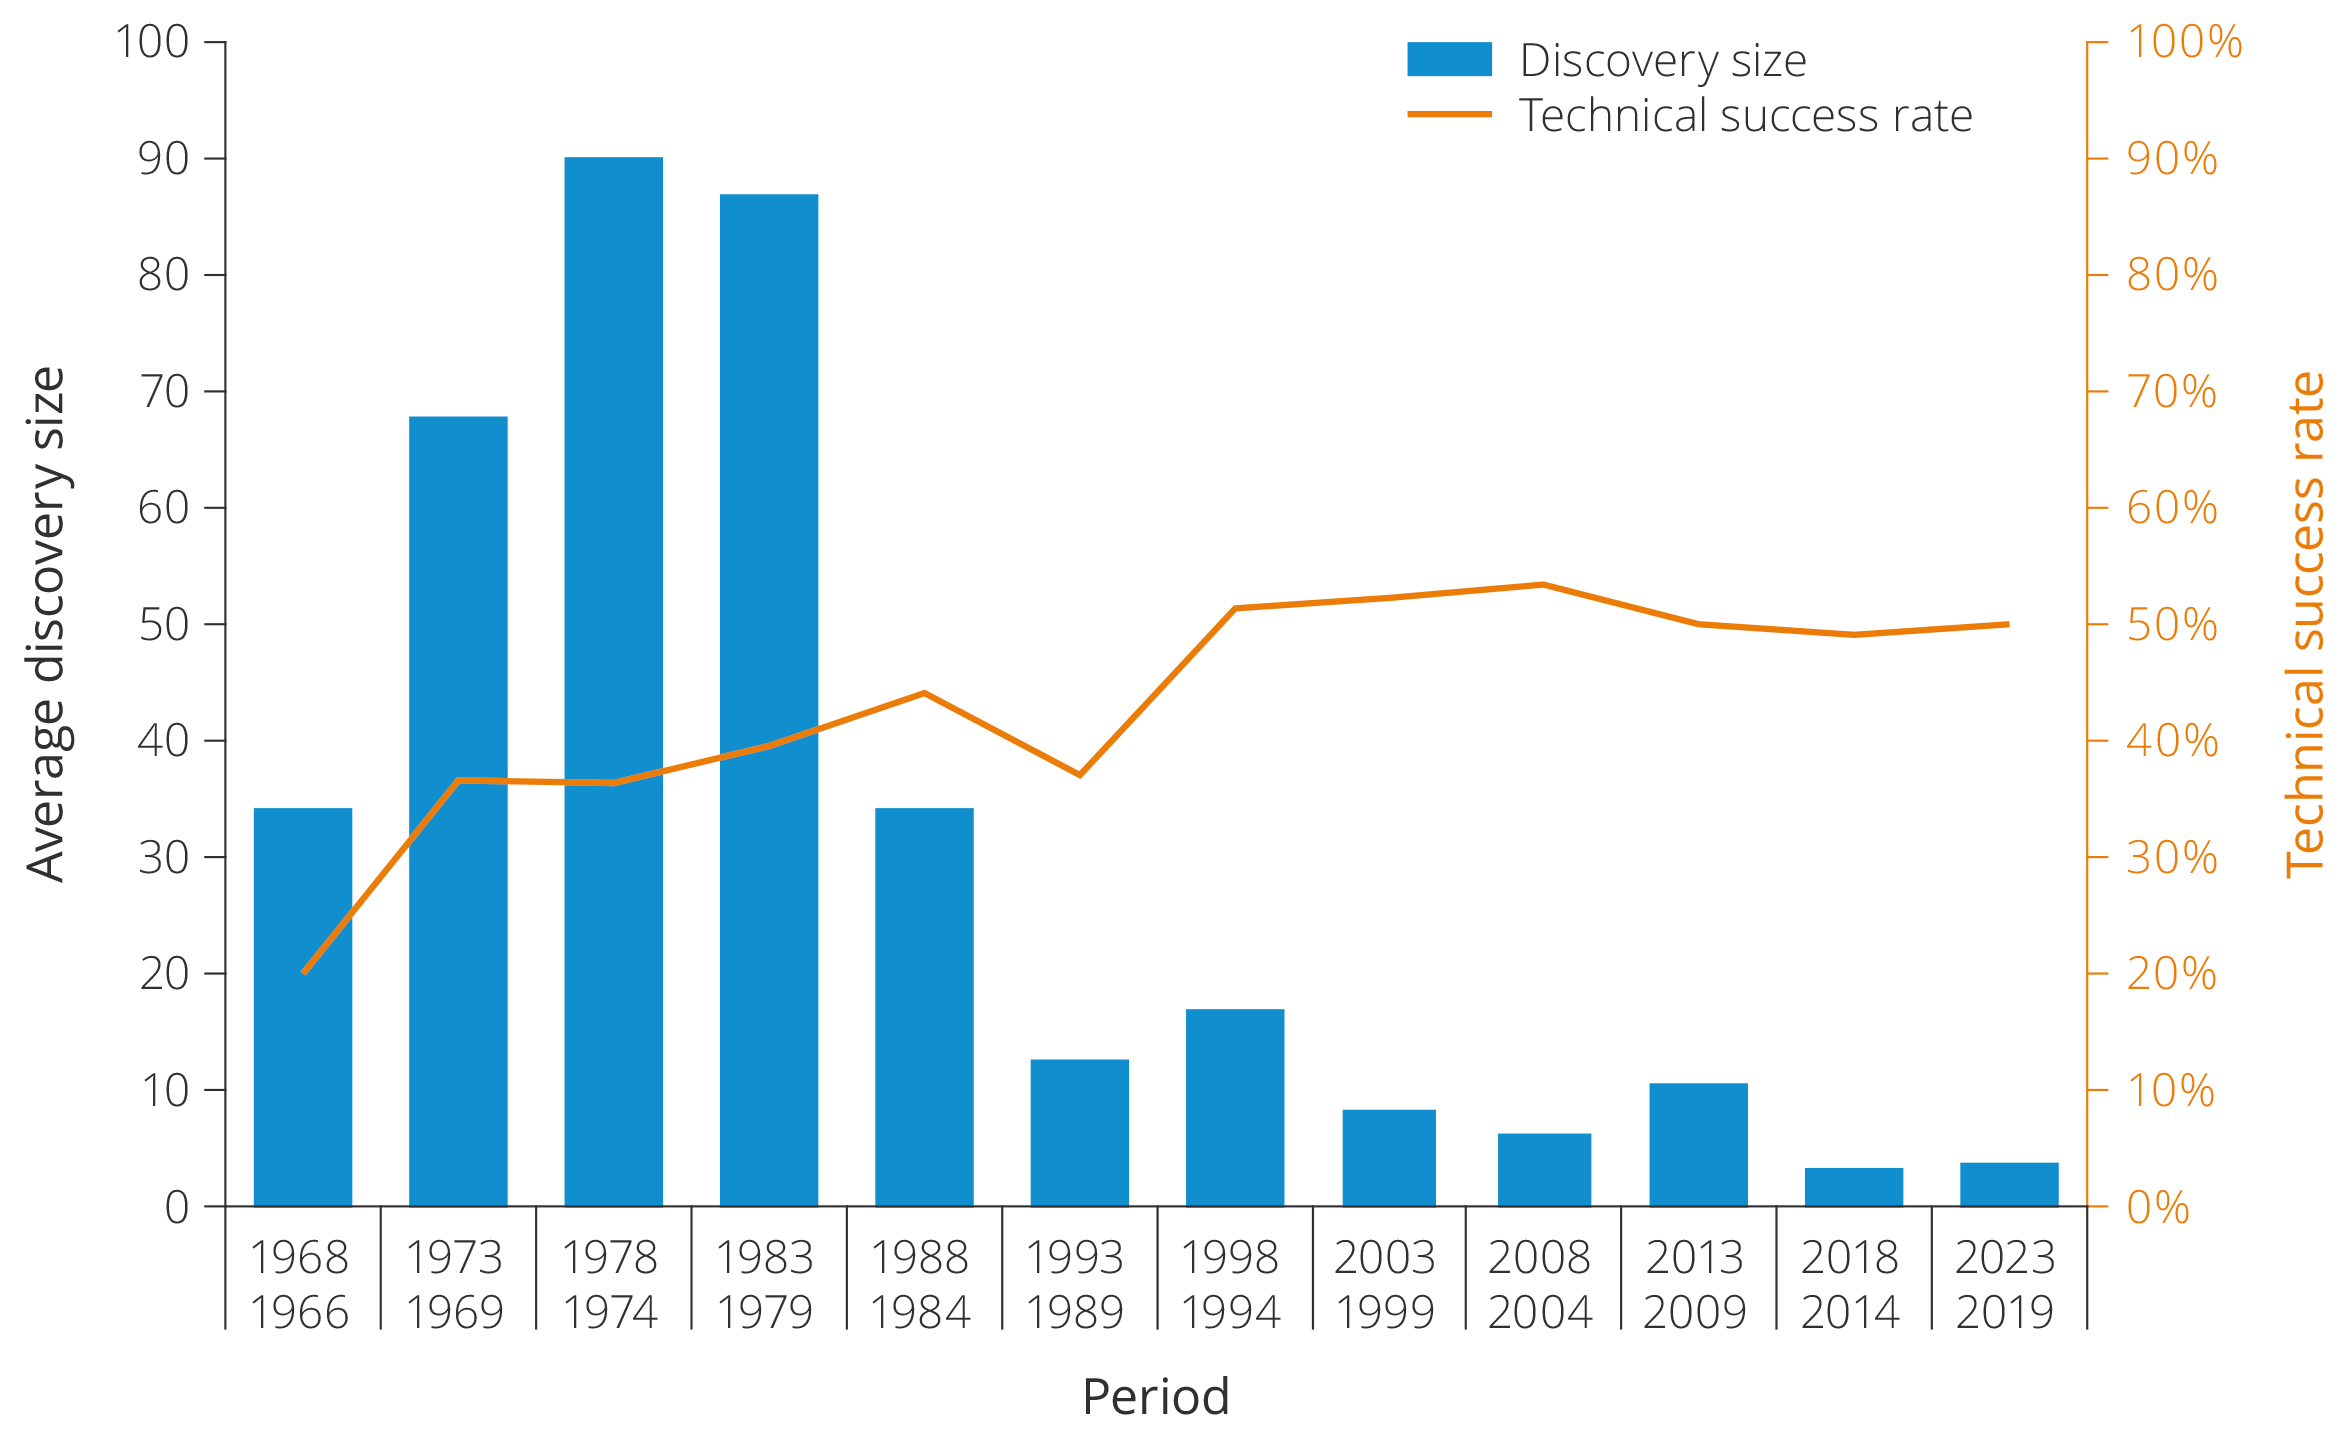
Development in discovery size and success rate, 1966–2023.
Exploration close to infrastructure
Most wildcat wells in the 2000s were drilled close to existing infrastructure, see figure 5.31.
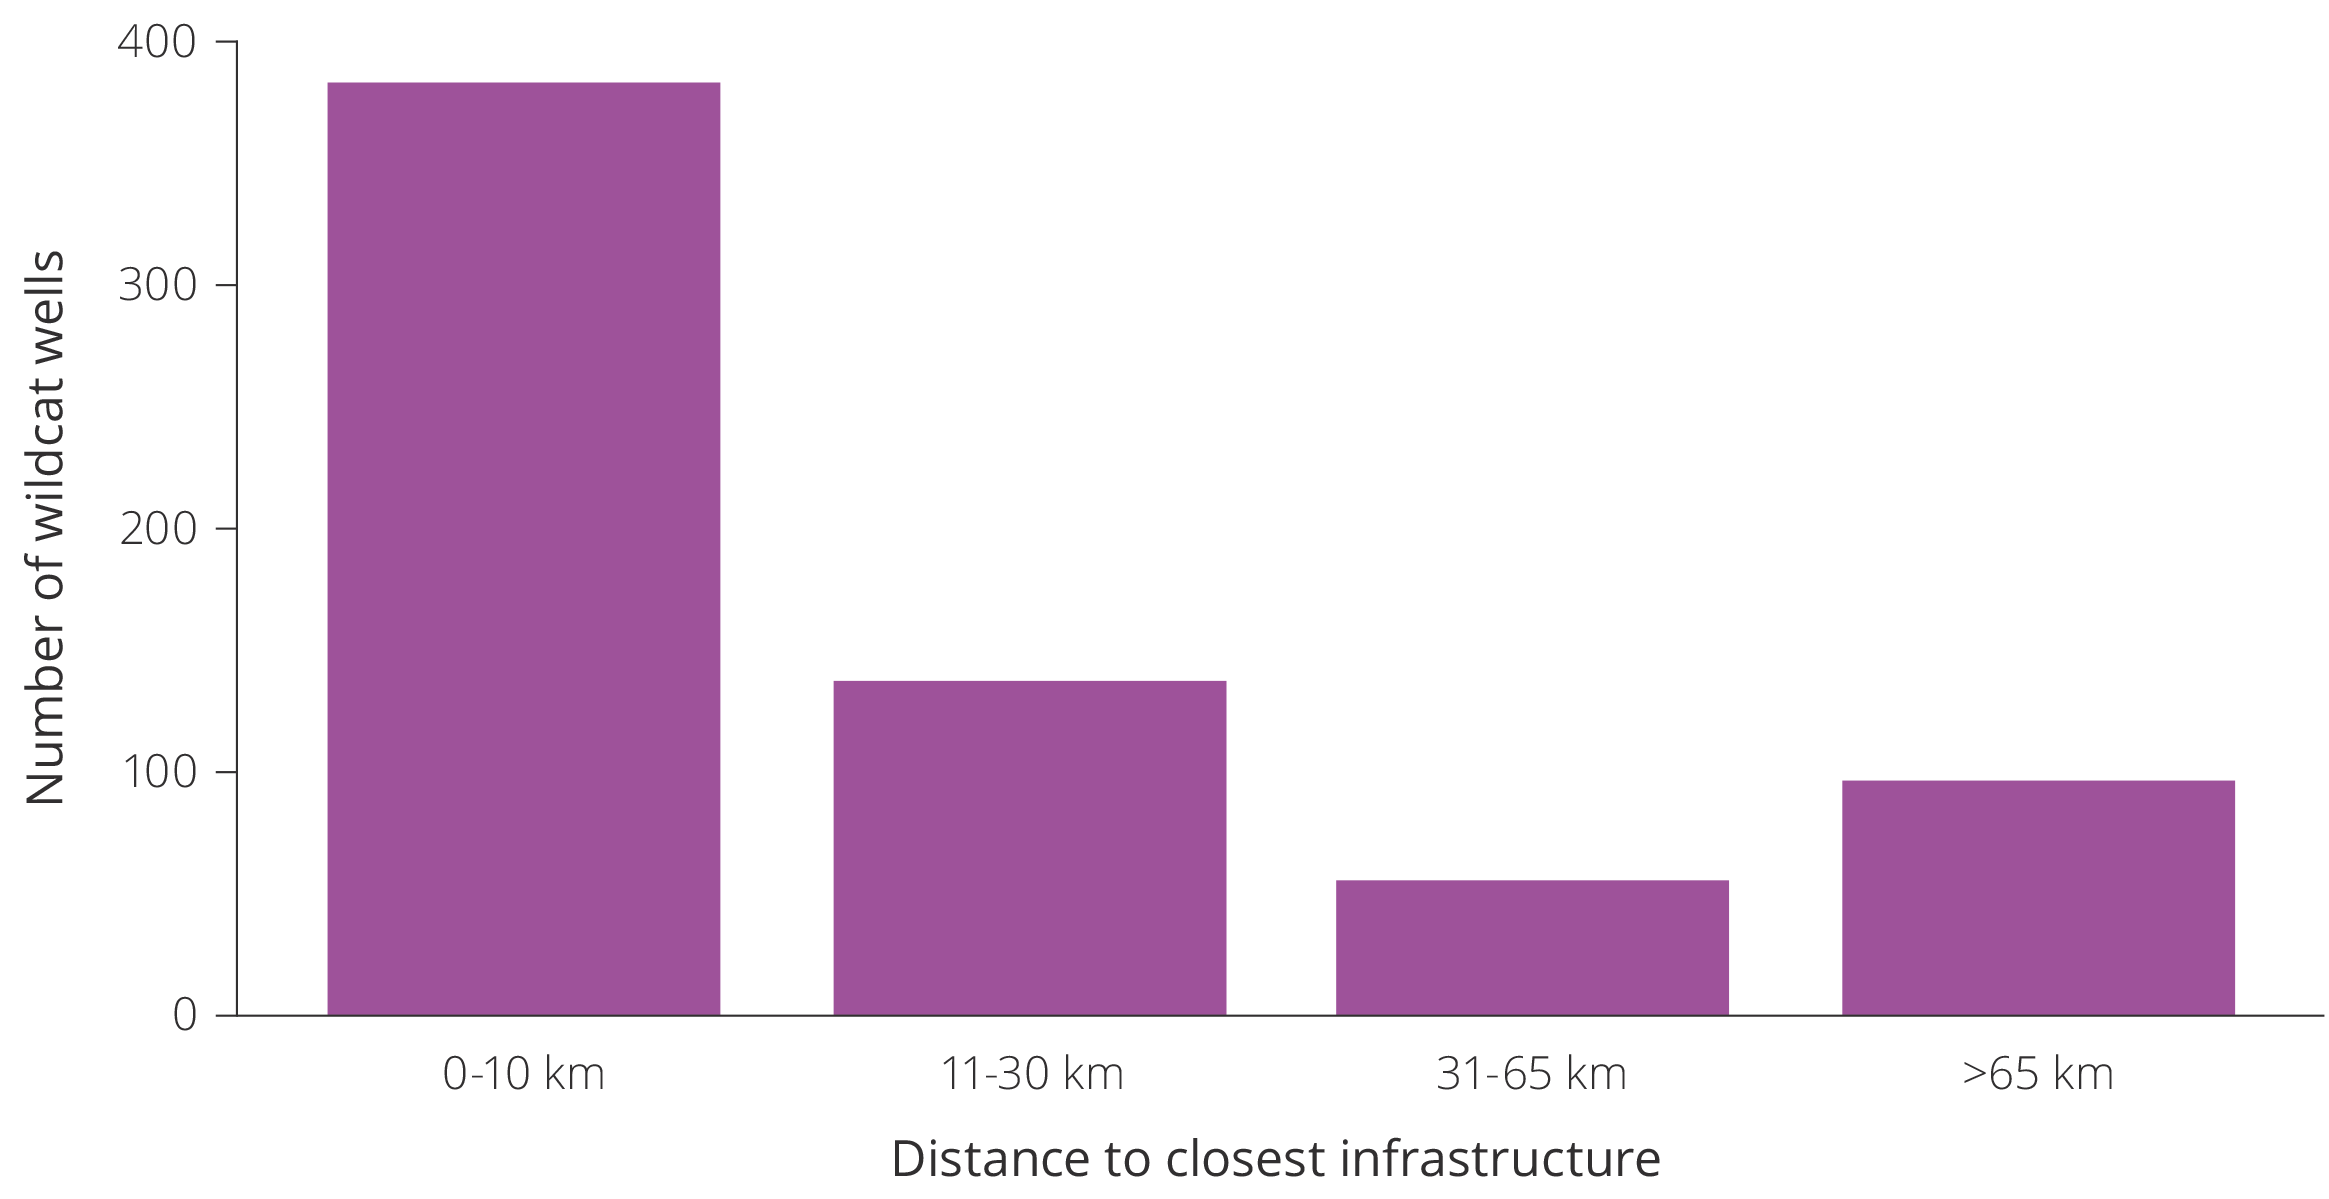
Figure 5.31 Wildcat wells and distance to infrastructure, 2000–2023.
The number of wildcat wells far away from infrastructure appears to follow changes in the oil price. Nevertheless, this trend seems to break after 2020 and fewer wells are being drilled. In 2023 no wells with a distance greater than 65 kilometres from infrastructure were drilled, see also figure 5.27.
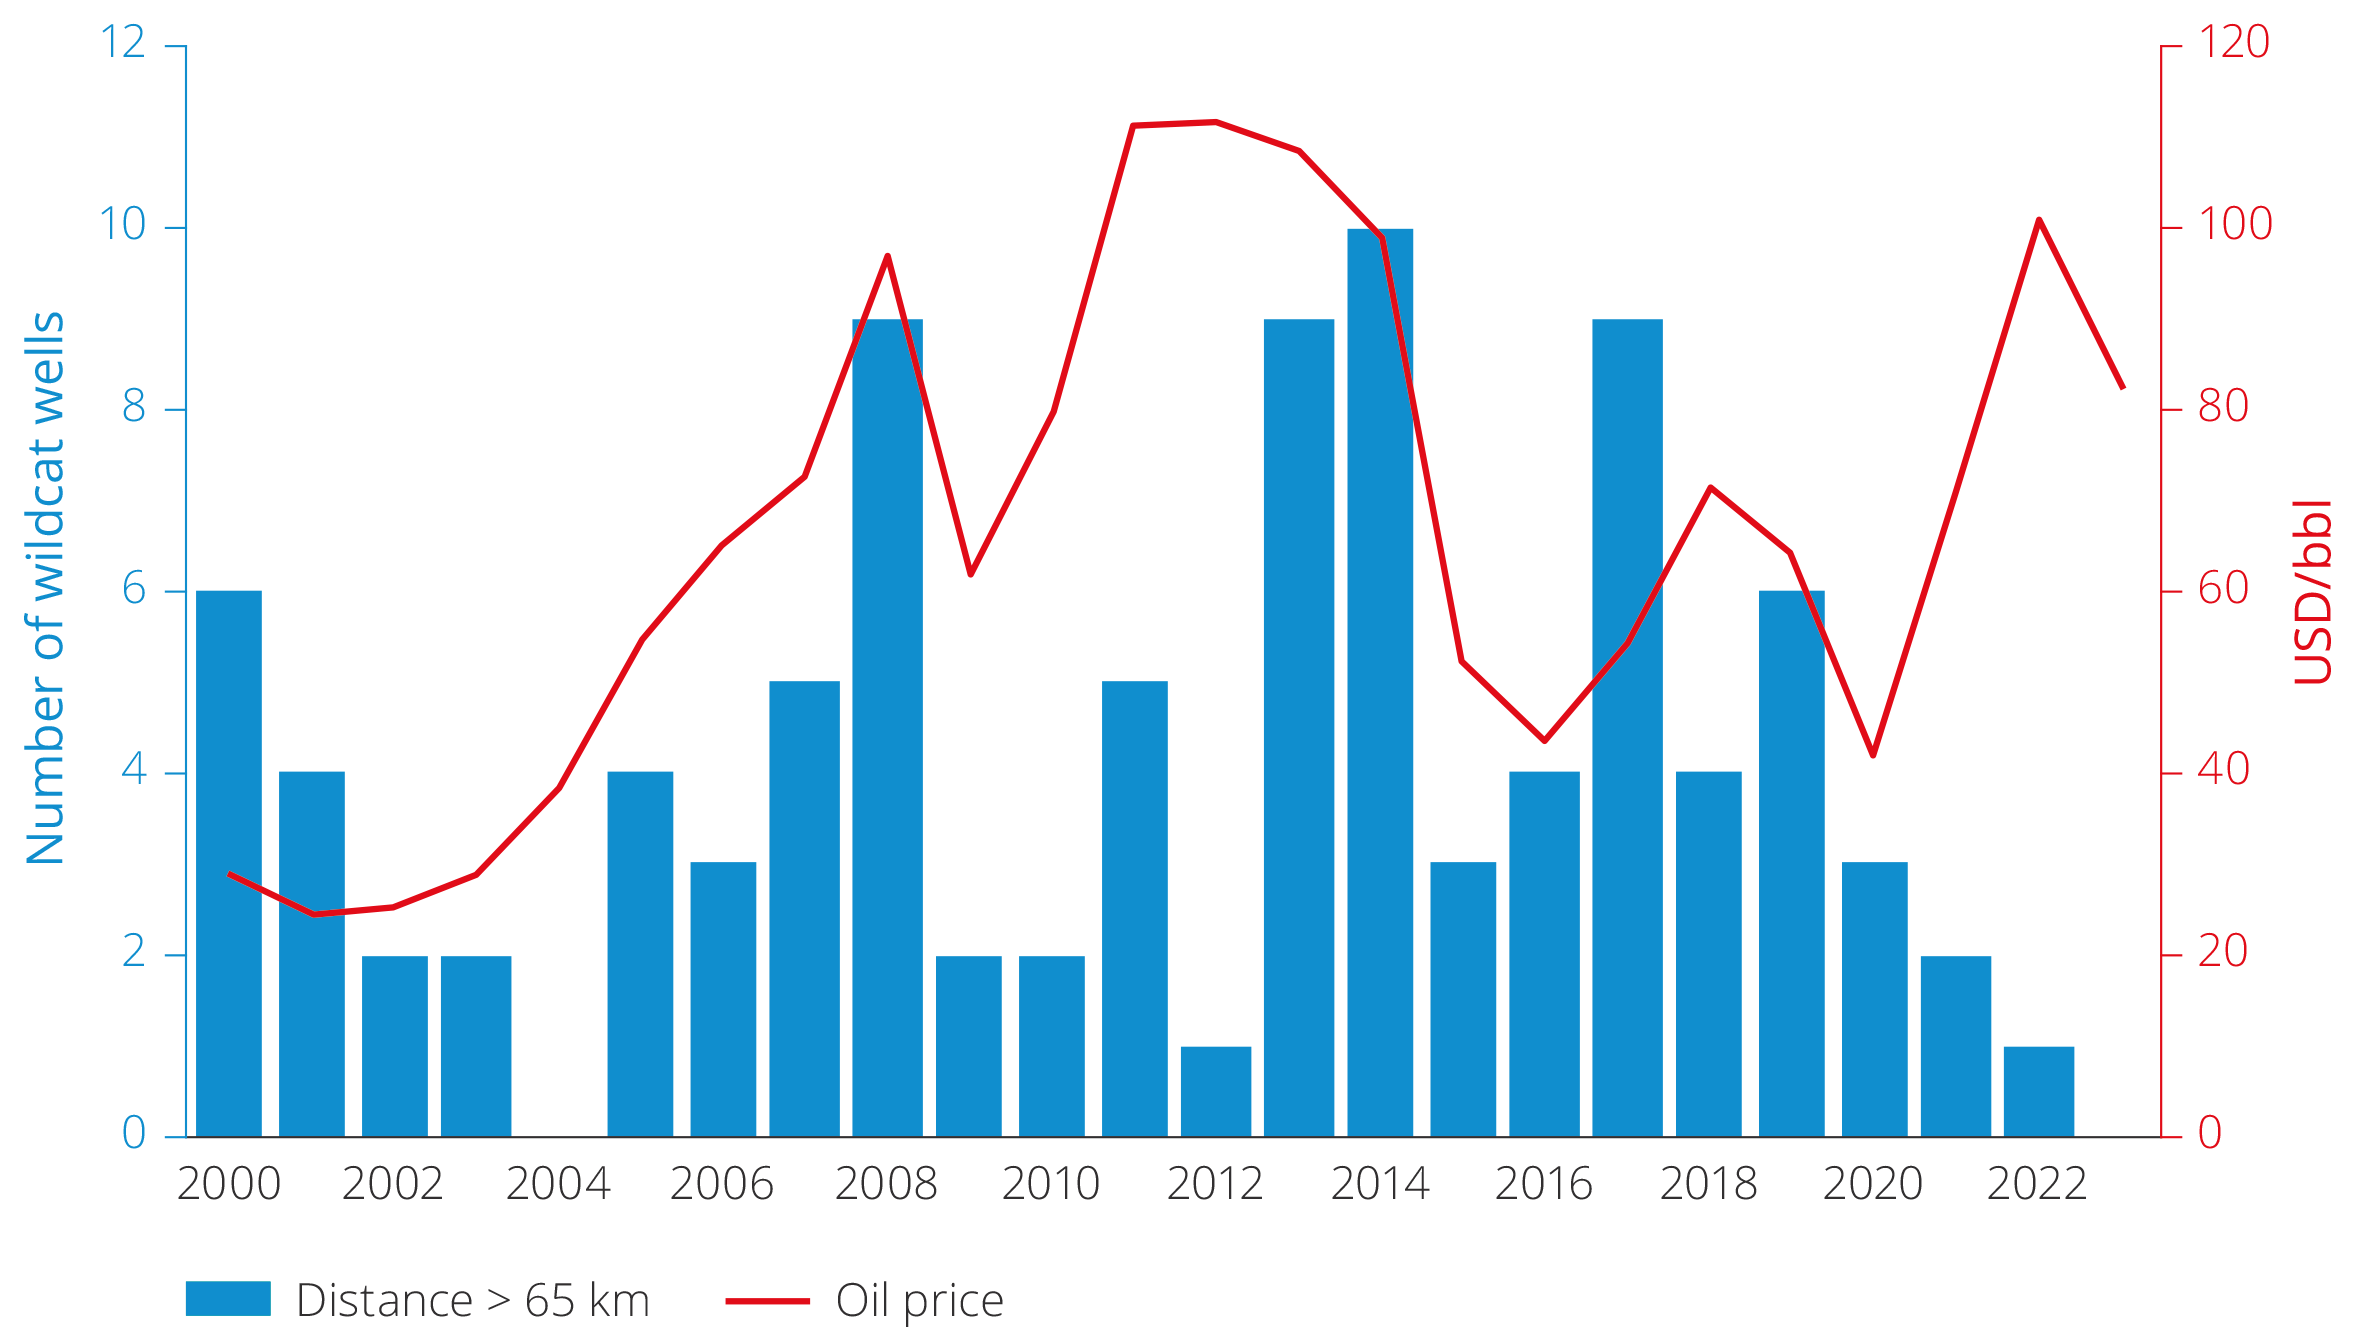
Figure 5.32 Oil price and percentage of exploration wells more than 65 kilometres from the closest infrastructure, 2000–2023.
Exploration in known exploration concepts
Exploration activity has also been increasingly focusing on exploration targets in well-established plays. Market failure can be one of several reasons for this development, see fact box on market failure in exploration. A comparison of all exploration targets drilled between 2019–2023 shows that most are located in classic plays in the Triassic and Jurassic.
The companies drill fewer wells in plays that are underexplored or not confirmed. Examples are shown in figure 5.33. This reflects both the NCS' maturity and the industry's current primary strategy to explore close to existing infrastructure.
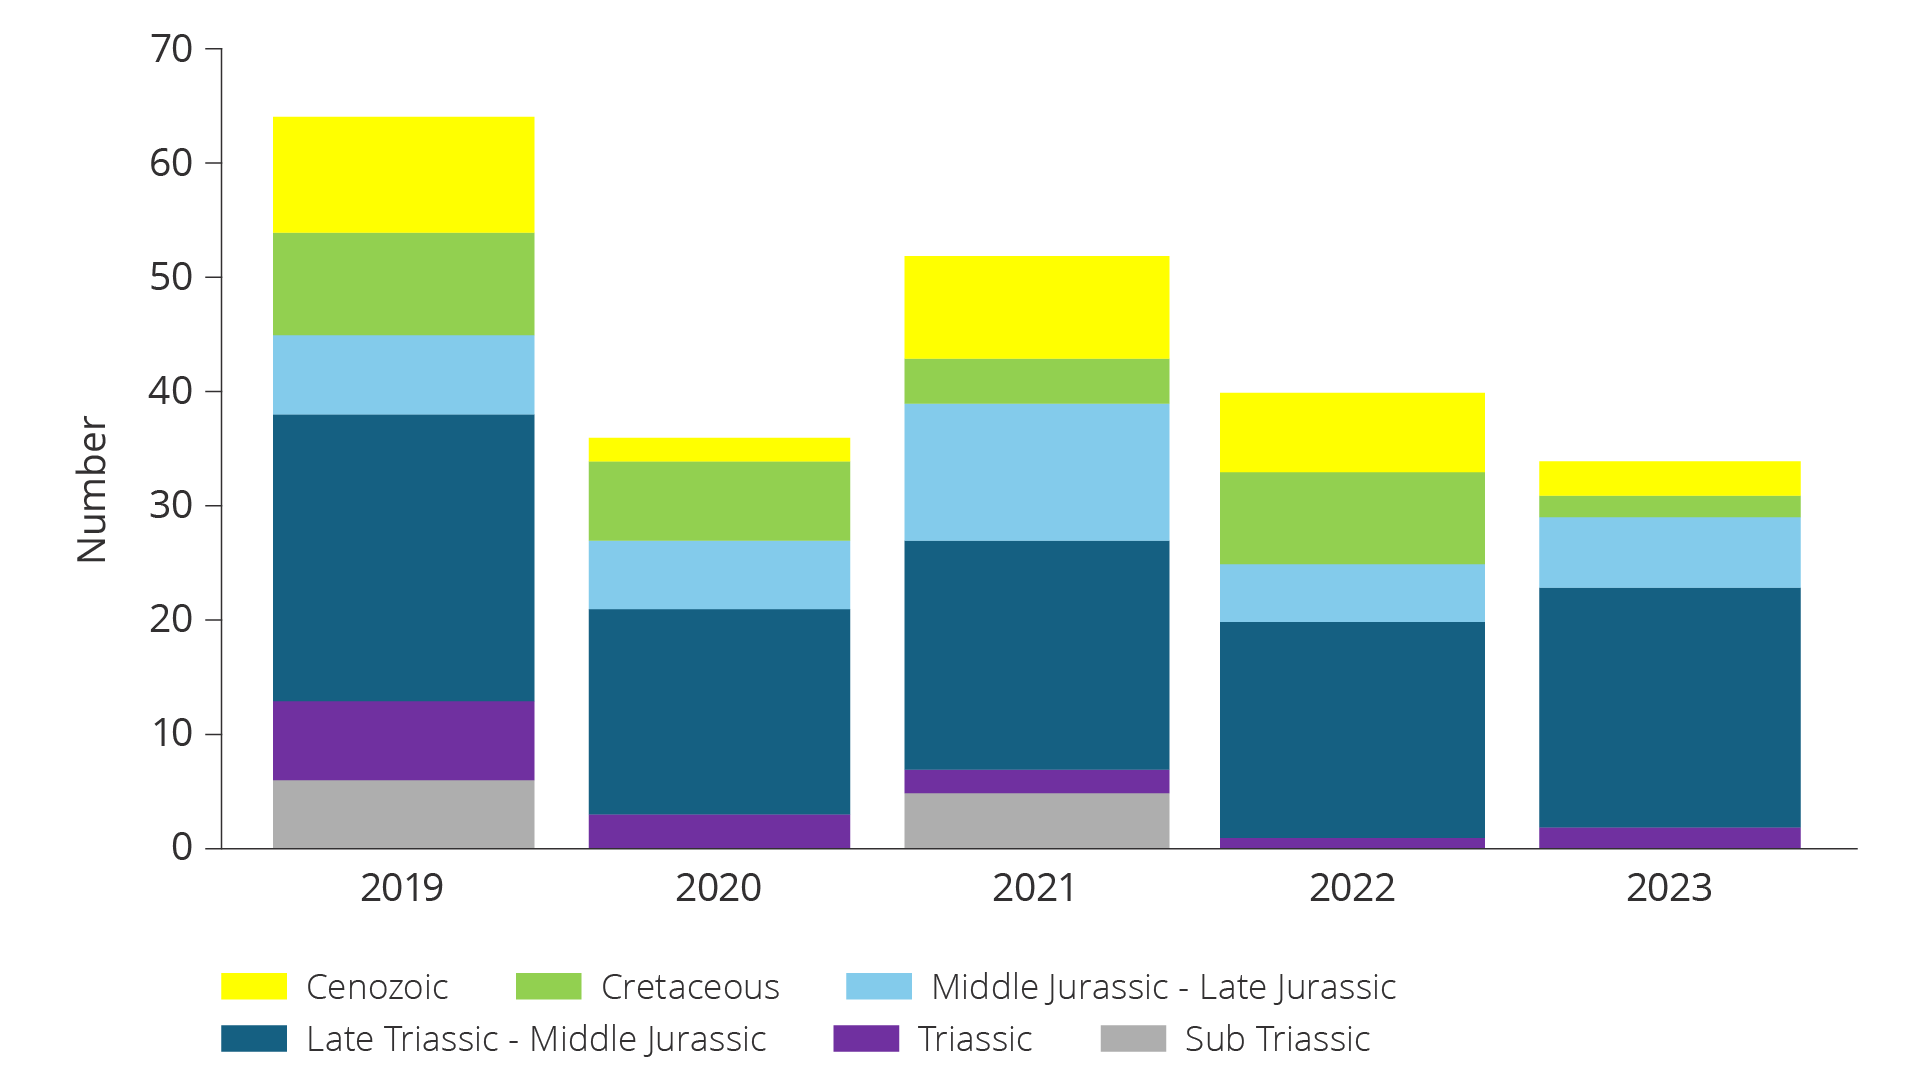
Figure 5.33 Exploration targets drilled in 2019–2023 distributed across geological age.
Larger discoveries will be needed to offset the expected decline in production on the NCS. In other words, exploration in less mature areas and exploration of new concepts is required. The industry has stepped up to address these challenges in the Barents Sea. There has been increased interest in production licences in the area, and the companies are planning a significant increase in drilling activity in 2024 and 2025.
Market failure in exploration
There are multiple forms of market failure in exploration that can result in insufficient exploration. Exploration can be compared with research in the sense that several of the same factors that result in insufficient research also result in insufficient exploration(36). This is linked to the fact that exploration provides information that, in many instances, can be a public good, and where the value of this collective good is higher for society than for the individual company.
Exploration can also have positive external effects in the sense that exploration leads to new knowledge that benefits others without the company receiving compensation for this. This can provide a basis for strategic behaviour that can result in insufficient exploration.
A lack of overlap between the companies' and society's risk assessment can lead to the companies being more impatient than the authorities, and therefore adapt their exploration strategy for more short-term gains. This can result in companies taking less exploration risk.
Several unclarified opportunities in the Barents Sea
8 production licences were awarded in mature areas of the Barents Sea in APA 2023. Most of them are located in the western parts of the Barents Sea, where the youngest plays in the Paleocene and Eocene are most relevant.
Large areas of the Barents Sea South are still underexplored. Exploration has mainly been concentrated on known plays in the Hammerfest Basin and around 7324/8-1 (Wisting) and Johan Castberg.
In central parts of the Barents Sea South, on the Mercurius High and Bjarmeland Platform, are carbonate deposits in the Gipsdalen Group. This play was confirmed with 7234/6-1 (the Stangsnestind discovery), and contains several large structures in the Barents Sea South.
On the Finnmark Platform are structures mapped in the Billefjord Group which is Devonian to Early Carboniferous in age. This play was confirmed with a small gas discovery, 7130/4-1 (Ørnen) in 2016, with reservoir in the Soldogg Formation.
There are also structures mapped in the overlying Røye Formation of Permian age. The Røye Formation can consist of both, silicified carbonates, sandstones and spiculites; see figure 5.34. This play was confirmed with the 7128/4-1 (Omd Vest) discovery as early as 1994, and this discovery was made in a spiculite reservoirs.
There are large quantities of 2D and 3D seismic available for the Barents Sea, and more seismic is being released continuously(37). Better imaging will contribute to increased understanding of the different prospective levels.
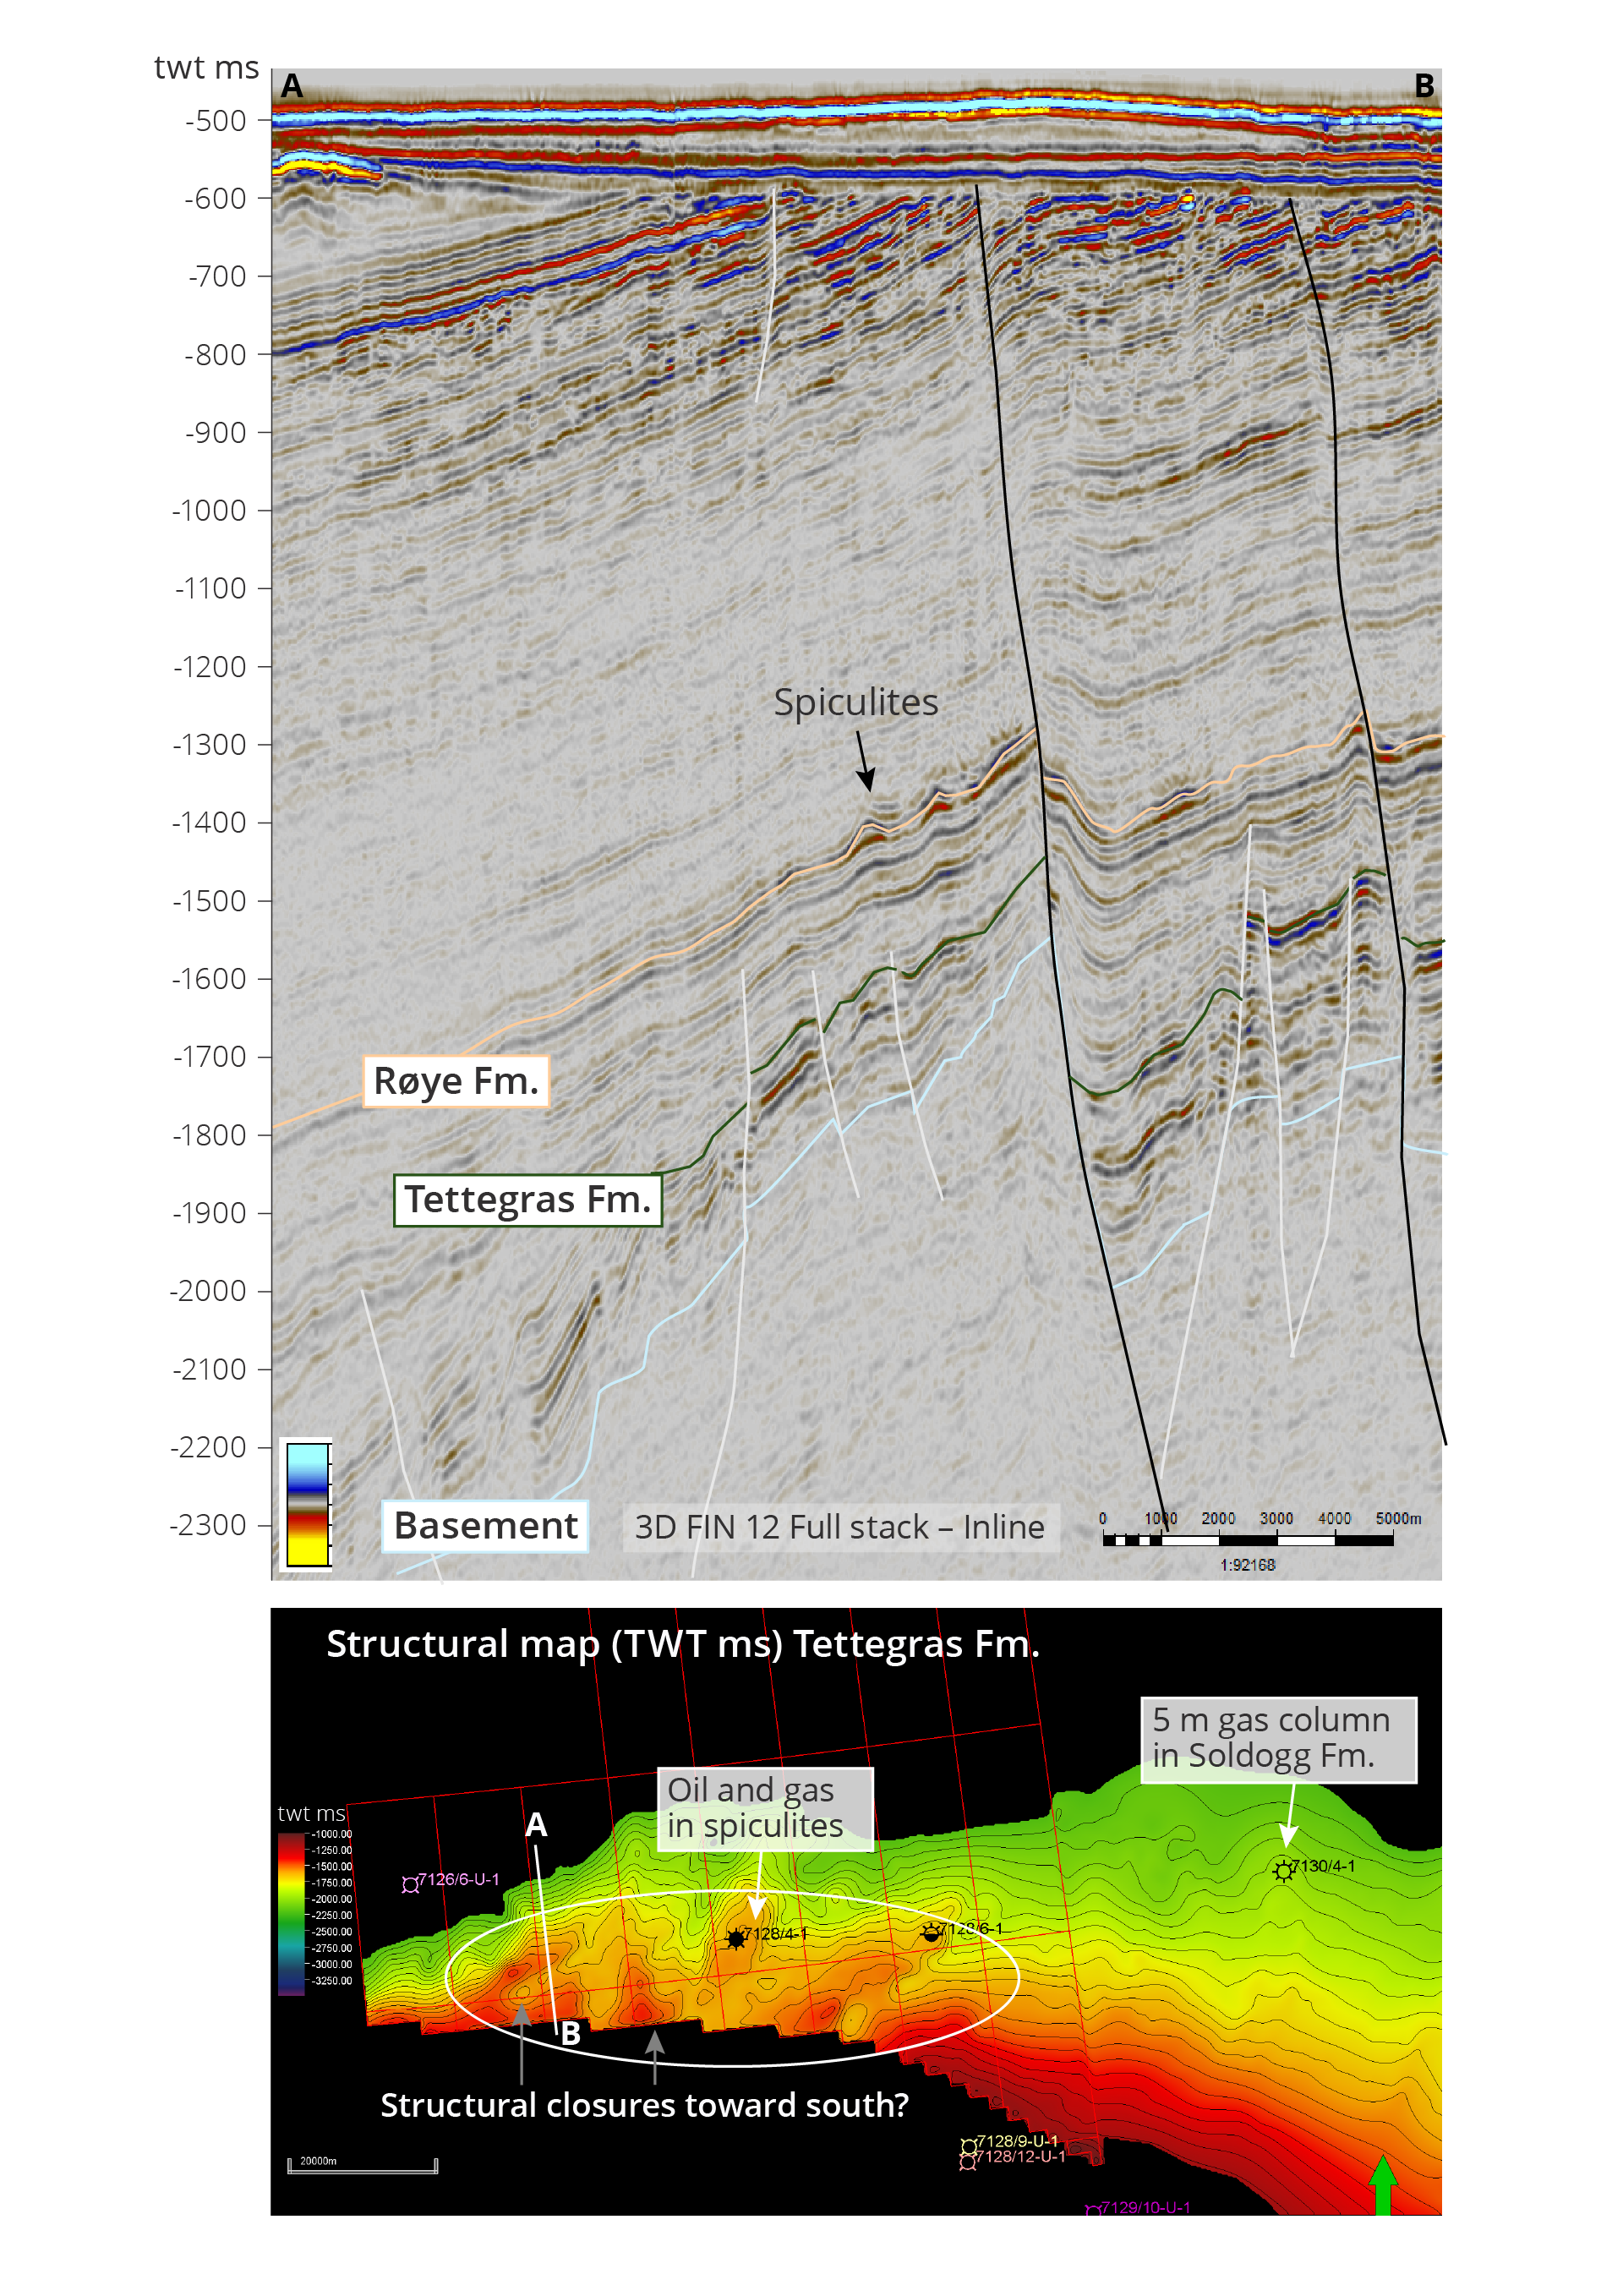
Figure 5.34 The seismic cross-section on top shows the Røye Formation, which can contain spiculites. The orientation of the cross-section is shown on the map at the bottom (white line). The map shows the extent of the mapped Top Tettegras Formation reflector.
Greater hydrocarbon potential than previously presumed in the Barents Sea West
The Norwegian Offshore Directorate has, for many years, been participating in expeditions mapping and sampling natural oil and gas leaks on the NCS.
A new source rock from the Early Miocene was proven in 2023 based on analyses and interpretations of oil samples from these leaks.
The Directorate has partnered with several universities and is participating in ongoing research projects to better understand the evolution of this new source rock. The goal is to investigate whether this source rock is present under the Bjørnøya Fan and in the western part of the Barents Sea, as well as how far it extends southward towards the Vøring Plateau in the Norwegian Sea.
If it is present under the Bjørnøya Fan and to the far west in the Barents Sea, it may significantly impact the prospectivity in this area.
In May 2023, the Norwegian Offshore Directorate participated in a scientific research expedition in the Barents Sea together with the University of Tromsø (UiT). This expedition was particularly focused on documenting natural gas seepages and taking samples for geochemical analyses, and put them in context with samples taken in other areas with the new young source rock. A mud volcano was discovered in the Sørvestsnaget Basin during this expedition. This was the second mud volcano ever discovered in Norwegian areas, and it was named Borealis.
Ten new mud volcanoes were discovered in spring 2024, in an area in the western Barents Sea, which was part of the APA 2023. Several piles on the seabed with interesting seismic imaging had been selected in advance for exploration. The volcanoes were confirmed using multibeam echo sounders and surveys using ROVs (remotely operated underwater vehicles).
The mud volcanoes were discovered by the EXTREME24 expedition with the research vessel RV Kronprins Haakon. The primary objective of this research expedition under the auspices of UiT was to conduct additional studies on the Borealis mud volcano.
Both gas and sediment samples were taken from most of the mud volcanoes. These samples will be subject to biostratigraphic and geochemical analyses to confirm both, the age of the sediment, the source rock that is generating the gas and potentially other hydrocarbons.
Indications of a new source rock and the discovery of multiple mud volcanoes could indicate a greater hydrocarbon potential than previously presumed for the Barents Sea West.
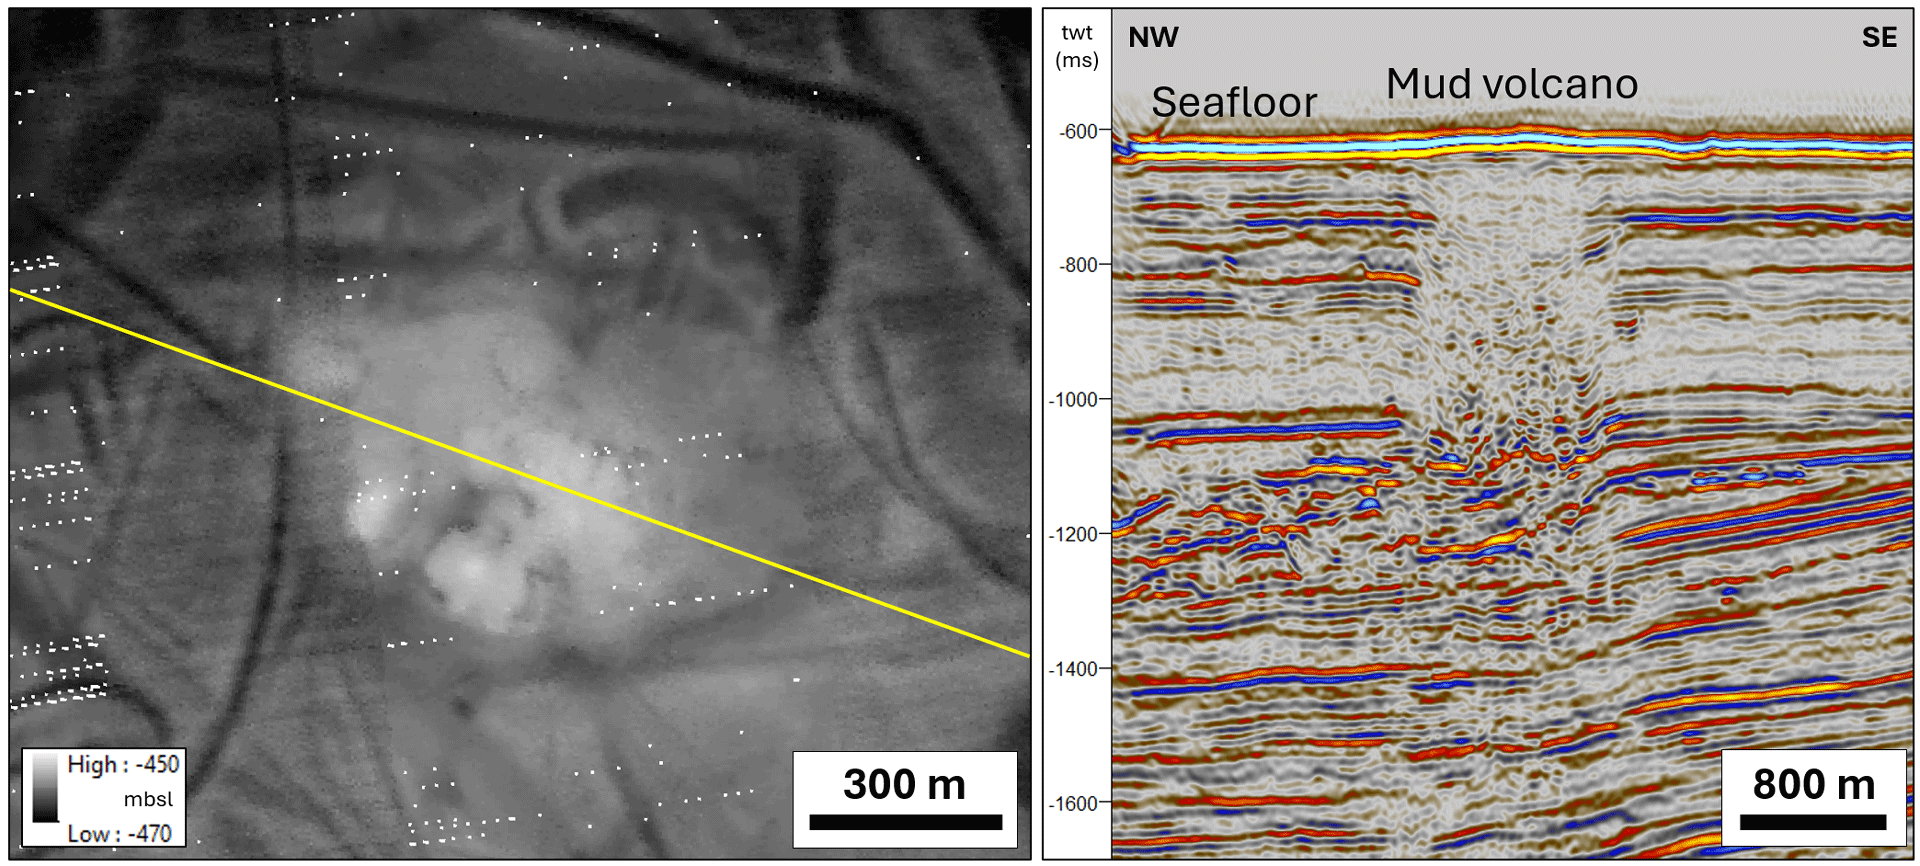
Figure 5.35 The map on the left shows the seabed mapped with echo sounders (unprocessed data, ten-metre resolution). One of the newly discovered mud volcanoes can be seen in the centre of the map (light grey shading). The yellow line indicates the position of the cross-section on the right. The mud volcano is a pile on the seabed with a diameter of about 600-700 metres and a height of up to seven metres over the surrounding seabed. The cross-section through the mud volcano shows clear seismic indications of mud and gas bubbling up in a broad area under the mud volcano, which is indicated here by a chaotic expression in the centre of the image. The source of this mud appears to be shallow, about 400 metres below the seabed.
DownloadUpdated: 9/23/2024