
Three potential scenarios
three potential scenarios for the ncs leading up to 2050
The Norwegian Offshore Directorate has drawn up three potential scenarios for overall production of oil and gas leading up to 2050. High exploration activity, a large number of discoveries, technology development and stakeholders willing to invest will increase production and revenues to the government. On the other hand, low exploration activity and less willingness to invest will lead to a rapid dismantling of the petroleum activities.
In this chapter:
- The petroleum sector is very important for Norwegian value creation
- Remaining resources lay the groundwork for high value creation
- Exploration and technology development increase the reserve base
- Three scenarios leading up to 2050
- Base scenario
- Low scenario
- High scenario
- Consequences for future production and value creation
The petroleum sector is Norway’s largest industry measured by value creation, government revenues, investments and export value. It has vast ripple effects on the mainland. Overall, this means that the industry is very important for the Norwegian economy and has been since the adventure started more than 50 years ago.
The petroleum sector is very important for Norwegian value creation
When Ekofisk was discovered in 1969, Norway’s GDP per capita (corrected for differences in price level and measured in shared currency) was just below the OECD average. Since then, value creation in the Norwegian economy has increased faster than in most other OECD countries, see figure 4.1.
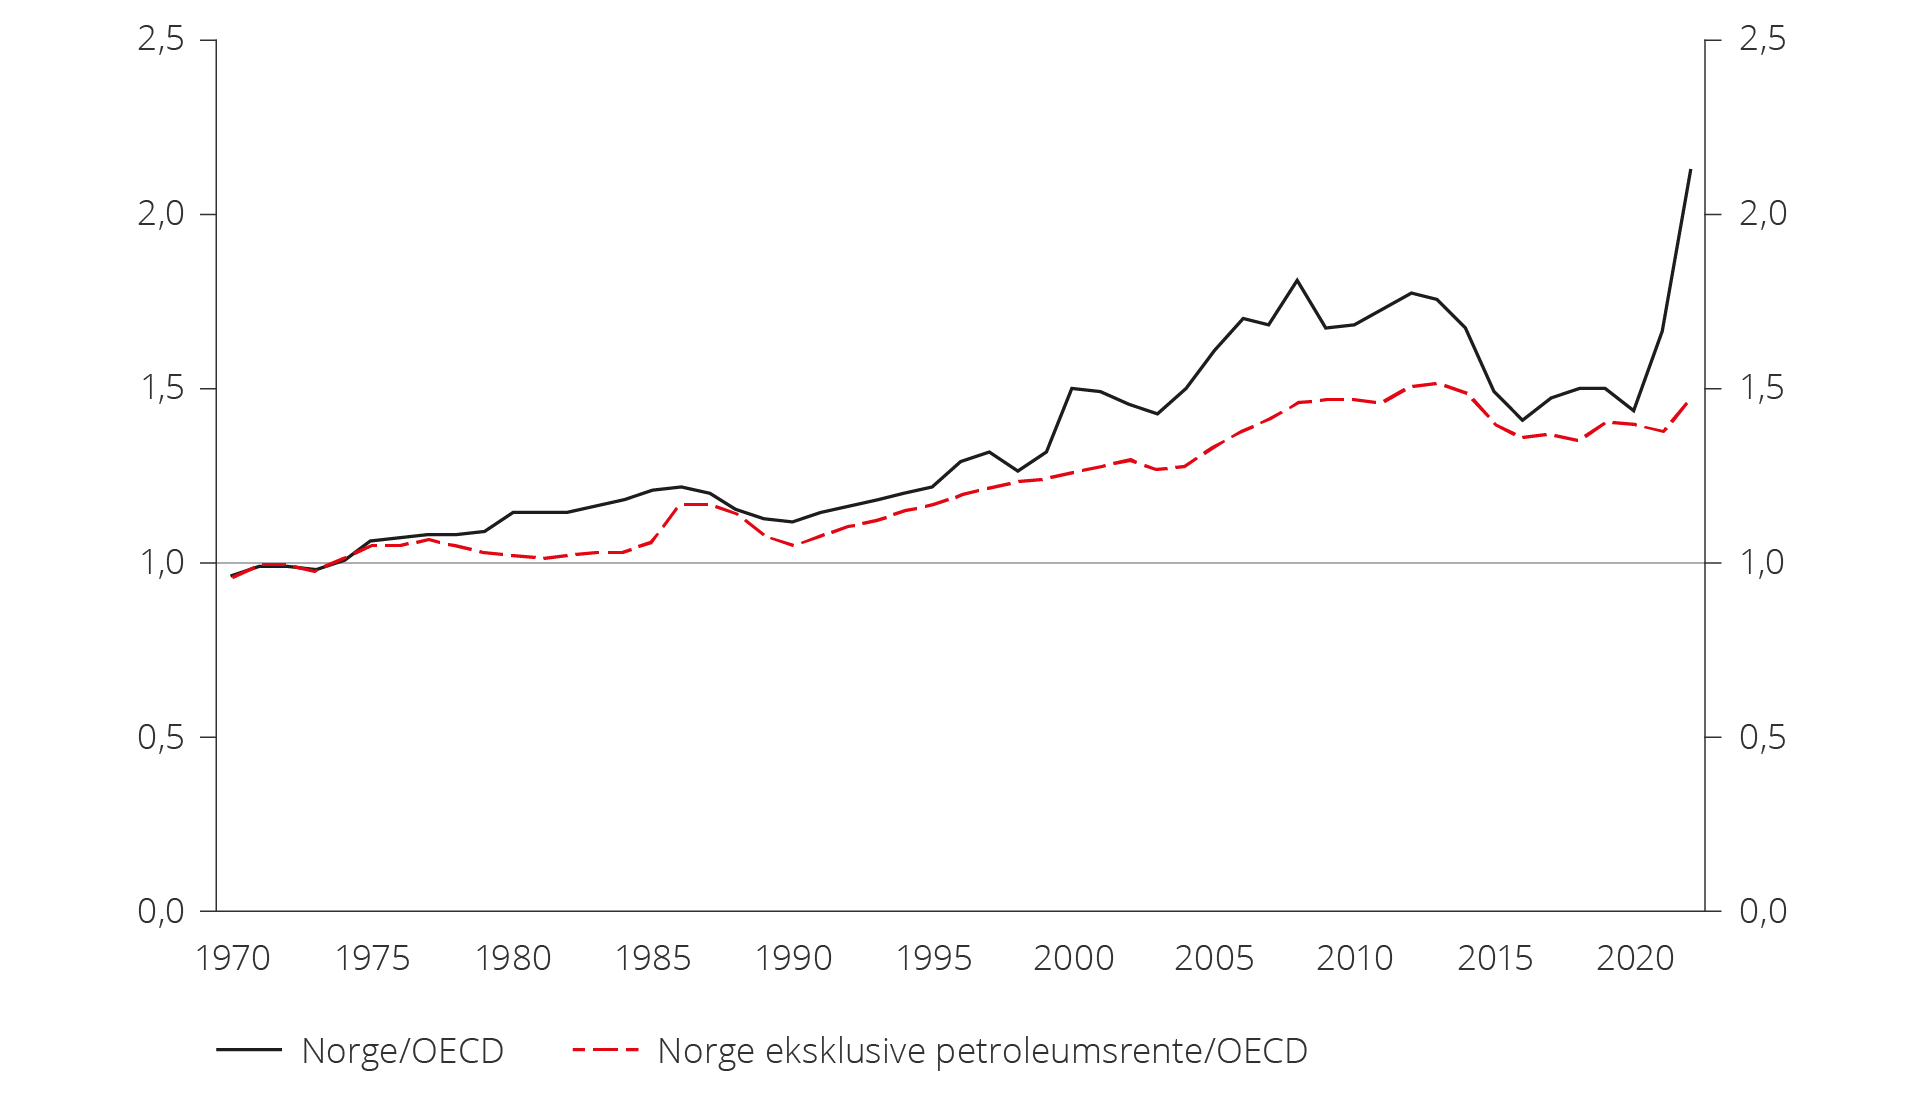
Figure 4.1 GDP per capita in Norway from 1970 to 2022 relative to the average of OECD countries during the same period (Source: NOU 2023:30).
Over the last five years, production of crude oil and natural gas, including pipeline transport, accounts for 22 per cent of GDP, see figure 4.2.
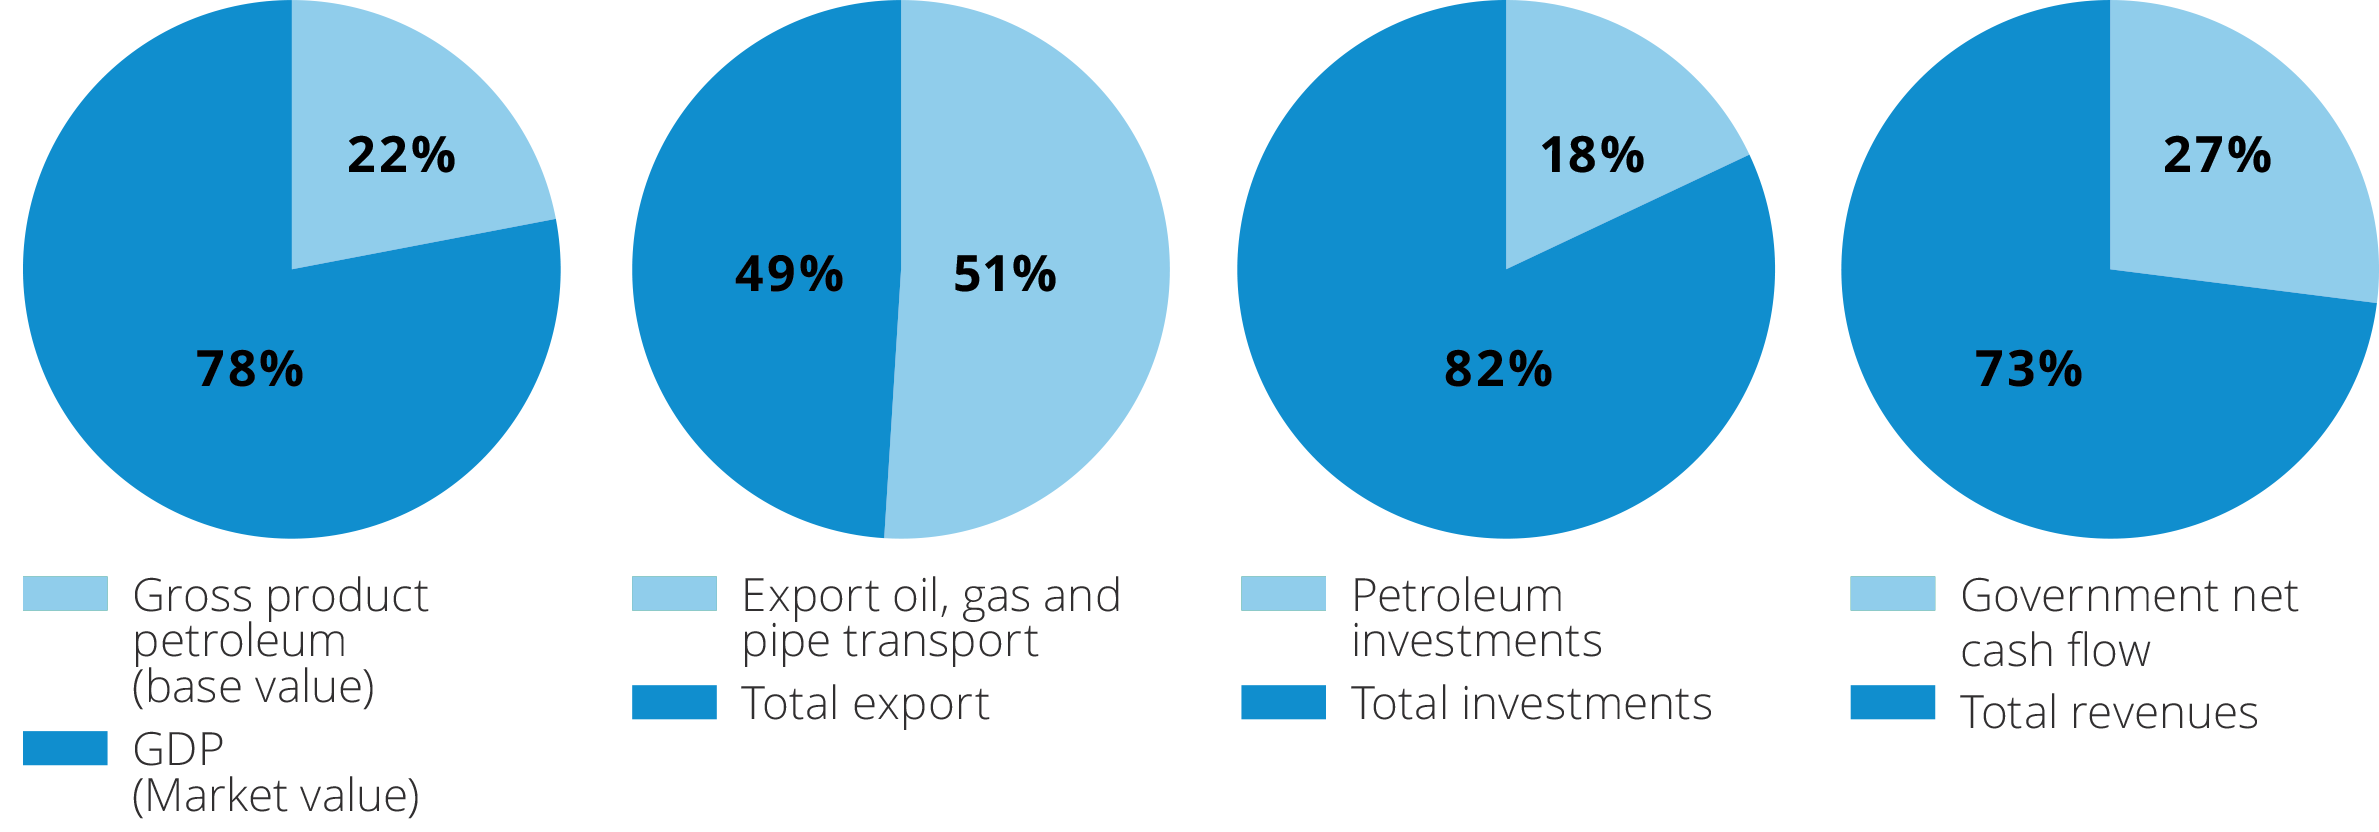
Figure 4.2 The petroleum sector's share of the Norwegian economy during the 2019–2023 period (Source: Statistics Norway and the Ministry of Finance).
During the same period, the value of exports of oil, gas and pipeline transport was 51 per cent of total exports. Furthermore, the petroleum activities account for 18 per cent of investments in capital stock and 27 per cent of government revenues.
Remaining resources are the foundation of high value creation
Remaining petroleum resources can be the foundation of significant production and value creation for several decades to come. The distribution of remaining resource volumes into resource classes along with the volume sold and delivered as per 31 December 2023 is shown in figure 4.3.
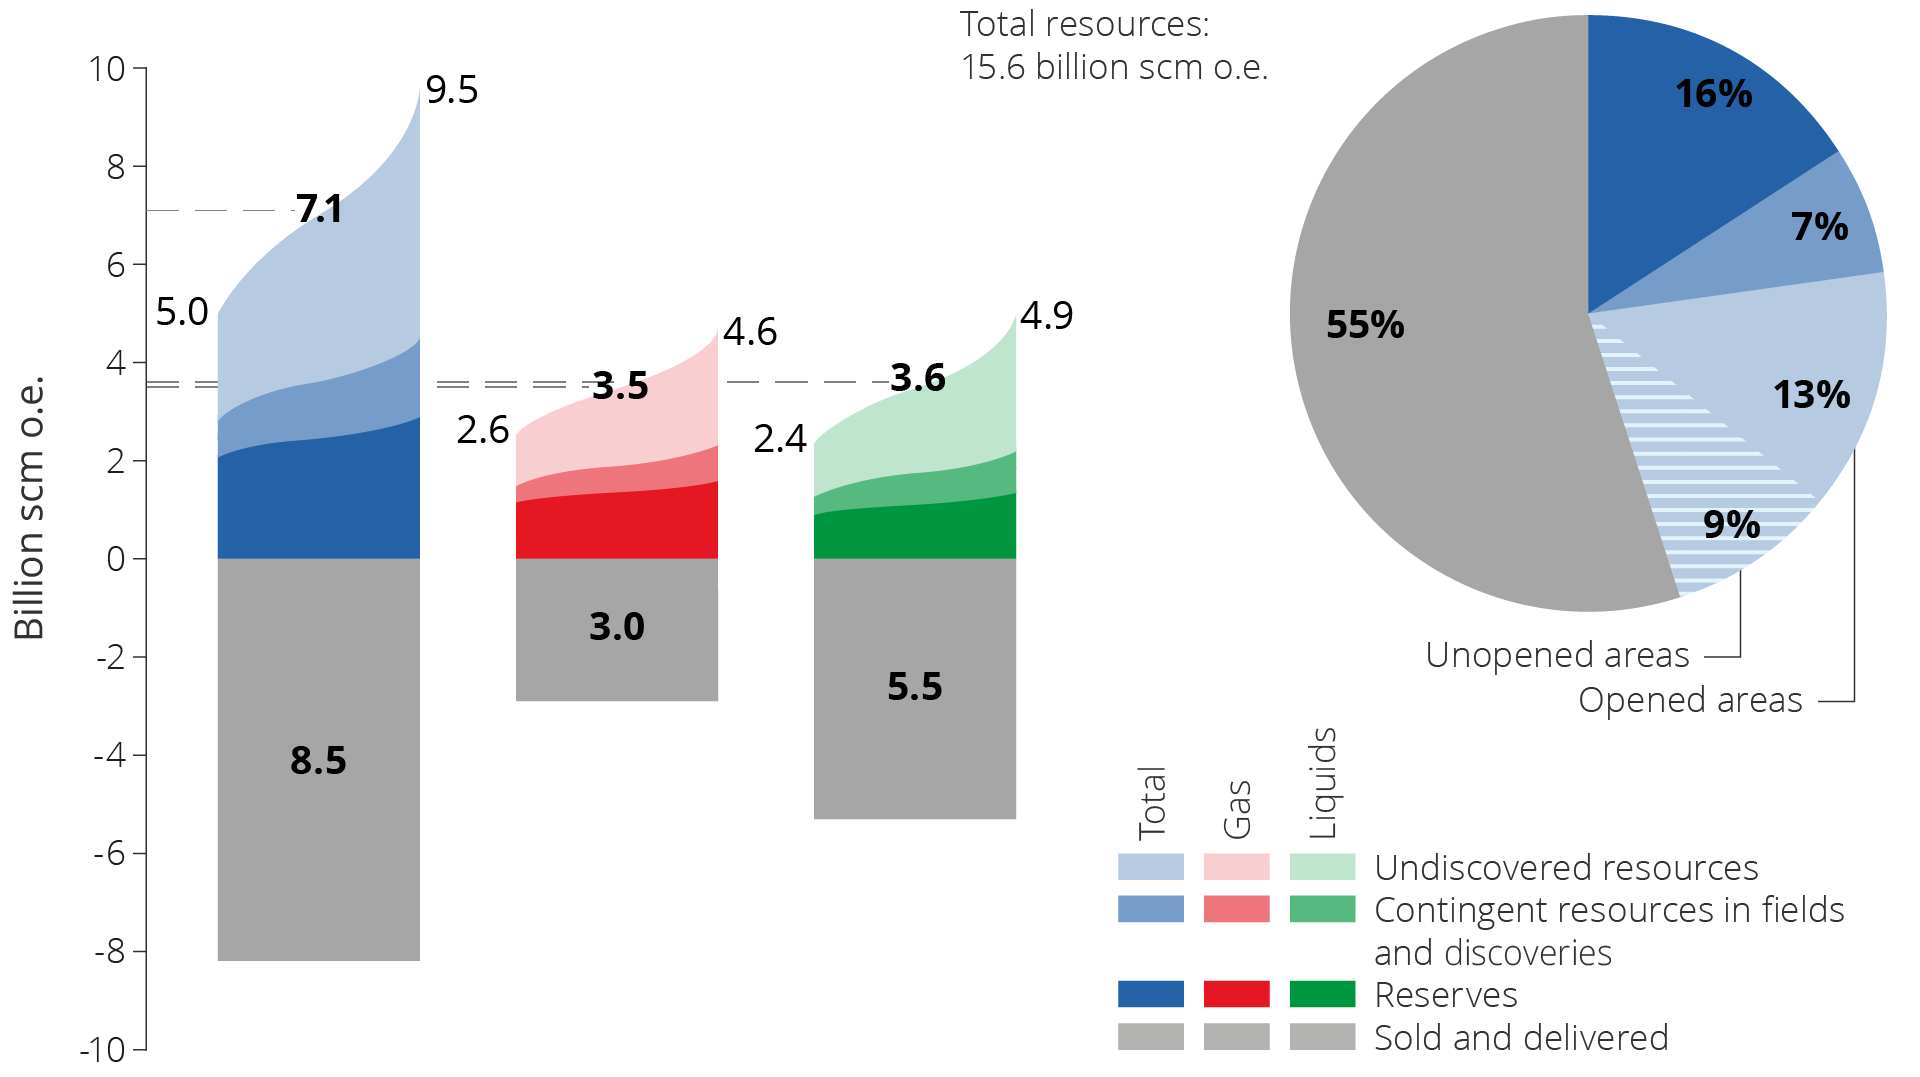
Figure 4.3 Petroleum resources and uncertainty in the estimates as per 31 December 2023.
The Resource accounts for 2023(11) estimate the overall expected resource volumes (including what has been sold and delivered) on the NCS at 15.6 billion standard cubic metres of oil equivalent (Sm3 of o.e.). The resources are distributed between 9.1 billion Sm3 of liquids (oil, condensate and NGL) and 6.5 billion Sm3 of gas.
Uncertainty in the resource estimates is illustrated with a low and a high estimate in the figure. The distribution is shown for both liquids and gas. The uncertainty in the volume estimates is greatest for the undiscovered resources and declines with increasing access to geological information. As a result of this, the uncertainty is greatest in areas that have not been opened for petroleum activities, which this report refers to as "unopened areas".
Uncertainty in resource estimates
Uncertainty expresses the range of possible resource outcomes or results. It is most frequently described with the aid of low and high estimates.
For example, the Norwegian Offshore Directorate estimates the undiscovered resources on the NCS to be between 1.9 - 5.7 billion scm oe. This uncertainty is calculated using a statistical method known as Monte Carlo simulations. The high and low estimates are described utilising statistical concepts.
Where undiscovered resources are concerned, the Norwegian Offshore Directorate uses P95 for the low estimate. This means that, given the assumptions applied in the analysis, the probability of a result equal to or larger than the 95 value is 95 per cent. P05 is used for the high estimate, which means a five per cent probability that the result will be equal to or larger than the P05 value.
The expected value is the average value. This is generally defined as the arithmetic mean of all the outcomes in the statistical distribution. Widely used, it has the property that the expected value for various distributions can be summed to give a sum of distributions. The expected value is normally somewhat higher than the P50 value.
Exploration and technology development increase the reserve base
Developments in exploration activity, successful exploration and how quickly technology development and implementation take place in the sector are all crucial for production and value development on the shelf. High exploration activity and rapid technological innovation can yield an entirely different production development than low exploration activity and slower technology development.
These factors are driven by underlying global and regional issues. Geopolitical developments, climate policy and the development of renewable energy have consequences for the energy markets and future oil and gas prices. This affects profitability and activity on the NCS.
As in other petroleum provinces, the NCS has historically seen a positive connection between oil price developments and the number of wildcat wells the following year, see figure 4.4.
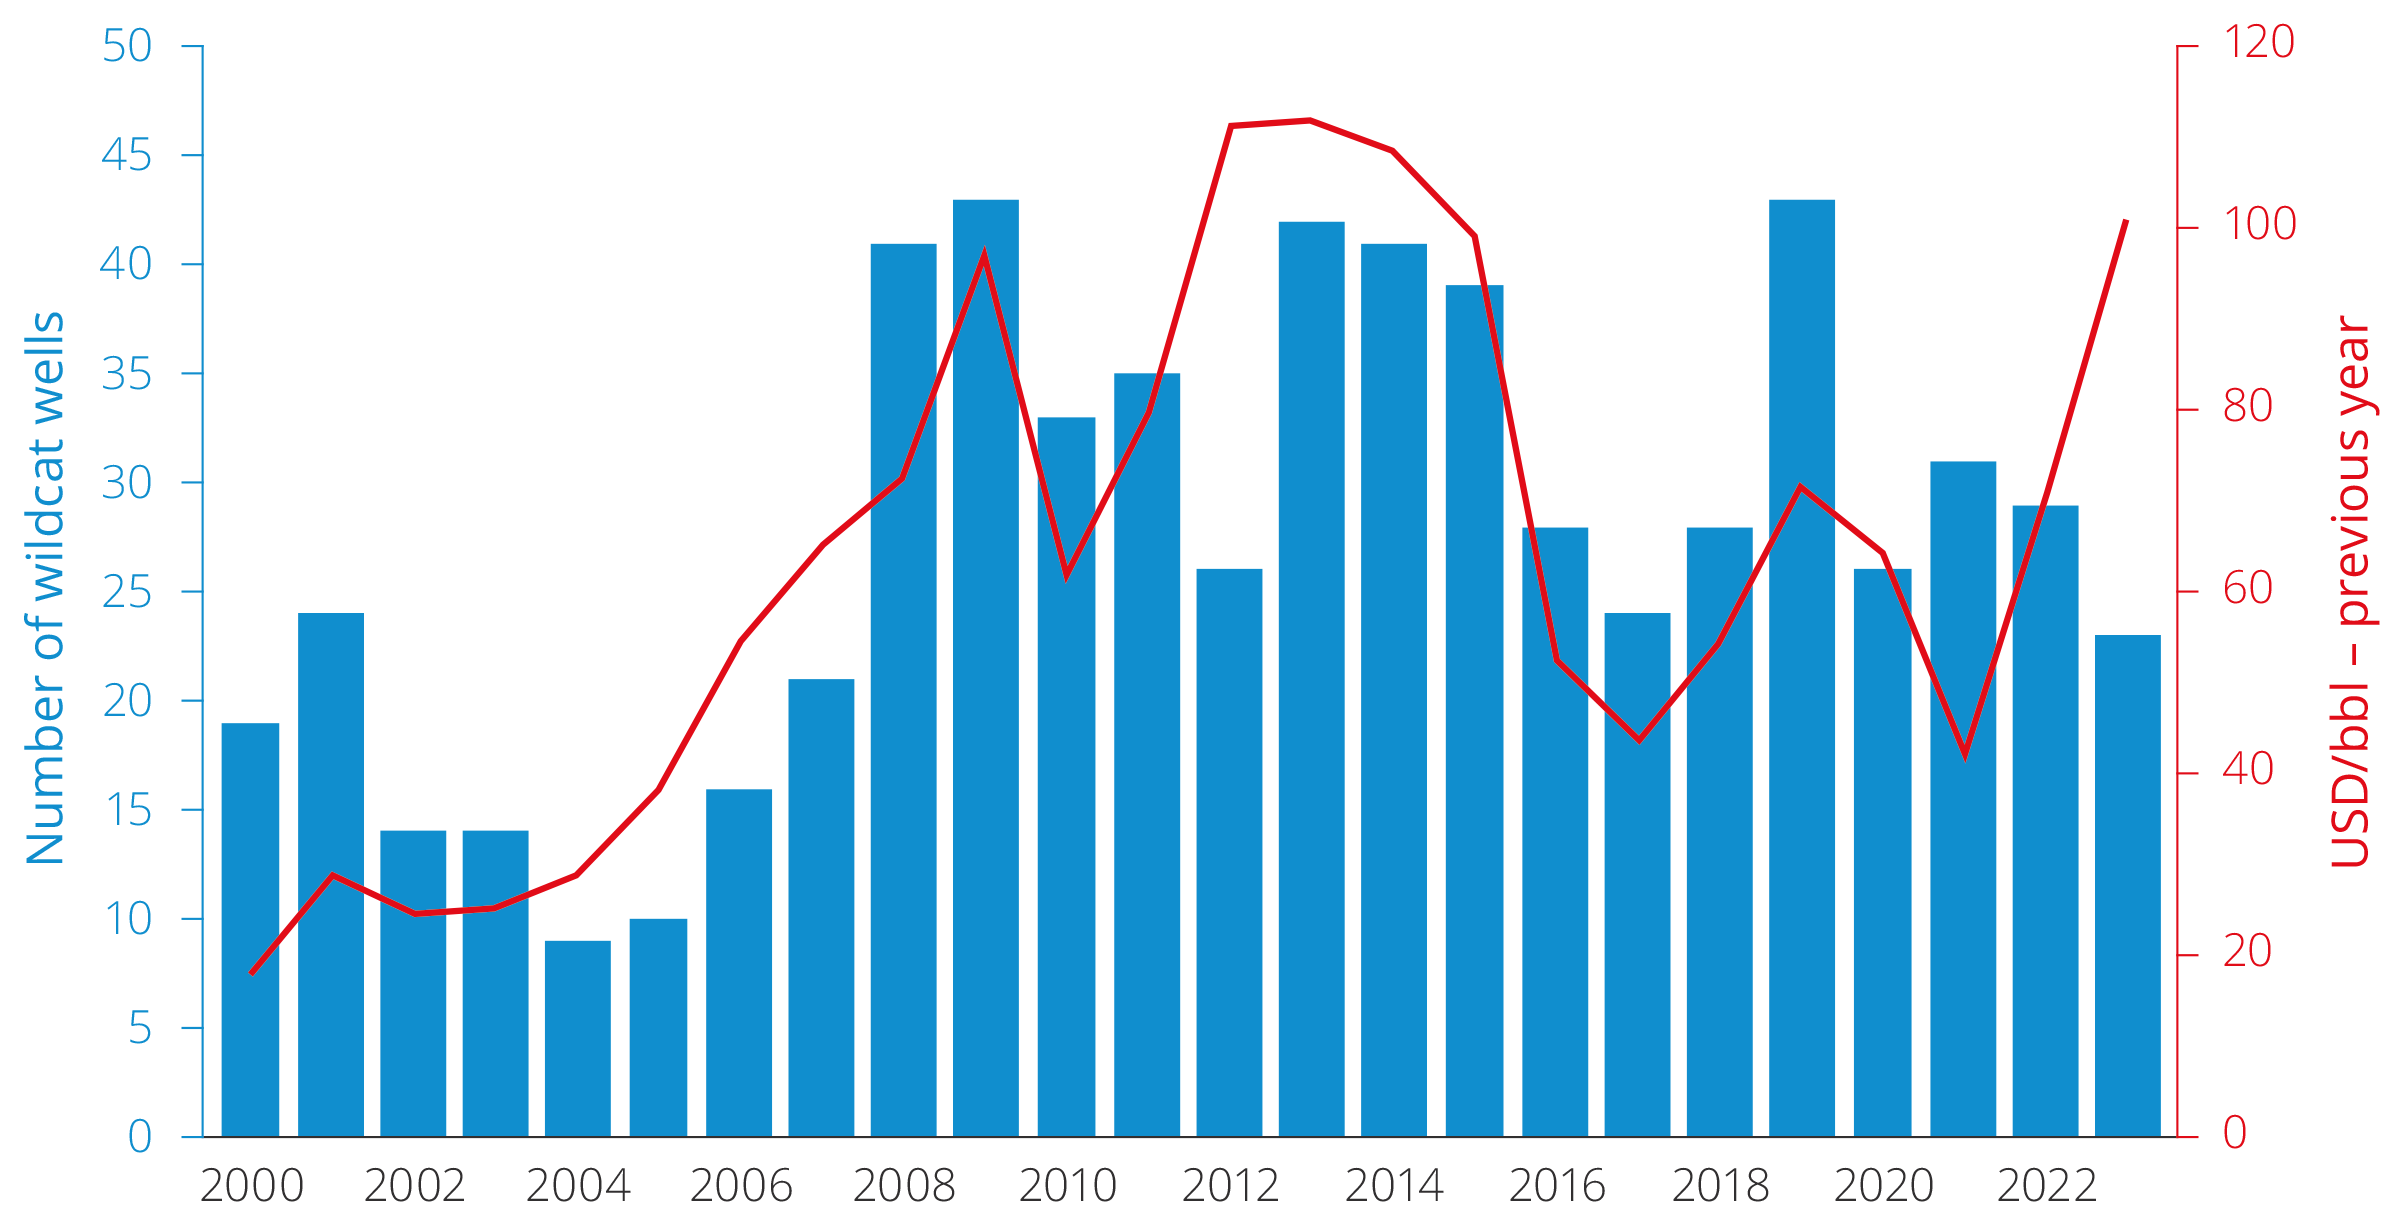
Figure 4.4 Number of spudded wildcat wells and oil price the following year (2000–2023).
Higher oil prices increase the value of new oil projects and companies' income, which in turn affects the exploration budgets. During high-income periods, oil companies tend to focus on increasing oil and gas resources by exploring more and taking greater exploration risks. Periods with lower oil prices and income see cuts to exploration budgets. Only projects with the highest expected profitability and lowest risk are prioritised.
In addition to the number of wildcat wells, technology development also affects reserve growth from new discoveries. Improvements in technology for imaging the subsurface have been crucial for high levels of exploration success.
As the resources become increasingly hard to find, the development and implementation of new technology will become even more crucial for future exploration success. At the same time, it is necessary to continuously review the professional basis and knowledge about the resources on the NCS.
Improvements in field development technology and drilling help ensure that more of the smaller and marginal discoveries become profitable for development. Considerable additional volumes can also be recovered by implementing advanced recovery methods. One example is recovery from tight reservoirs (chapter 5 and chapter 6).
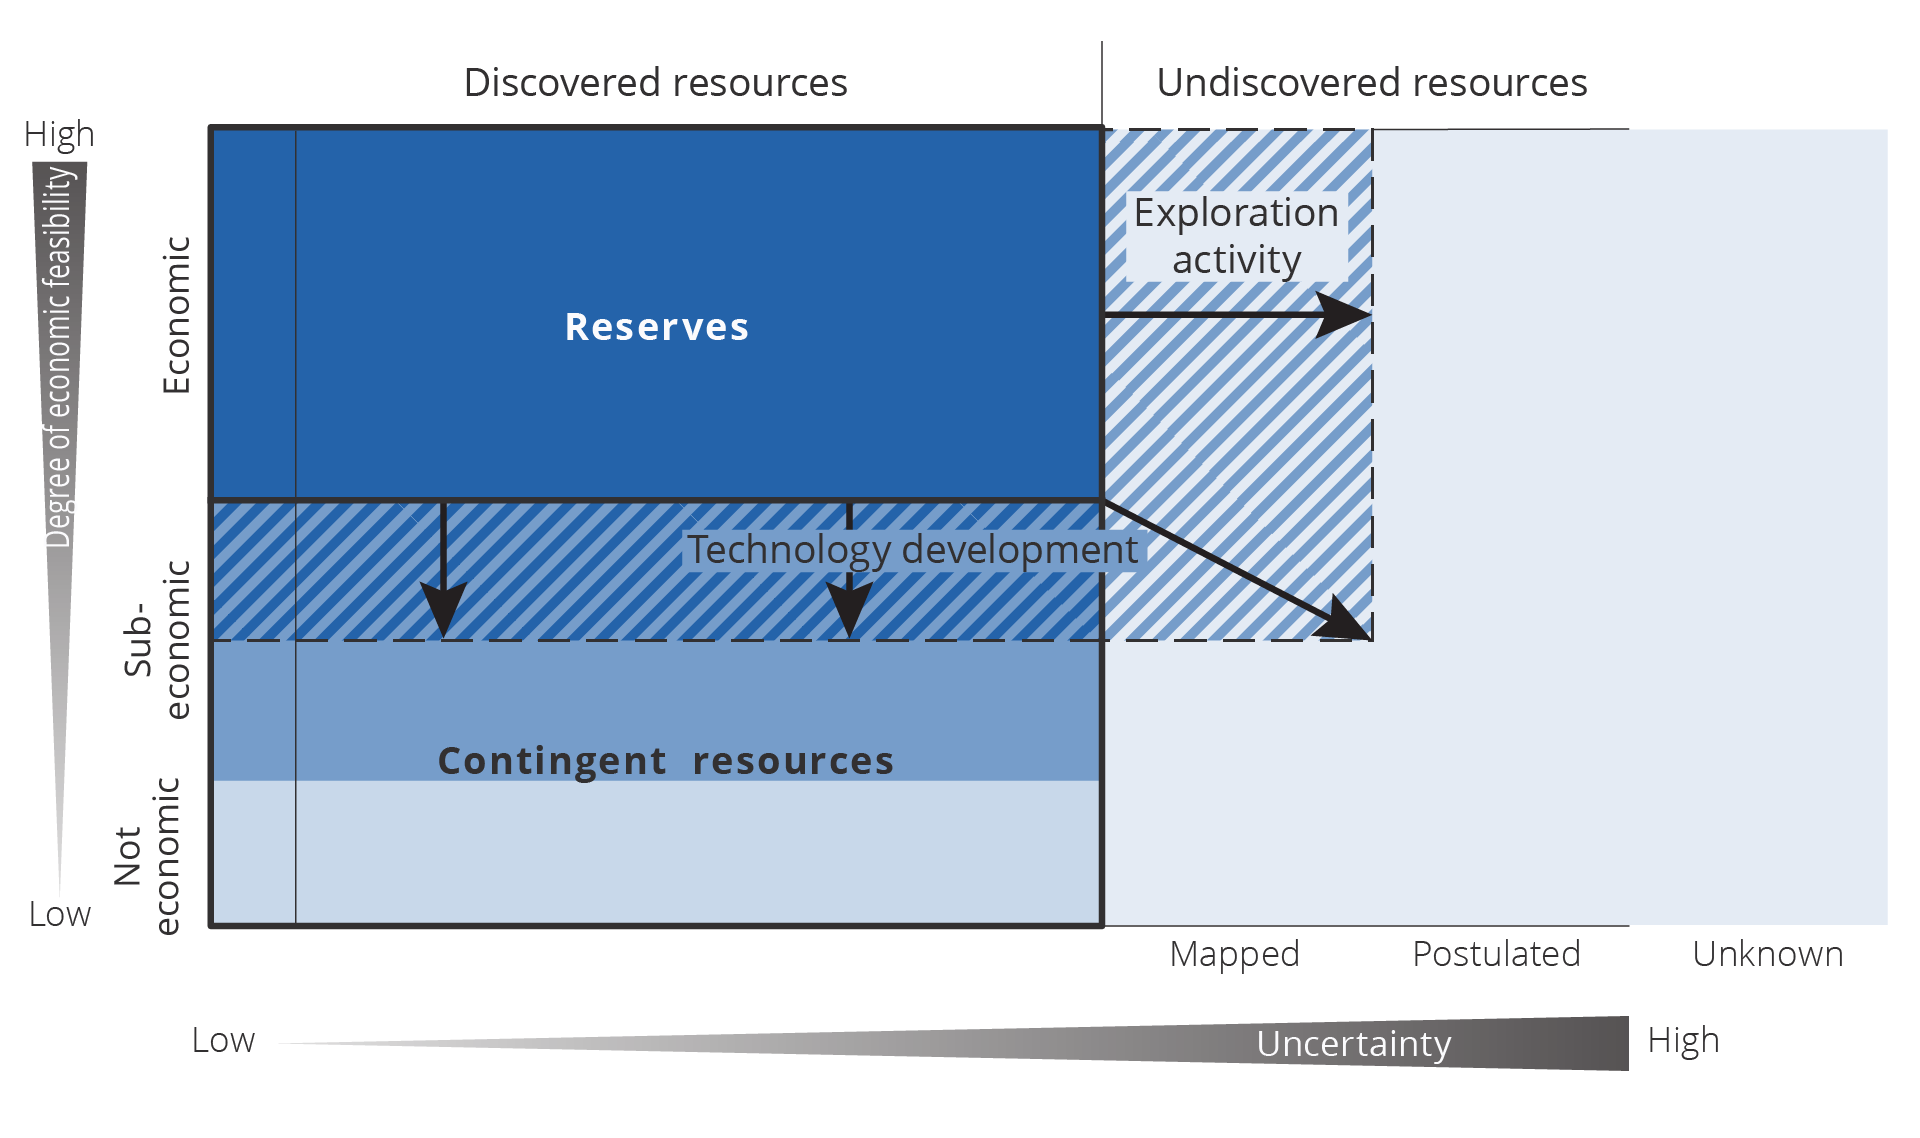
Figure 4.5 This figure is a modified version of the approach taken by American geologist Vincent McKelvey. The so-called McKelvey diagram(12) splits the oil in place into profitable and unprofitable resources and into discovered and undiscovered resources. When new technology and more information define new plays and discoveries are made, the reserve box expands toward the right. When technology development helps make marginal and unprofitable discoveries profitable to develop and recover, the reserve box expands downward. In an effort to reflect the possibility that unforeseen discoveries can still be made on the NCS, we have also added a category for unforeseen undiscovered resources(13).
Figure 4.5 illustrates how new technology and knowledge, as well as the ability to rapidly utilise new technology, can contribute to increase profitability for exploration, developing new discoveries and improved recovery on fields. The figure represents this as an increase in the reserve base; see resource classification, chapter 3.
Historically, there has been a tendency to underestimate how technology development and increased knowledge about the subsurface have contributed to increased resource growth and higher production. Figure 4.6 shows the development in the Norwegian Offshore Directorate's assessment of overall resources in 1990 and 2023. The Directorate's resource estimate has increased by about 60 per cent during this period.
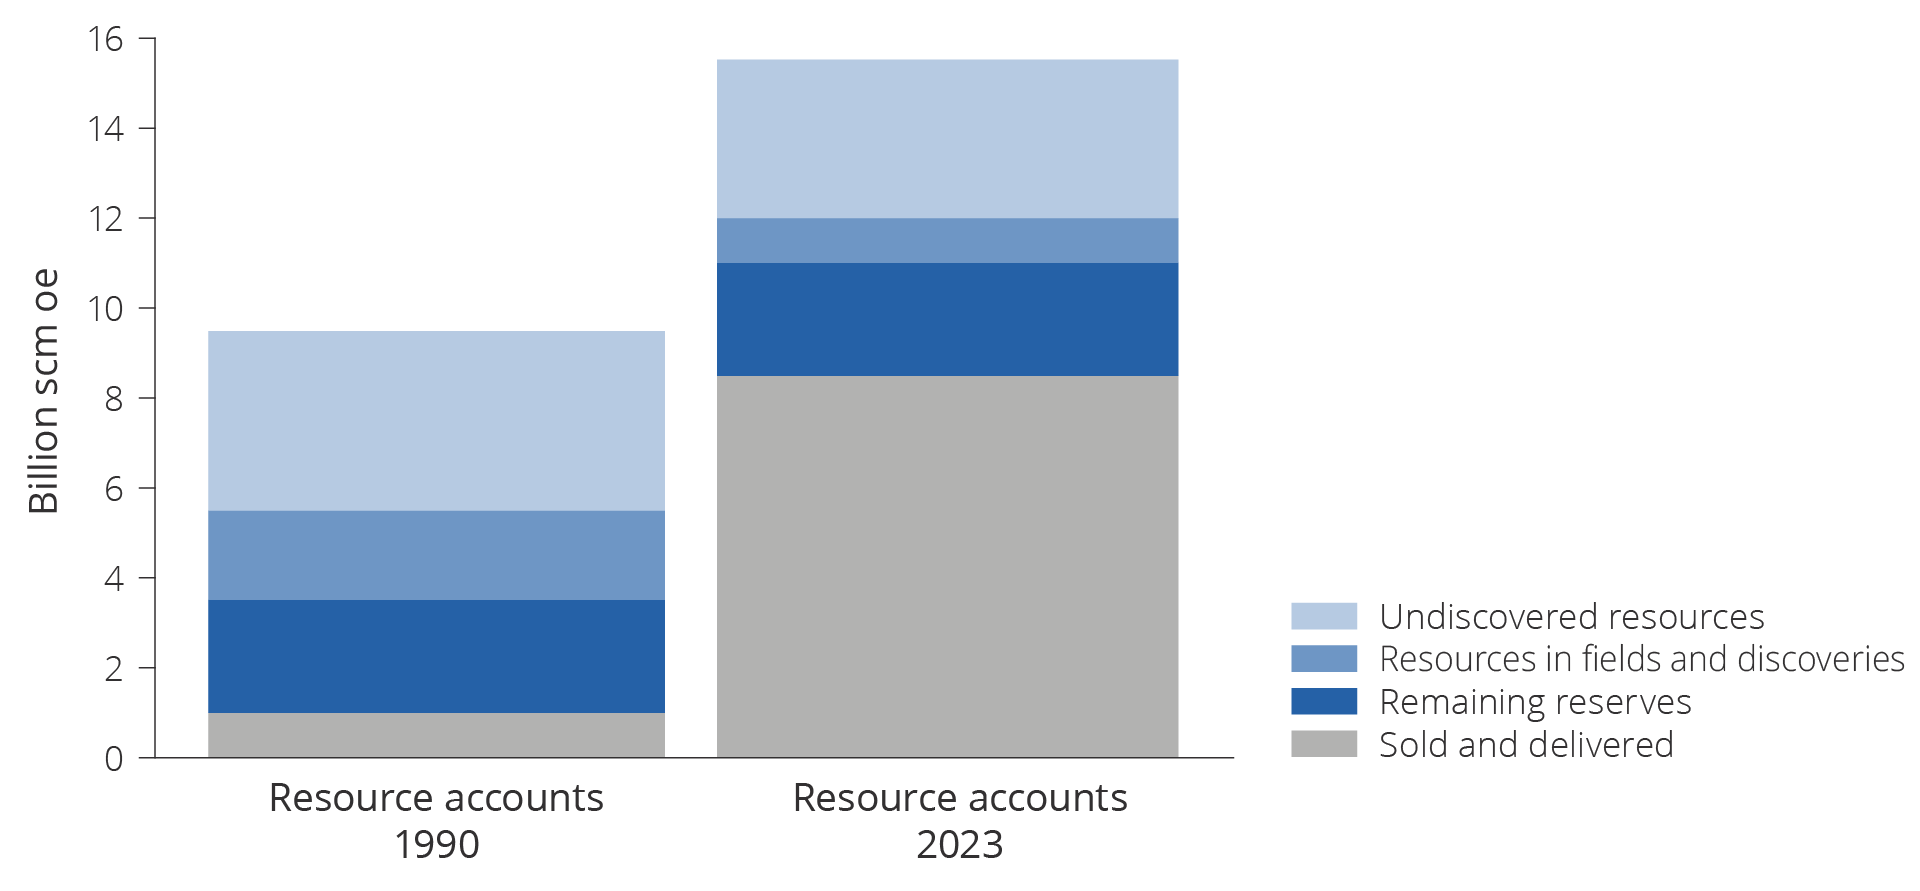
Figure 4.6. Growth in the Norwegian Offshore Directorate's resource estimate from 1990 to 2023.
Three scenarios leading up to 2050
The considerable uncertainty in the resource base, exploration activity and technology development make it difficult to create an unbiased forecast of future oil and gas production.
This is why the Norwegian Offshore Directorate has developed three scenarios for total petroleum production on the NCS leading up to 2050, which are better suited than a forecast to expand on the range of possible outcomes or opportunities for future production. The three scenarios were first published in the Norwegian Petroleum Directorate's resource report for 2022(14). They have now been updated with new data from the oil companies in connection with reporting for the 2024 revised national budget, see figure 4.7.
All scenarios show a decline in production, but the pace of this decline varies depending on exploration activity and technology development. The range of possible outcomes shows a significant spread in production in 2050.
The decline in production on the NCS in the three scenarios is within the interval for the global decline in oil and gas production the Intergovernmental Panel on Climate Change and IEA have estimated is in line with successfully following up the Paris Agreement(14).

Figure 4.7 Three potential scenarios for production developments for total production on the NCS 2025–2050.
Method for developing potential scenariosMethod for developing potential scenarios
Production trajectories are established for fields, discoveries and improved recovery in each scenario by starting with data reported by the companies (reporting for the revised national budget (RNB)).
The Norwegian Offshore Directorate's estimate for undiscovered resources in opened areas forms the basis for production from new discoveries. The production profile for new discoveries is derived from the scenarios' assumptions about exploration activity, discovery rate and lead times. Development solutions and associated cost and production profiles are developed for each discovery.
The model calculations for new discoveries are based on assumptions about typical development solutions (independent or satellite developments), main phase (oil or gas), resources, reservoir depth and distance to nearest infrastructure (both fields and pipelines). The cost level for exploration, development and production is based on historical costs on the NCS and expectations as regards future cost level and technology developments.
As production on the NCS is expected to gradually decline toward 2050, the infrastructure will need to be consolidated in order to keep unit costs down. This is reflected in the costs used as a basis.
The same market development is used as a basis for all scenarios. For computational purposes, the oil and gas price development from the 2024 revised national budget has been used as a basis. The Ministry of Finance's carbon price trajectories for use in socio-economic analyses are used for developments in the CO2 tax and emission credit price(16).
The Norwegian Offshore Directorate has calculated the profitability (net present value (7 per cent before tax)) for discoveries, fields and improved recovery. Only projects with positive net present value are included in the production profile. This yields a production cycle leading up to 2050 for each scenario. The scenarios vary as regards exploration activity and resource growth, capacity restrictions in infrastructure and industries, lead times and technology development.
Base scenario
In this scenario, liquids and gas production increases leading up to 2025, before it gradually declines in line with depletion of the resources. The gas share of total production increases over time.
Production development
Production reduces gradually from 243 million scm oe in 2025 to about 83 million scm oe in 2050 in line with a gradual production decline on the larger fields (base, figure 4.7). This is a reduction of about two-thirds from 2025 to 2050. This constitutes a significant dismantling of petroleum activities leading up to 2050.
Exploration activity and resource growth
Exploration activity will remain at the current level over the next few years and will then decline. Over the short and intermediate term, the North Sea and Norwegian Sea will see the most exploration activity. These areas feature access to infrastructure with available capacity, and this can contribute to short lead times from discovery to production and short repayment times.
Discoveries being developed will maintain capacity utilisation on host fields, pipelines and process plants. Unit costs will be contained. This will increase profits on existing fields and result in a lower threshold for initiating new projects.
Over the intermediate and longer term, an increasing share of wildcat wells will be drilled in the Barents Sea, while the share in the North Sea will decline.
Many discoveries will be made, but they are consistently small and the resource growth from exploration will drop.
Technology development, discoveries and fields
As the industry is operated efficiently and extensive consolidation takes place, new discoveries will generally be profitable even if they are minor. Most new discoveries that come on stream will be developed as satellites to existing infrastructure, which will extend production on fields beyond original plans.
Several projects will be implemented to improve recovery on operating fields. However, these projects will not be sufficiently large to offset the production decline from operating fields.
The economy and society at large
The petroleum sector will account for substantial value creation over the next 25 years and will remain important for government revenues.
A report prepared by Statistics Norway (SSB) in 2022(17) estimates the number of direct and indirect jobs associated with the petroleum activities on the NCS at around 156,100 in 2021. This does not include jobs linked to the supplier industry's deliveries to the international petroleum industry. SSB presumes that jobs in the sector will decline in line with production. As production will drop by just under 70 per cent leading up to 2050, a similar reduction will be seen in jobs.
Alongside the decline in production, reduced activity, and production dropping by more than half leading up to 2050, there will also be a gradual decline in ripple effects on other industries. This will weaken the sector's role as the growth engine for the rest of the economy. At the same time, the industry in 2050 will still deliver substantial revenue per employee.
Low scenario
In this scenario, liquids and gas production will decline rapidly. This will accelerate the dismantling of the petroleum activities. A significant resource potential in fields, discoveries and undiscovered resources will never be realised.
Production development
Production will fall quickly from about 235 million scm oe in 2025 to close to zero production in 2050, see figure 4.7. In practice, this means that the petroleum activities will be dismantled.
Exploration activity and resource growth
Exploration activity will remain at the current level over the next few years, followed by a rapid decline. Most wells will be dry, few viable discoveries will be made, and exploration activity will stagnate.
Exploration wells drilled in the Barents Sea will be dry or result in very small discoveries. Exploration activity will therefore concentrate on the North Sea and Norwegian Sea, where ample access to infrastructure will incentivise further exploration. Nevertheless, as the discoveries will be very small, few of them will be developed. The exploration activity will therefore be unable to help maintain capacity utilisation on host fields, pipelines and process plants.
Technology development, discoveries and fields
Few new discoveries will be developed and very few improved recovery projects will be initiated. This will lead to a substantial production decline and reduced value creation for the industry.
Unit costs on fields will rise rapidly, as new discoveries through exploration will not contribute to substantially increased production on host fields. In turn, this will result in reduced profits and a drop in production. Costs will increase, accompanied by reduced profitability for exploration and the development of new discoveries. This will lead to many fields shutting down early.
The economy and society at large
The rapid decline in field production toward near-zero in 2050 will be accompanied by a reduction in both the number of jobs associated with the industry and ripple effects for the rest of the economy. SSB's calculations may indicate potential effects where the number of jobs drops by 100,000 compared with the base scenario(18).
In practice, this will entail a complete dismantling of the petroleum industry leading up to 2050. However, despite the substantial drop in production, this scenario will contribute to significant value creation over the next 25 years.
High scenario
Liquids and gas production will increase leading up to 2025 and stay at a high level over the next decade. Gas production will remain at a high level until 2037 and will then start to decline. The NCS is an attractive petroleum province, and the authorities and the industry both help maintain exploration activity, technology development and profitable petroleum production.
Production development
As of 2025, production will be maintained over the next decade, followed by a gradual decline. Production will drop from about 245 million scm oe in 2025 to about 120 million scm oe in 2050, see high, figure 4.7. In other words, production will be cut in half from 2025.
Exploration activity and resource growth
High exploration activity, both in areas close to infrastructure and more frontier areas, will quickly yield more and larger discoveries. Several major gas discoveries will be made in less mature areas in the Norwegian Sea early on in the period.
Multiple major discoveries will be made in the Barents Sea, for example in the western and central parts of the Barents Sea. These will be developed quickly. New and significant gas export capacity from the Barents Sea to the Norwegian Sea will be developed quickly. The major discoveries will lead to increased exploration. An increasing share of exploration wells will be drilled in the Barents Sea over the intermediate and longer term.
Increased exploration and more discoveries in mature areas will increase the value of existing fields and infrastructure. Discoveries being developed will maintain capacity utilisation on host fields, pipelines and process plants. Costs will be contained. Increased profits on existing fields will help extend production on the fields.
Technology development, discoveries and fields
Multiple innovations will increase profitability for exploration, improved recovery and the development of new discoveries. A number of major discoveries will be developed, either as independent offshore solutions or as subsea tie-back solutions to onshore process plants. All new, independent developments will be supplied with nearly emission-free power.
Several projects will be implemented to improve recovery on operating fields. New technology will be developed and implemented quickly. This will aid in improving recovery from tight reservoirs as well. A number of players will attempt and succeed with advanced improved recovery methods.
The economy and society at large
The sector's importance for the Norwegian economy and government revenues will be significant in this scenario. As production will remain at a high level for 10-15 years, employment will be high and ripple effects for the rest of the economy will be extensive.
The sector's significance will decline toward the end of the period in line with tapering production. However, the industry will still enjoy substantial revenue per employee.
Consequences for future production and value creation
All three scenarios show a decline in production moving forward, but the pace of this decline varies across the three scenarios. The production decline will depend on development in the world at large, the resource base and the stakeholders' investments in exploration and technology developments.
How these factors evolve could make a significant difference in future production. The three scenarios show a difference in accumulated production of 2400 million scm oe in 2050, see figure 4.8.
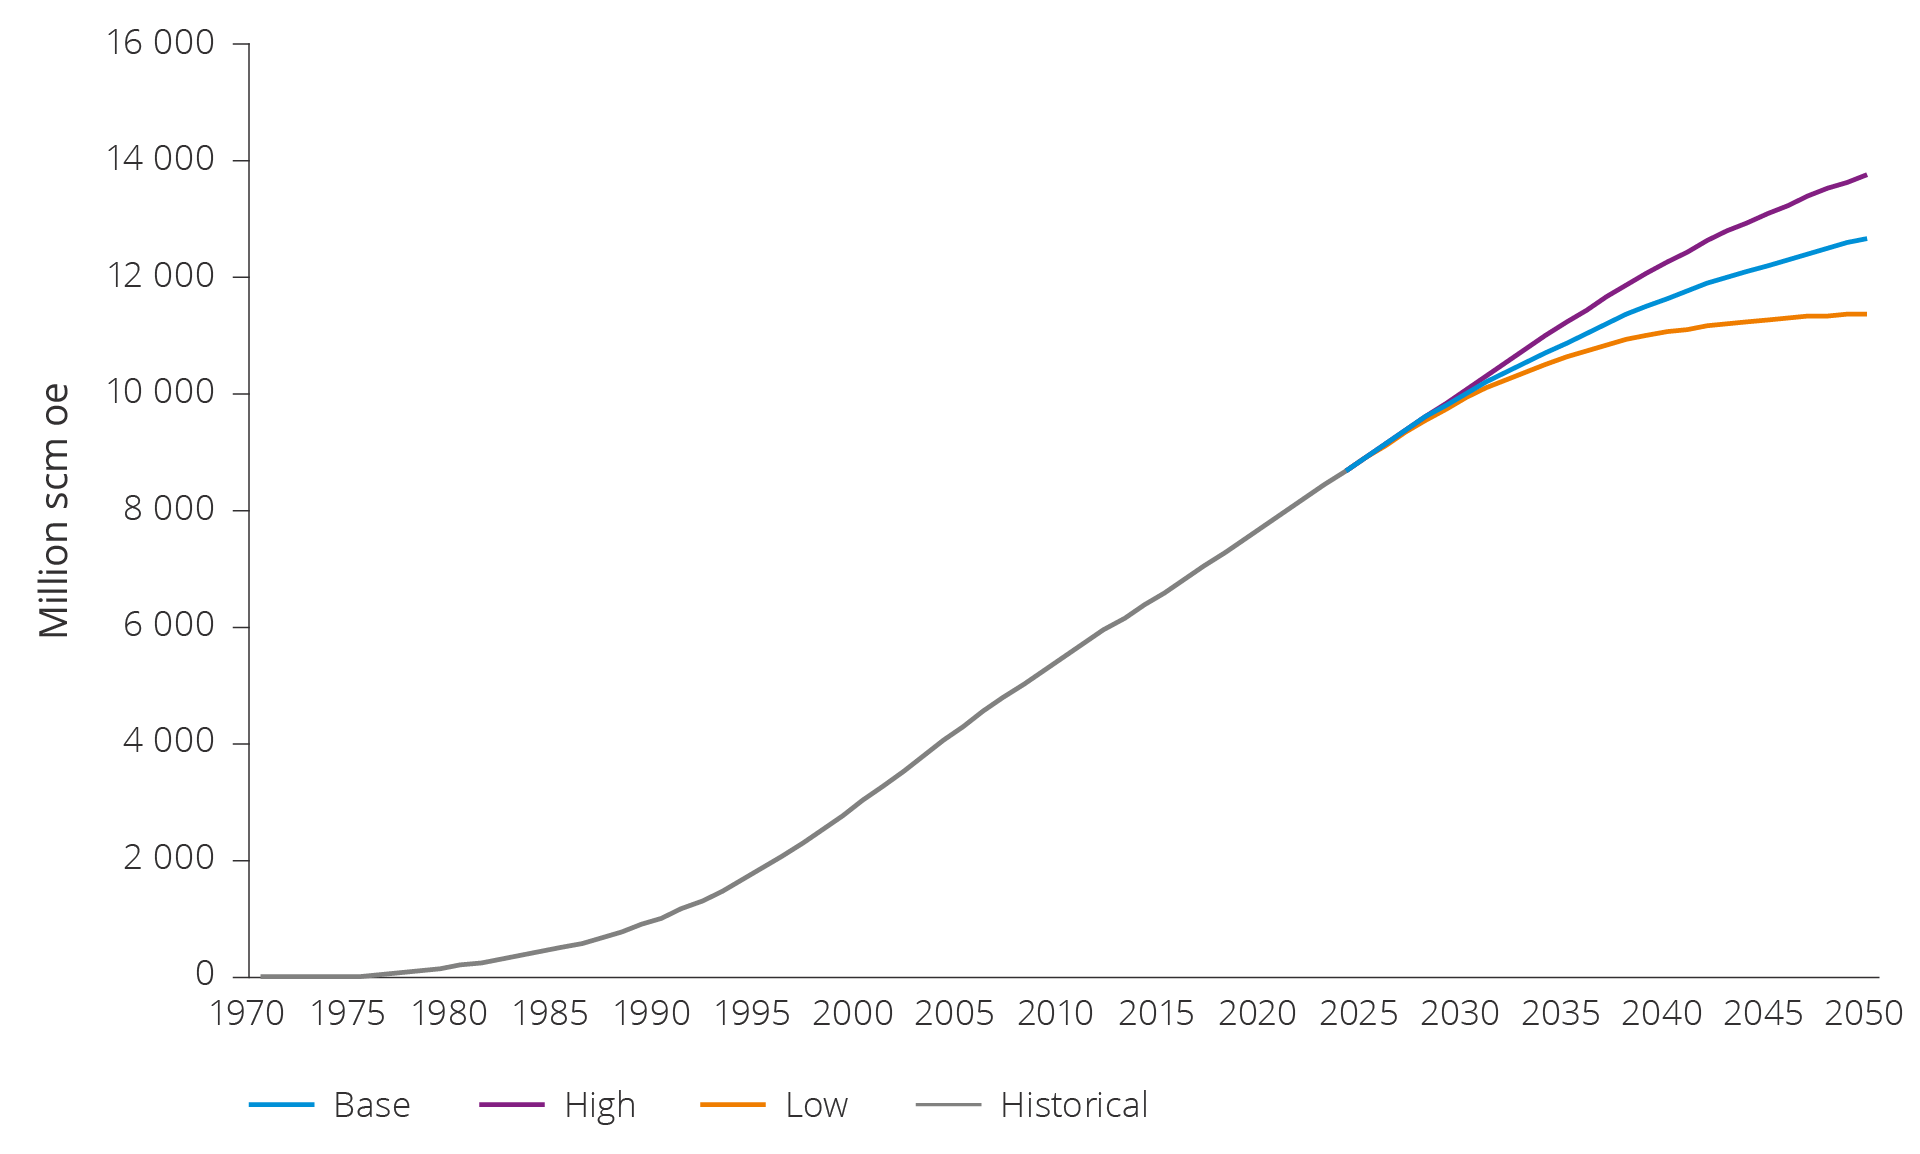
Figure 4.8 Projection of accumulated production leading up to 2050 in the three scenarios.
The scenarios reveal stark differences in future value creation and future government revenues from the petroleum sector, see figure 4.9.
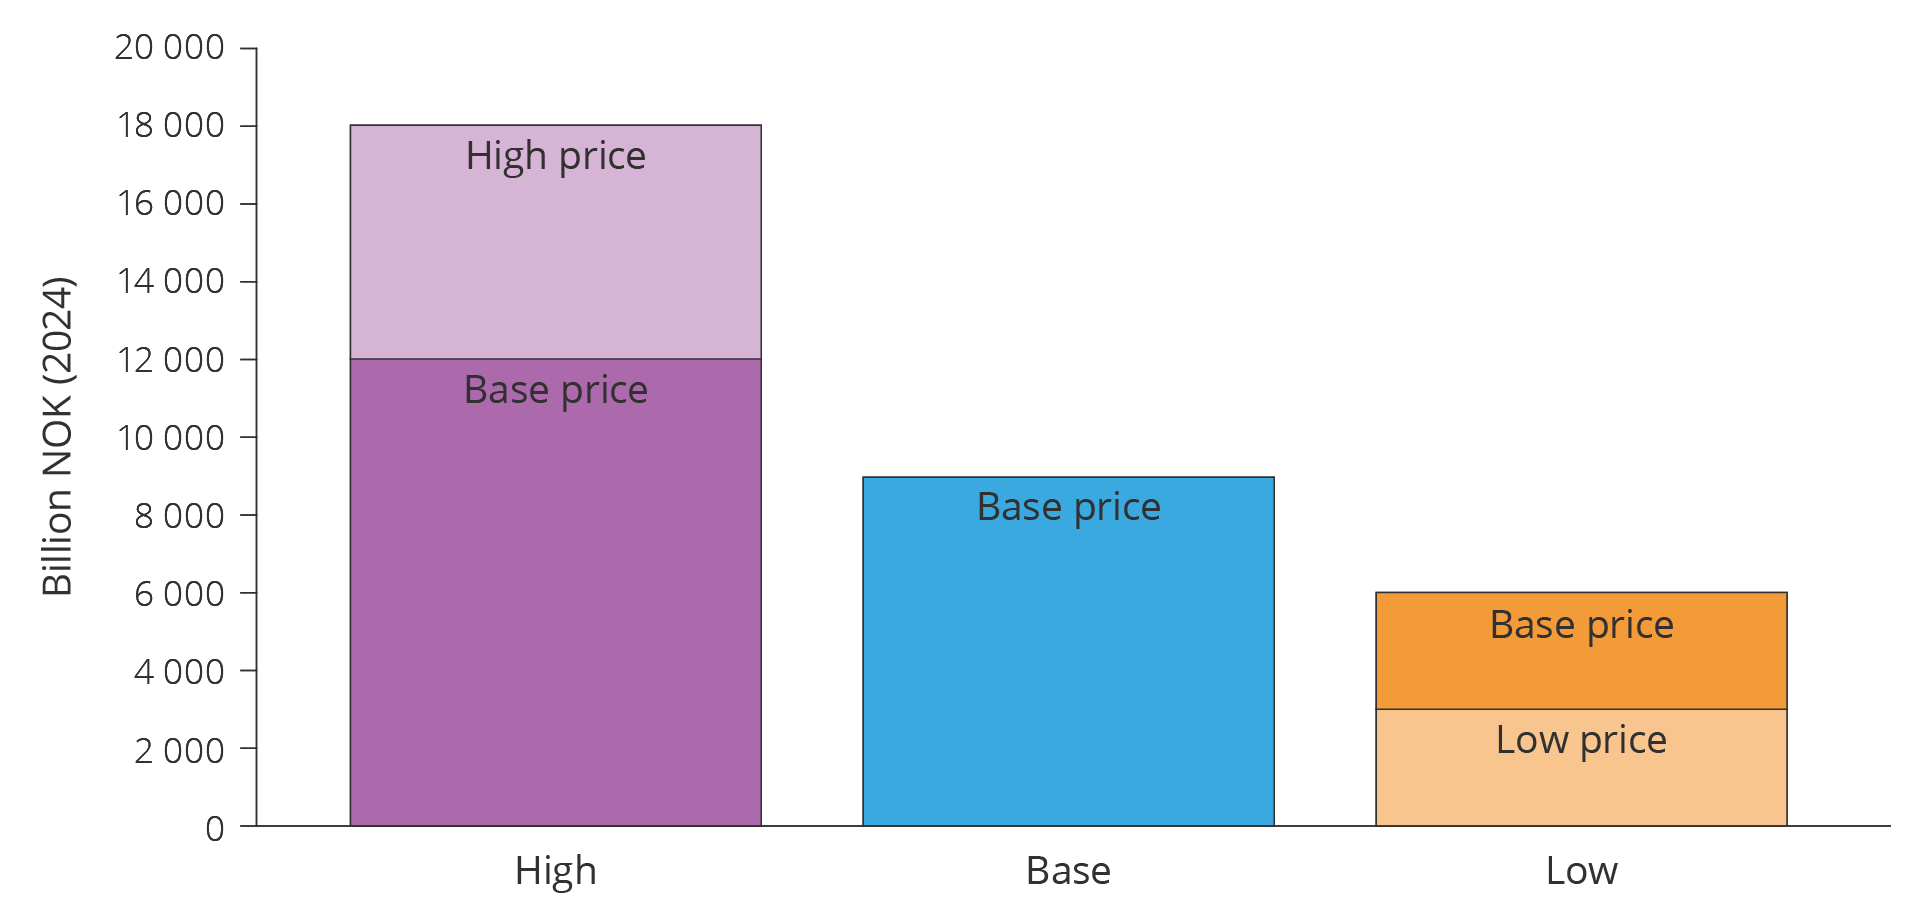
Figure 4.9 Projection of net cash flow from Norwegian petroleum activities 2025–2050 in the three scenarios. One trajectory where all three scenarios have a basic price of USD 70/bbl, and one including price sensitivity of USD 95/bbl in high, and USD 45 in low.
The number of jobs, inputs and ripple effects are adjusted downward in line with the decline in production. Calculations conducted by SSB(19) show that adaptation costs associated with the transition to different commercial activities are uncertain, despite the changes taking place over a longer period of time, such as in the base scenario. These costs could be substantial in the event of a rapid dismantling as seen in the low scenario(20). At the same time, there is significant uncertainty associated with the future activity level, even within each scenario.
Measures to increase resource growth and keep unit costs low will be crucial for future production and future revenues in all scenarios. New industries may help bolster the established value chains in oil and gas.
Download