2 - Investment and cost forecasts
The petroleum industry has made a considerable effort to reduce its cost level, which has resulted in substantial savings. The cost level for field developments has declined and there has also been a substantial reduction in both operating and exploration costs.
A combination of many different measures has yielded benefits in the form of increased efficiency, simpler solutions and more use of standardised solutions. All of this contributes to improved profitability. It is important to continue work in this area.
The estimated investment level in 2018 is marginally higher than in 2017. Further growth in investments is expected from 2018 to 2019. As regards exploration activity, we are anticipating moderate growth over the next few years.
Resource growth from new discoveries has been low in recent years. If no new, major discoveries are made, this will result in reduced investment activity over the medium to long term. At the same time, it will be important to mature new projects on operating fields in order to counteract the declining activity level.
Cost level developments
Since 2014, the industry has implemented multiple initiatives to reduce costs, following low profitability over time. The need to reduce costs was amplified by the declining oil price. Oil companies have worked alongside the supplier industry to put in a considerable effort. A broad spectrum of measures have been initiated in both the planning, implementation and operations phases. Individual measures with a relatively modest isolated impact, yield substantial reductions overall.
The decline in development costs is significant; for certain projects, the investments have been cut in half. The common denominator for the projects that are currently being approved, is solid value creation and break‐even prices of 30‐40 USD/bbl. The overall picture is that new development projects are robust at substantially lower prices than the current level.
Operating costs have also been reduced by about 30 per cent (Figure 2‐1) from 2013/2014. The reductions are mainly due to efficiency measures, streamlining and reduced supplier prices.
The NPD's forecasts presume a gradual growth in supplier prices as a consequence of the higher activity level. It is furthermore presumed that some postponed operations activities will have to be carried out. Costs are expected to rise somewhat as a result of this. At the same time, a considerable effort is being made to map and prepare new measures for additional improvements and cost reductions.
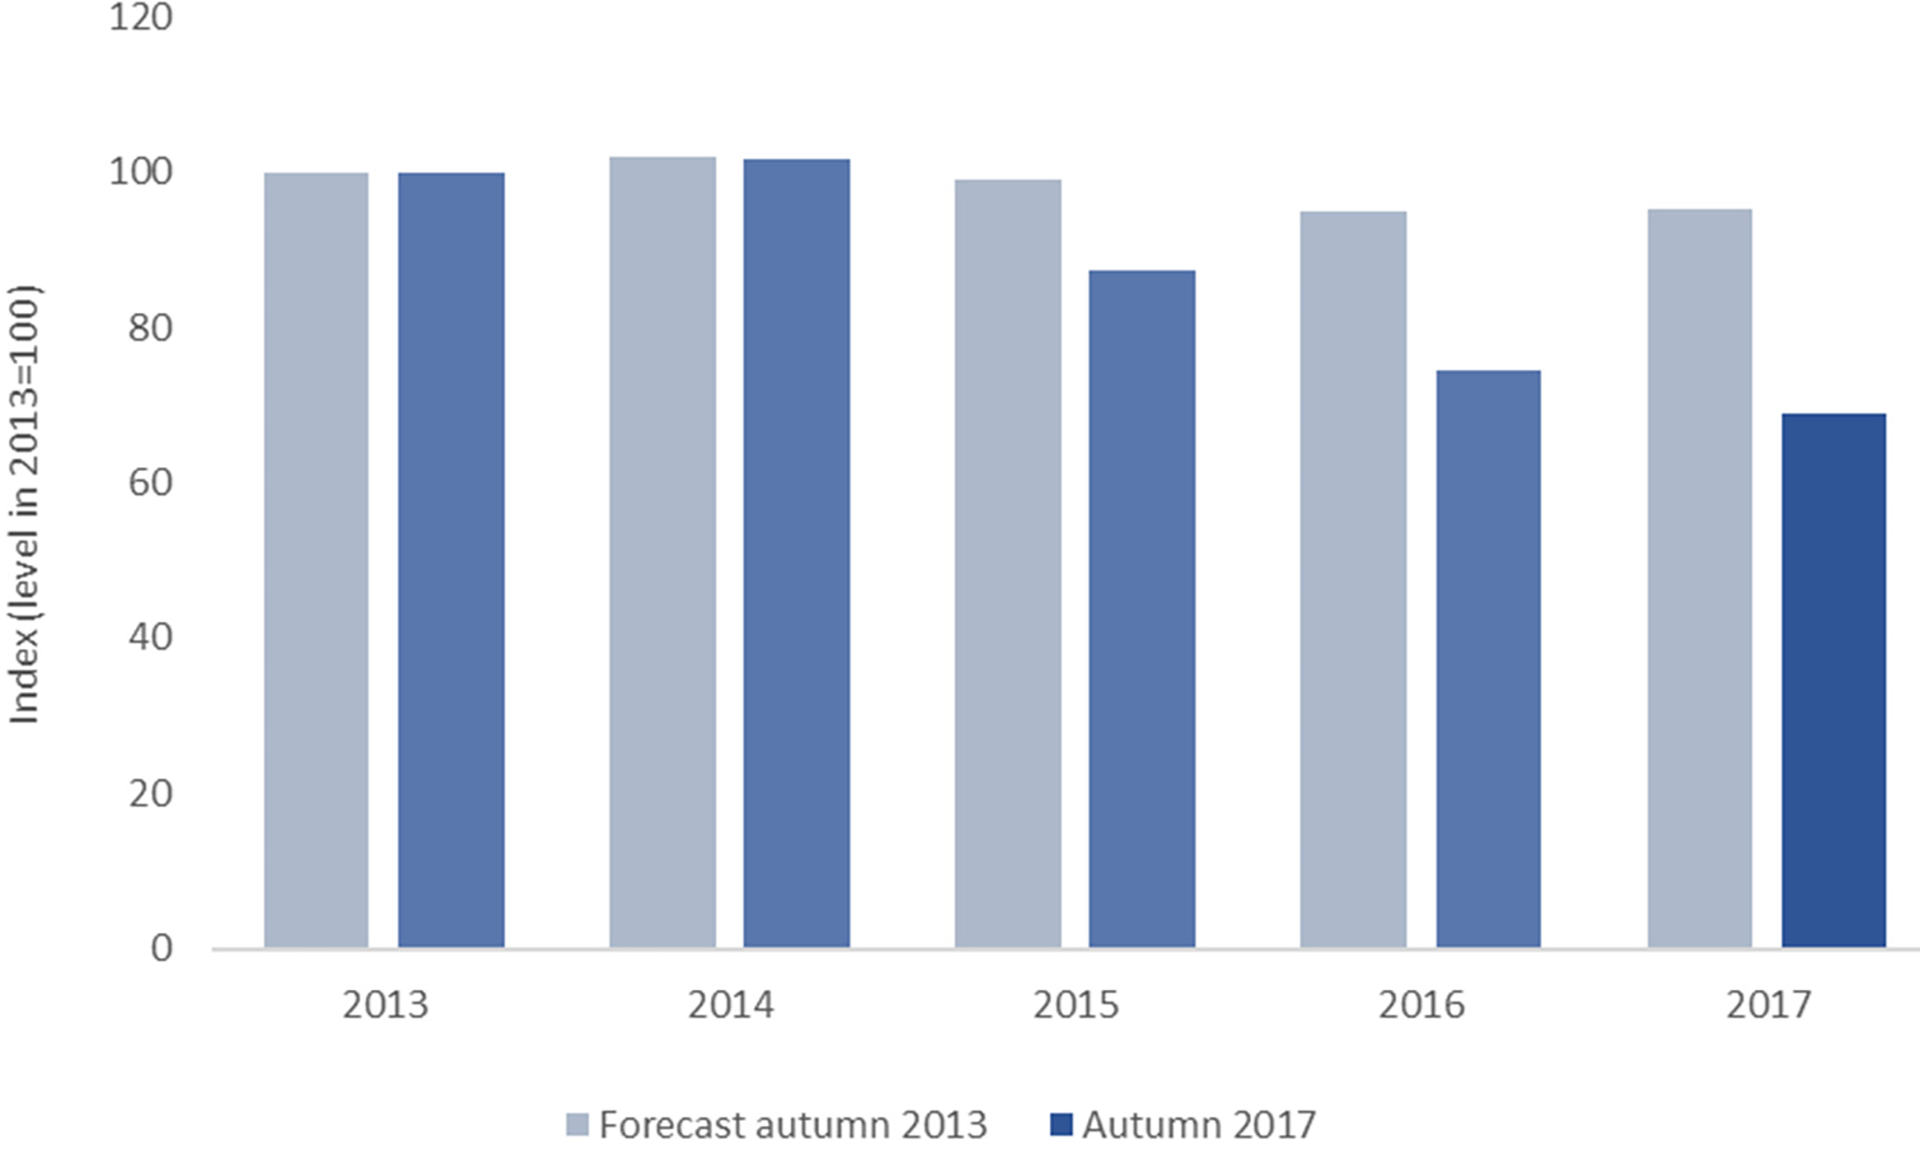
Figure 2‐1
Cost development for operating fields
Total investment estimates
Investments have now levelled off. In 2018, we are expecting investments to total approx. NOK 122 billion, which is marginally higher than in 2017, (Figure 2‐2). Due in particular to the fact that a number of new development projects are scheduled to start in 2018, there is uncertainty with regard to the overall investment level. The forecast has taken into account that project progress may be somewhat slower during the first investment year than what the companies have presumed in their investment estimates.
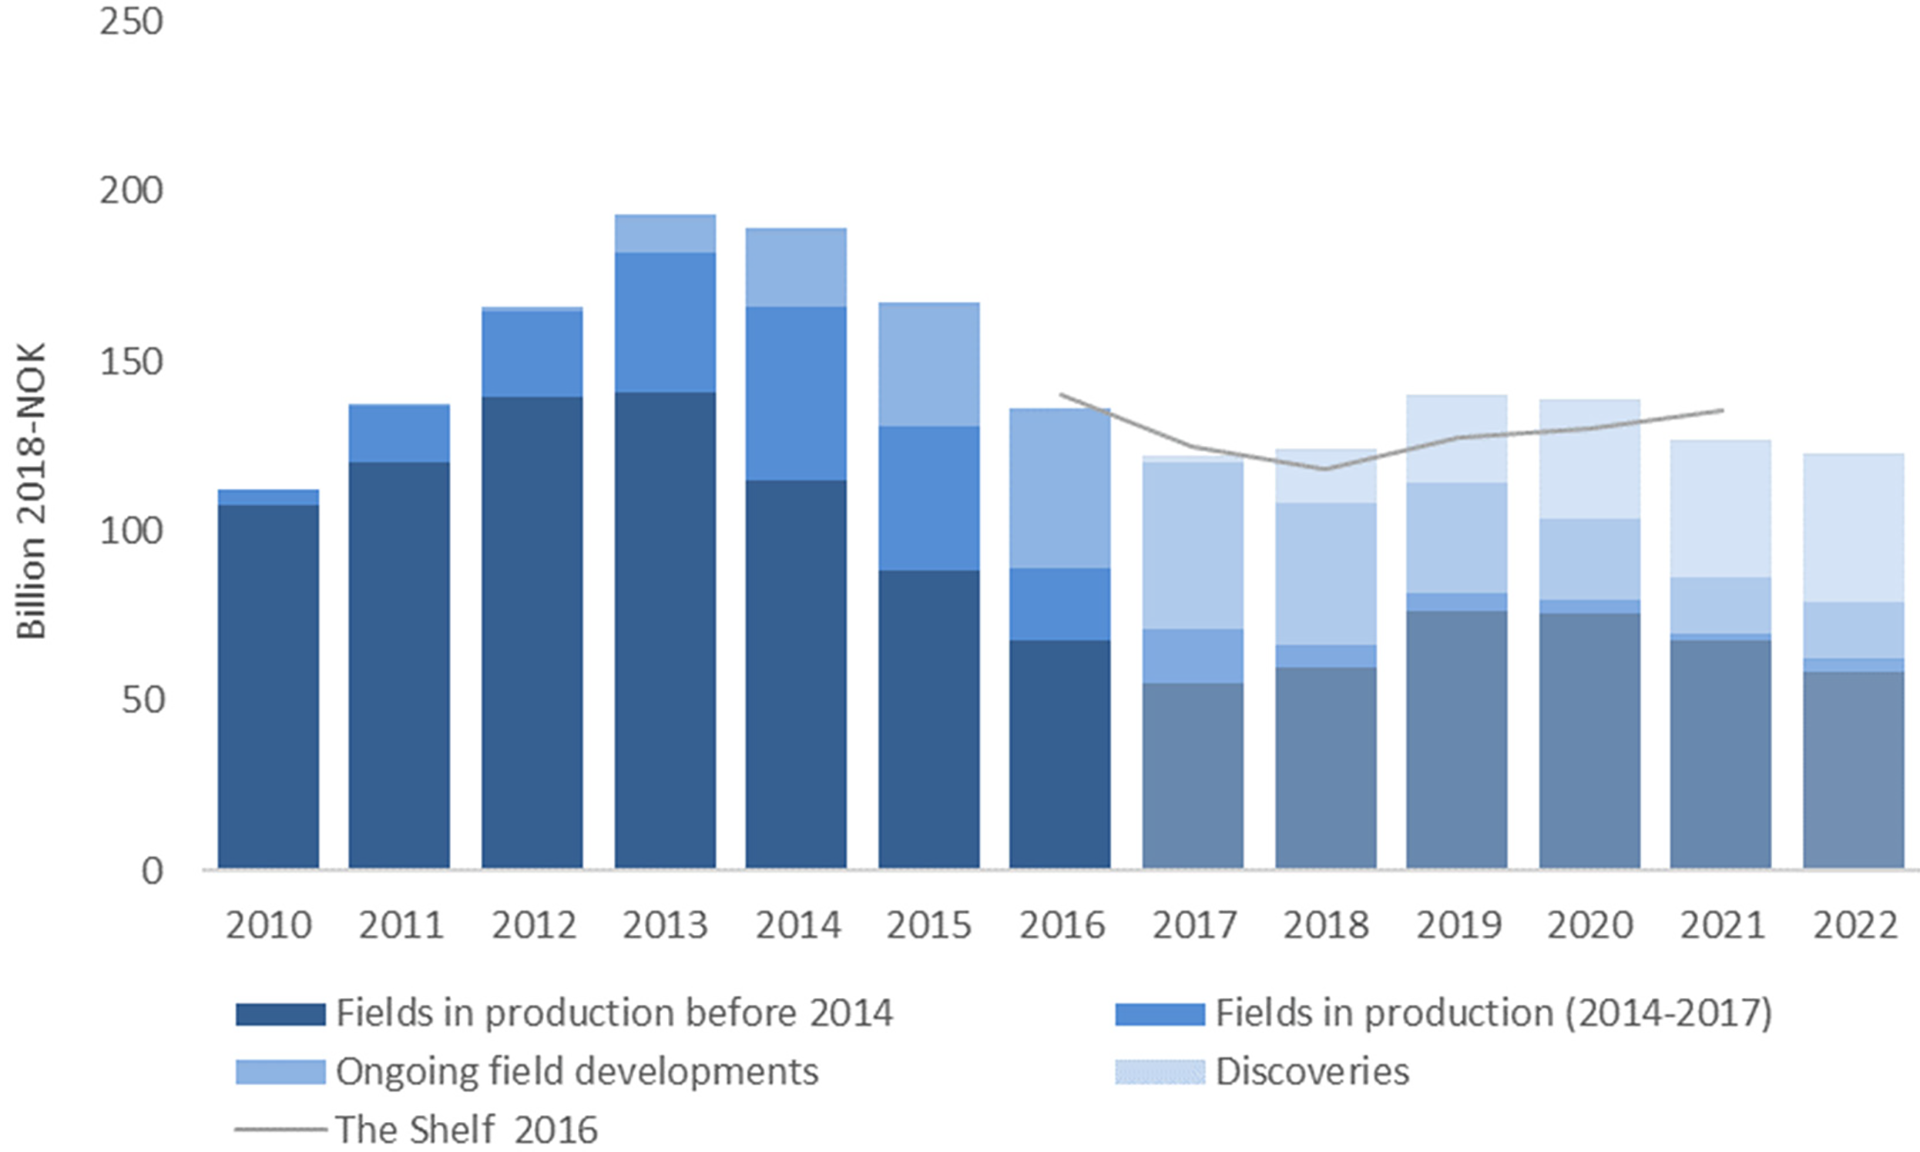
Figure 2‐2
Investments excluding exploration, forecast 2017‐2022*
* Fields in operation are divided into two categories in order to clarify that parts of the investments are linked to completion of field development for fields that have recently started producing (fields that came on stream 2014‐2017).
Investments are expected to rise to just under NOK 140 billion in 2019 and 2020.
Several major development projects will take place on operating fields over the next few years. The Njord upgrade is under way, and the Snorre Expansion will be a subsea development on Snorre. Other major projects on operating fields include the Ærfugl seabed development on Skarv, Valhall West Flank with a new wellhead platform and investments on Troll (phase III). In addition to these projects, drilling activity will generally be high on operating fields over the next few years.
Several ongoing field developments will also contribute significant investments over the next few years; this particularly applies for Johan Sverdrup construction phases I and II. A number of new field developments are also expected to start in 2018 and 2019 (labelled as discoveries in Figure 1‐2), the largest of which is Johan Castberg. These will also contribute substantial investments.
Investments in 2018 and beyond are somewhat higher than the estimate presented in the Shelf in 2016, because of several new projects starting somewhat earlier than what was presumed in 2016.
Whereas investments in new facilities resting on the seabed and floating facilities will decline in the years to come, investments in new seabed facilities will increase. Investment in existing facilities and new development wells are also expected to increase (Figure 2‐3).
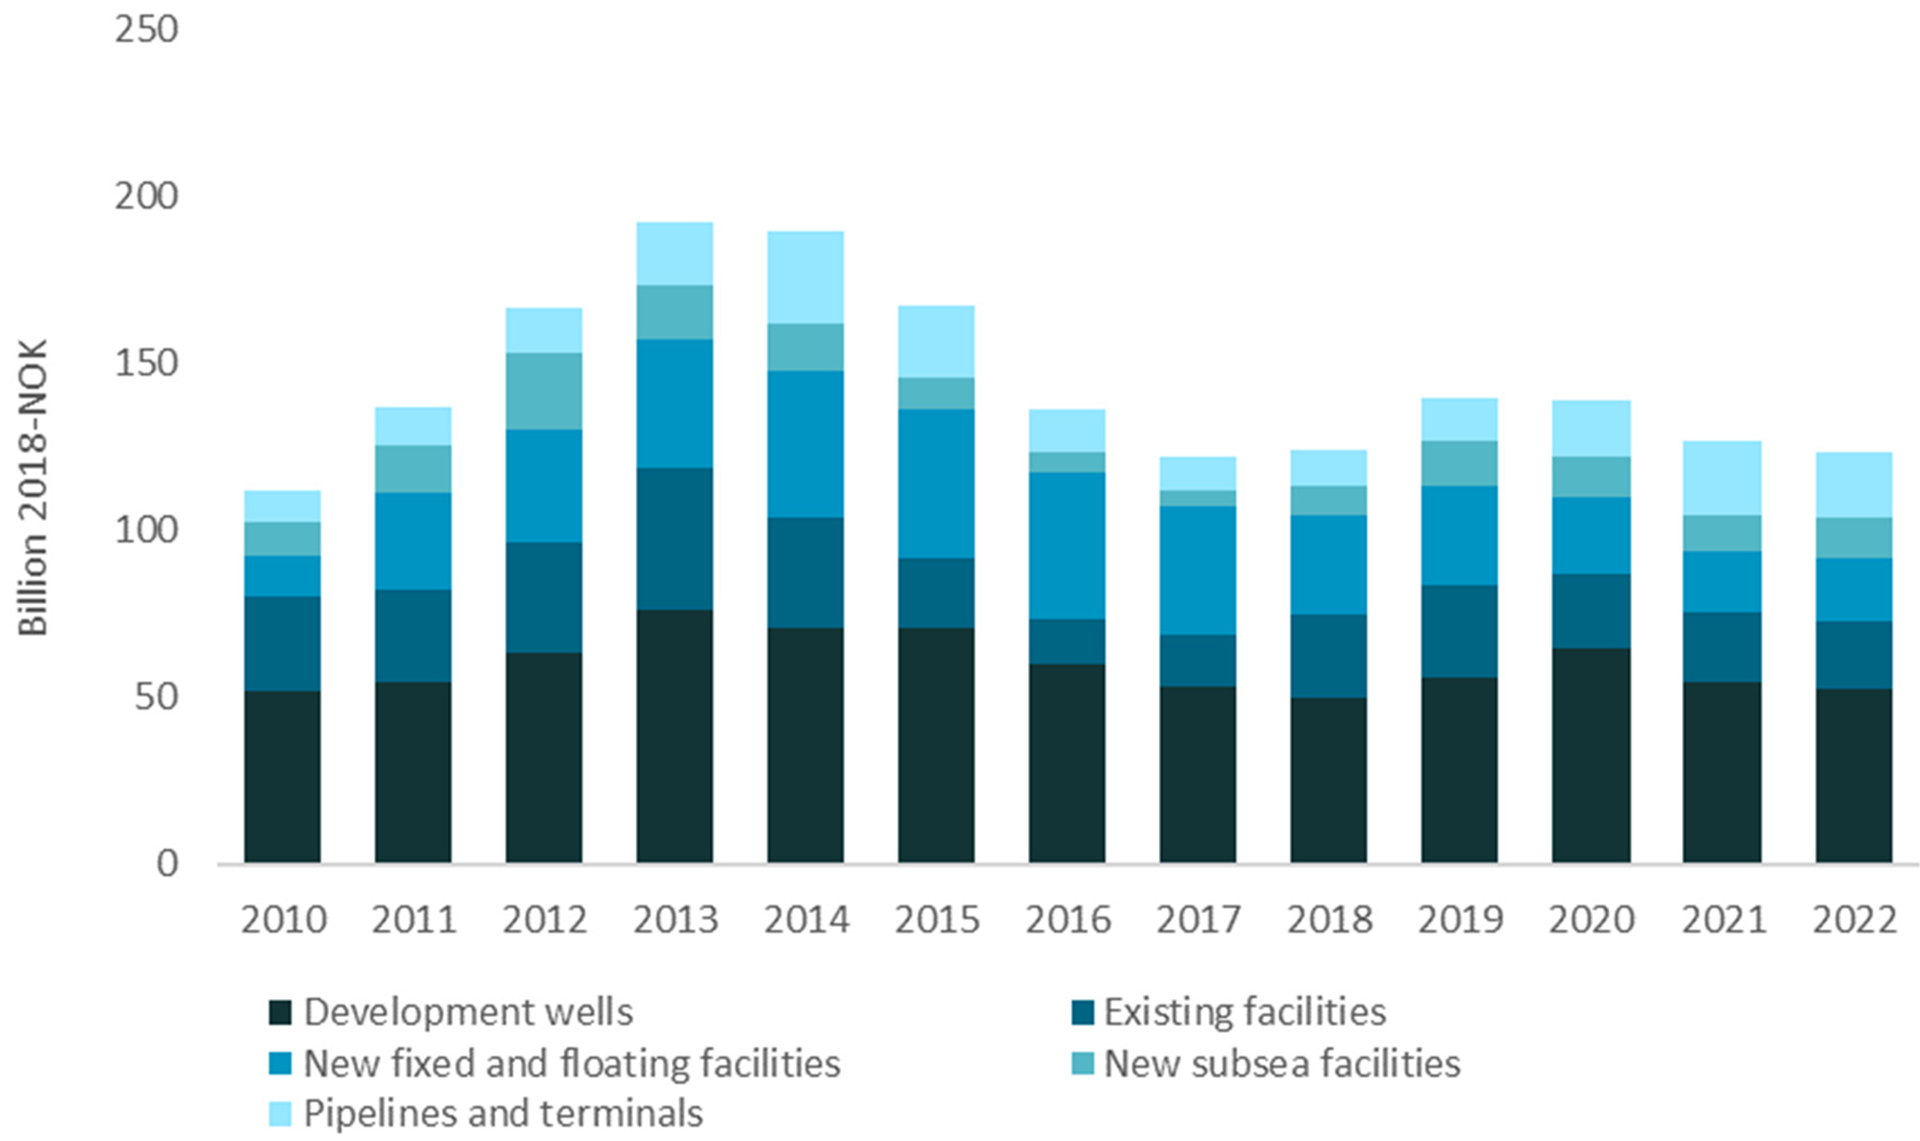
Figure 2‐3
Investments excluding exploration, different investment categories, forecast for 2017‐2022
Seven development plans were submitted for authority approval in December 2017: *Skogul, Fenja, Yme and Johan Castberg as new field developments and Valhall West Flank, Ærfugl (Skarv) and Snorre Expansion as projects on operating fields.
* Development plans were submitted earlier in 2017 for the the Bauge, Njord and Ekofisk 2/4 VC projects.
A number of projects are also expected to be decided over the next few years. This e.g. includes Johan Sverdup construction phase II, Troll phase III and new field developments such as 35/9‐7 (Skarfjell/Nova), 36/7‐4 (Cara), 6407/6‐6 Mikkel South and several discoveries in the area between the Oseberg and Alvheim fields in the North Sea.
The plans submitted to the authorities in the autumn of 2017 and the development projects expected to be submitted in 2018 and 2019 have a total projected investment level of about NOK 240 billion. New facilities and wells constitute the majority of these investments (Figure 2‐4).
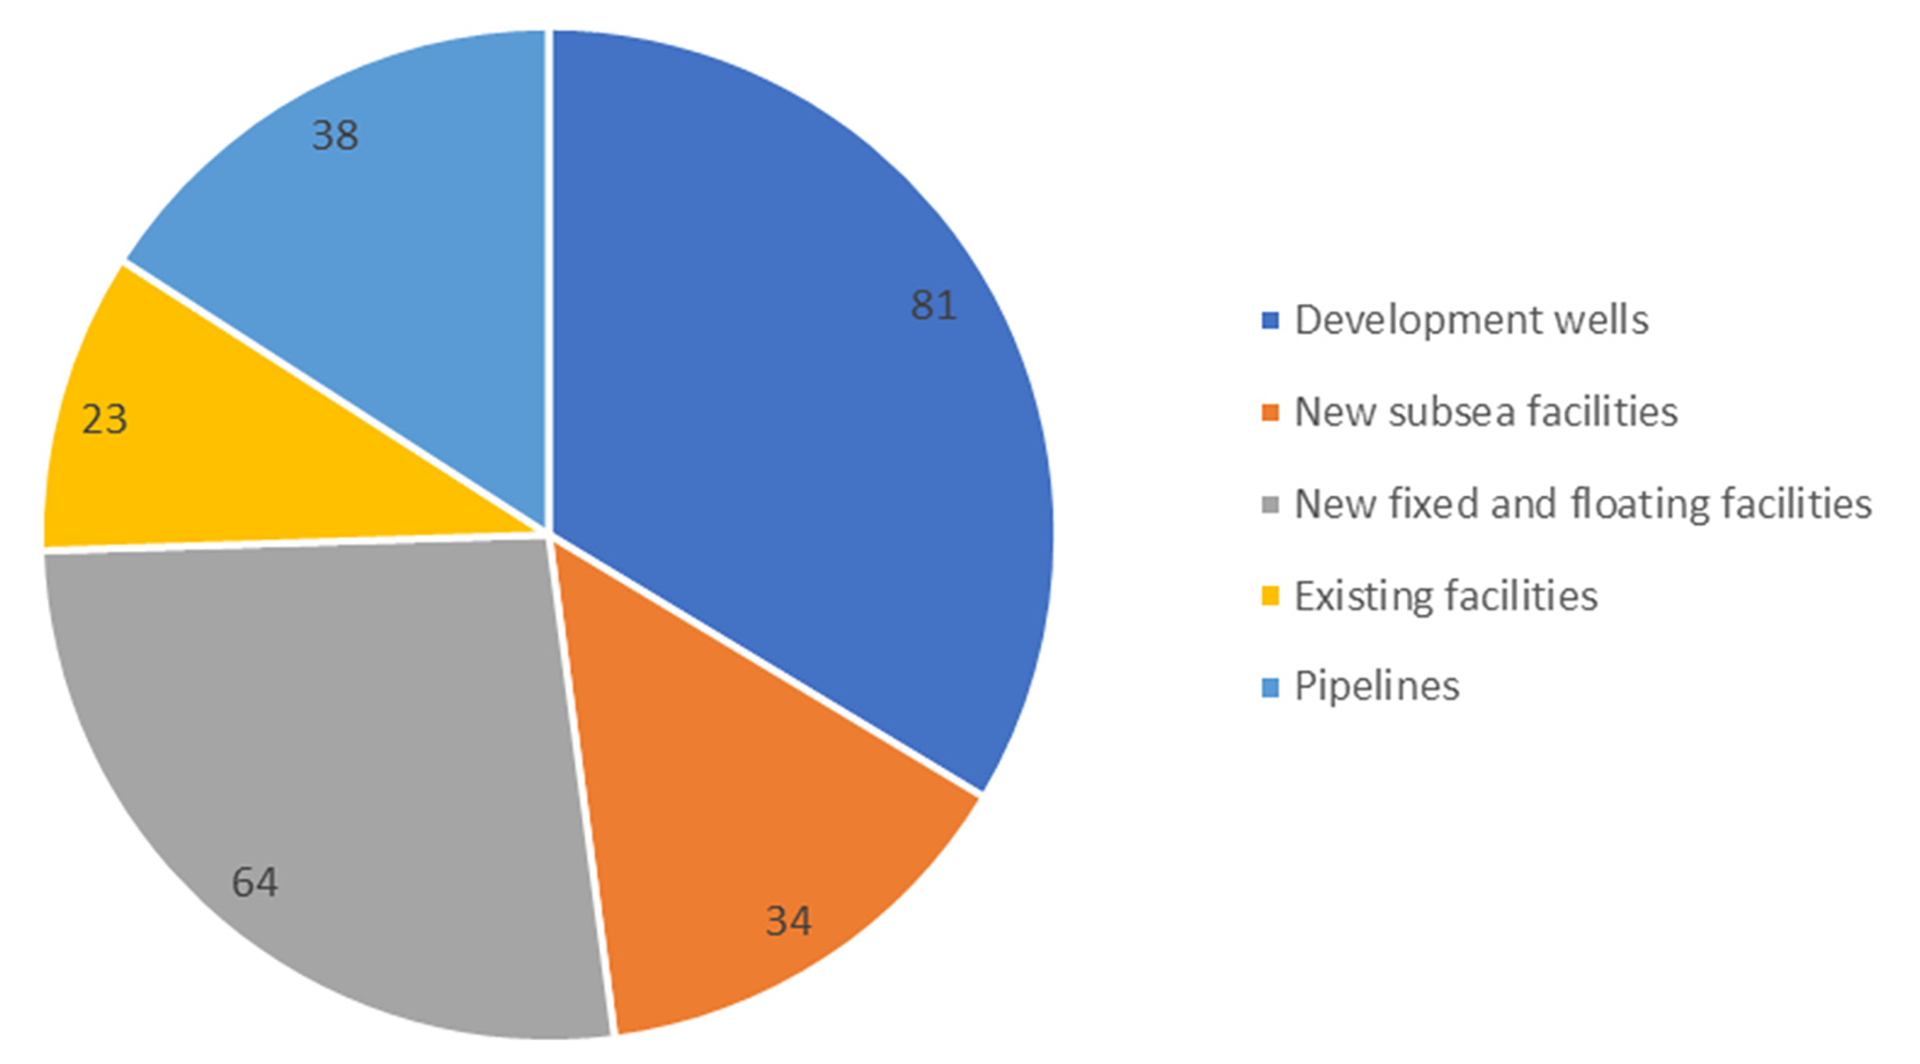
Figure 2‐4
Total investment in new field development projects (NOK billion). Includes projects with submitted plans for development and operations (PDOs) or exceptions from this in December 2017 and anticipated plans for 2018 and 2019.
Development decisions were made for multiple discoveries between 2010 and 2014, including older discoveries. The number of new discoveries has also declined in recent years. If new, major discoveries are not made relatively quickly in mature areas, where the lead time from discovery to development decision can be short, the lack of new developments will eventually result in falling investments over time. This also applies to operating fields. A number of major field projects will be carried out over the next few years, but there are few new, major projects being considered. With a study phase lasting several years from feasibility study to investment decision, this could mean less development activity on operating fields.
Exploration costs
There was a minor reduction in exploration costs from 2016 to 2017. Thirty‐six exploration wells were spudded in 2017 with overall costs of about NOK 19 billion (Figure 2‐5).* In comparison, 36 exploration wells were also spudded in 2016, and exploration costs totalled NOK 22 billion. Based on the companies' plans, we expect the number of spudded exploration wells in 2018 to remain at about the same level as 2017. Over the next few years, we have presumed gradual growth in the number of exploration wells and associated costs. This is based on the assumption of increased exploration profitability linked to developments in costs and the price of oil.
*Exploration costs include both company and licence‐related exploration costs, cf. Figure 2‐5. Company‐related exploration costs are often incurred before the production licence is awarded, for example costs for purchasing and interpreting seismic data. However, the majority of exploration costs are incurred after the production licence is awarded. Of these, drilling of exploration wells is the dominant item.
The average cost per exploration well was around NOK 240 million in 2017, which is about half the cost per well compared with 2013/2014. This change provides a rough estimate of the cost level reduction, although the composition of exploration wells may have changed somewhat. Well length is very important for the cost of an exploration well, and changes in average well length will therefore affect the cost per exploration well.
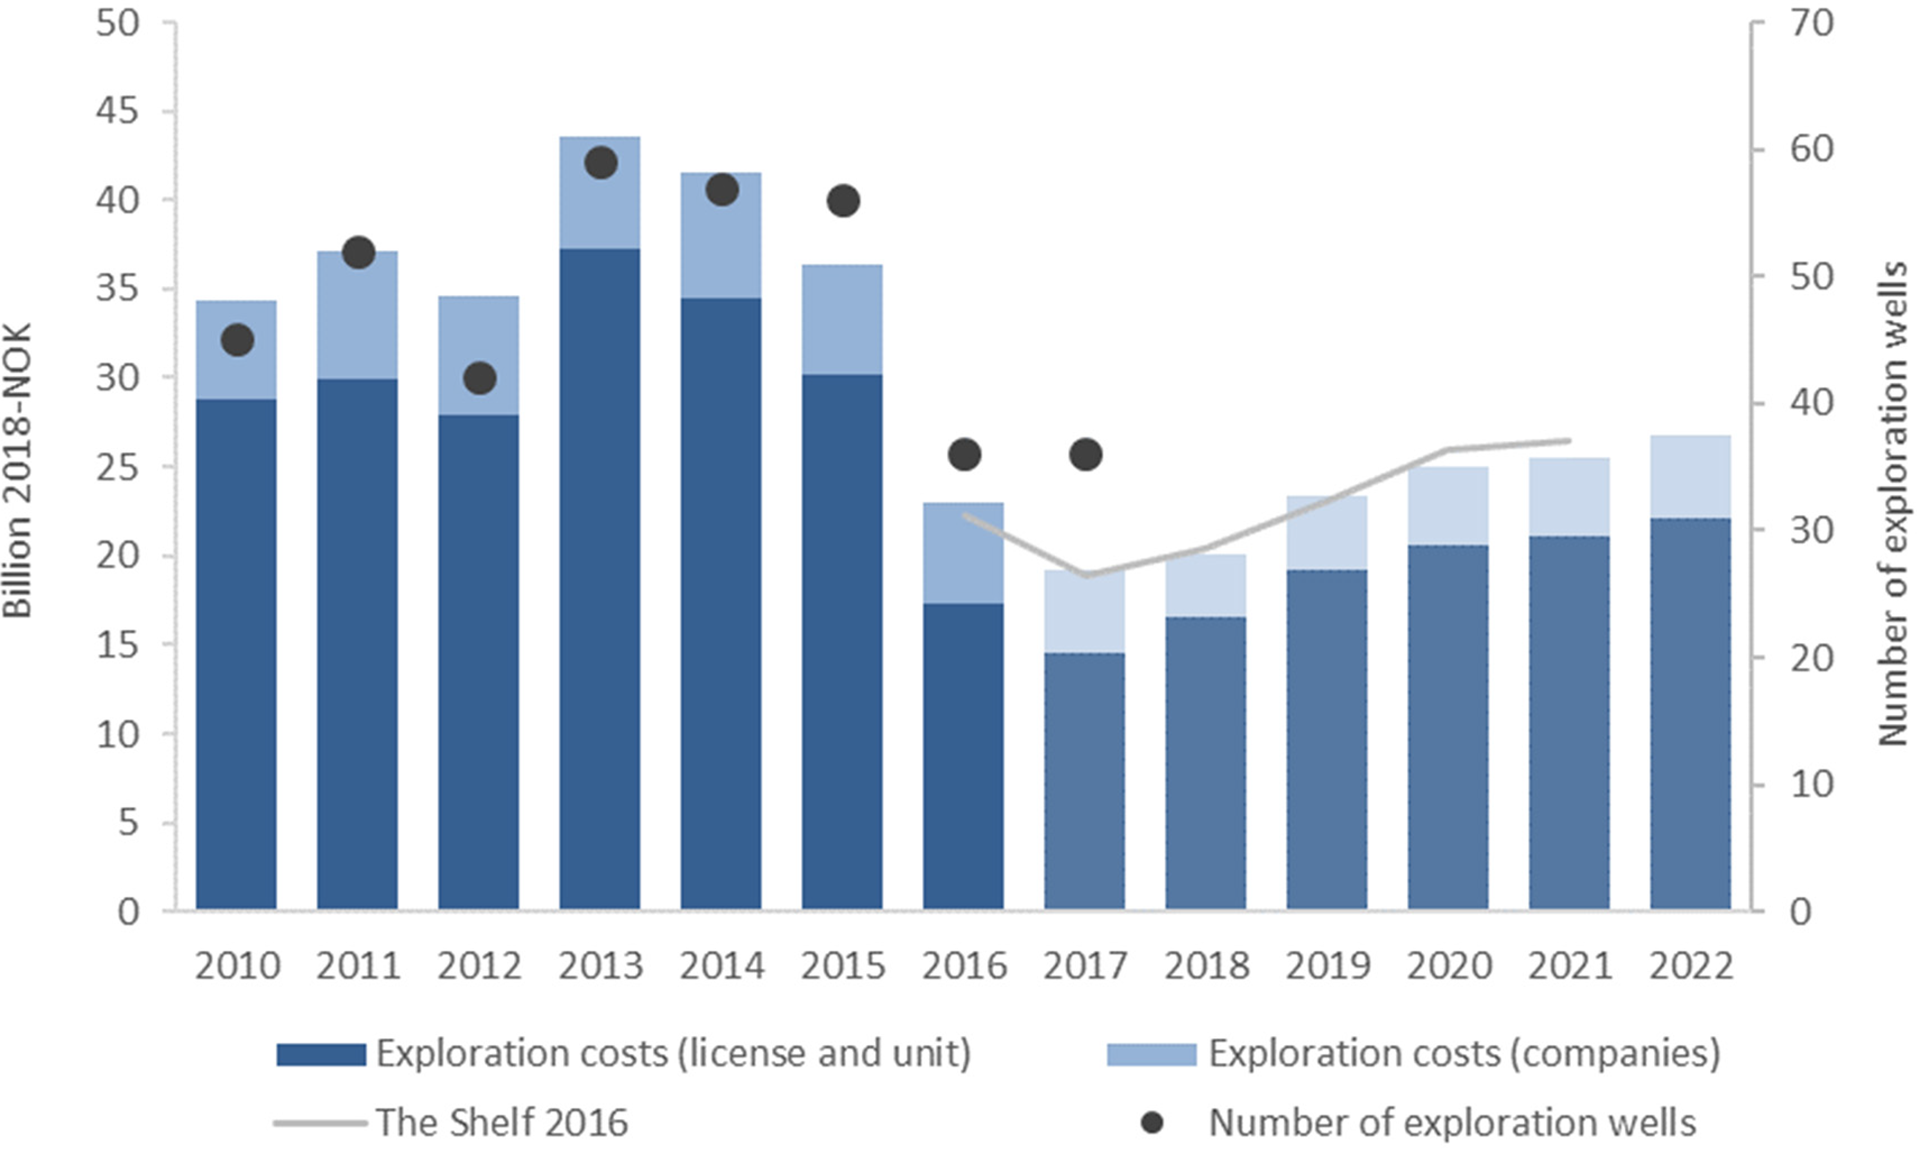
Figure 2‐5
Estimated exploration costs, forecast 2017‐2022
Operating costs
85 fields were in production at the end of 2017. This is in addition to the operation of pipelines and onshore facilities. The total operating costs were NOK 52 billion in 2017. After a period of reduction, operating costs are now expected to level off and then gradually increase. This is primarily due to new fields starting production.
Compared with the projection in the Shelf in 2016, the new projection is somewhat lower than the estimated level from 2020 (Figure 2‐6). This is due to both a lower estimate for operating costs on operating fields and a reduced operating cost estimate for new fields.
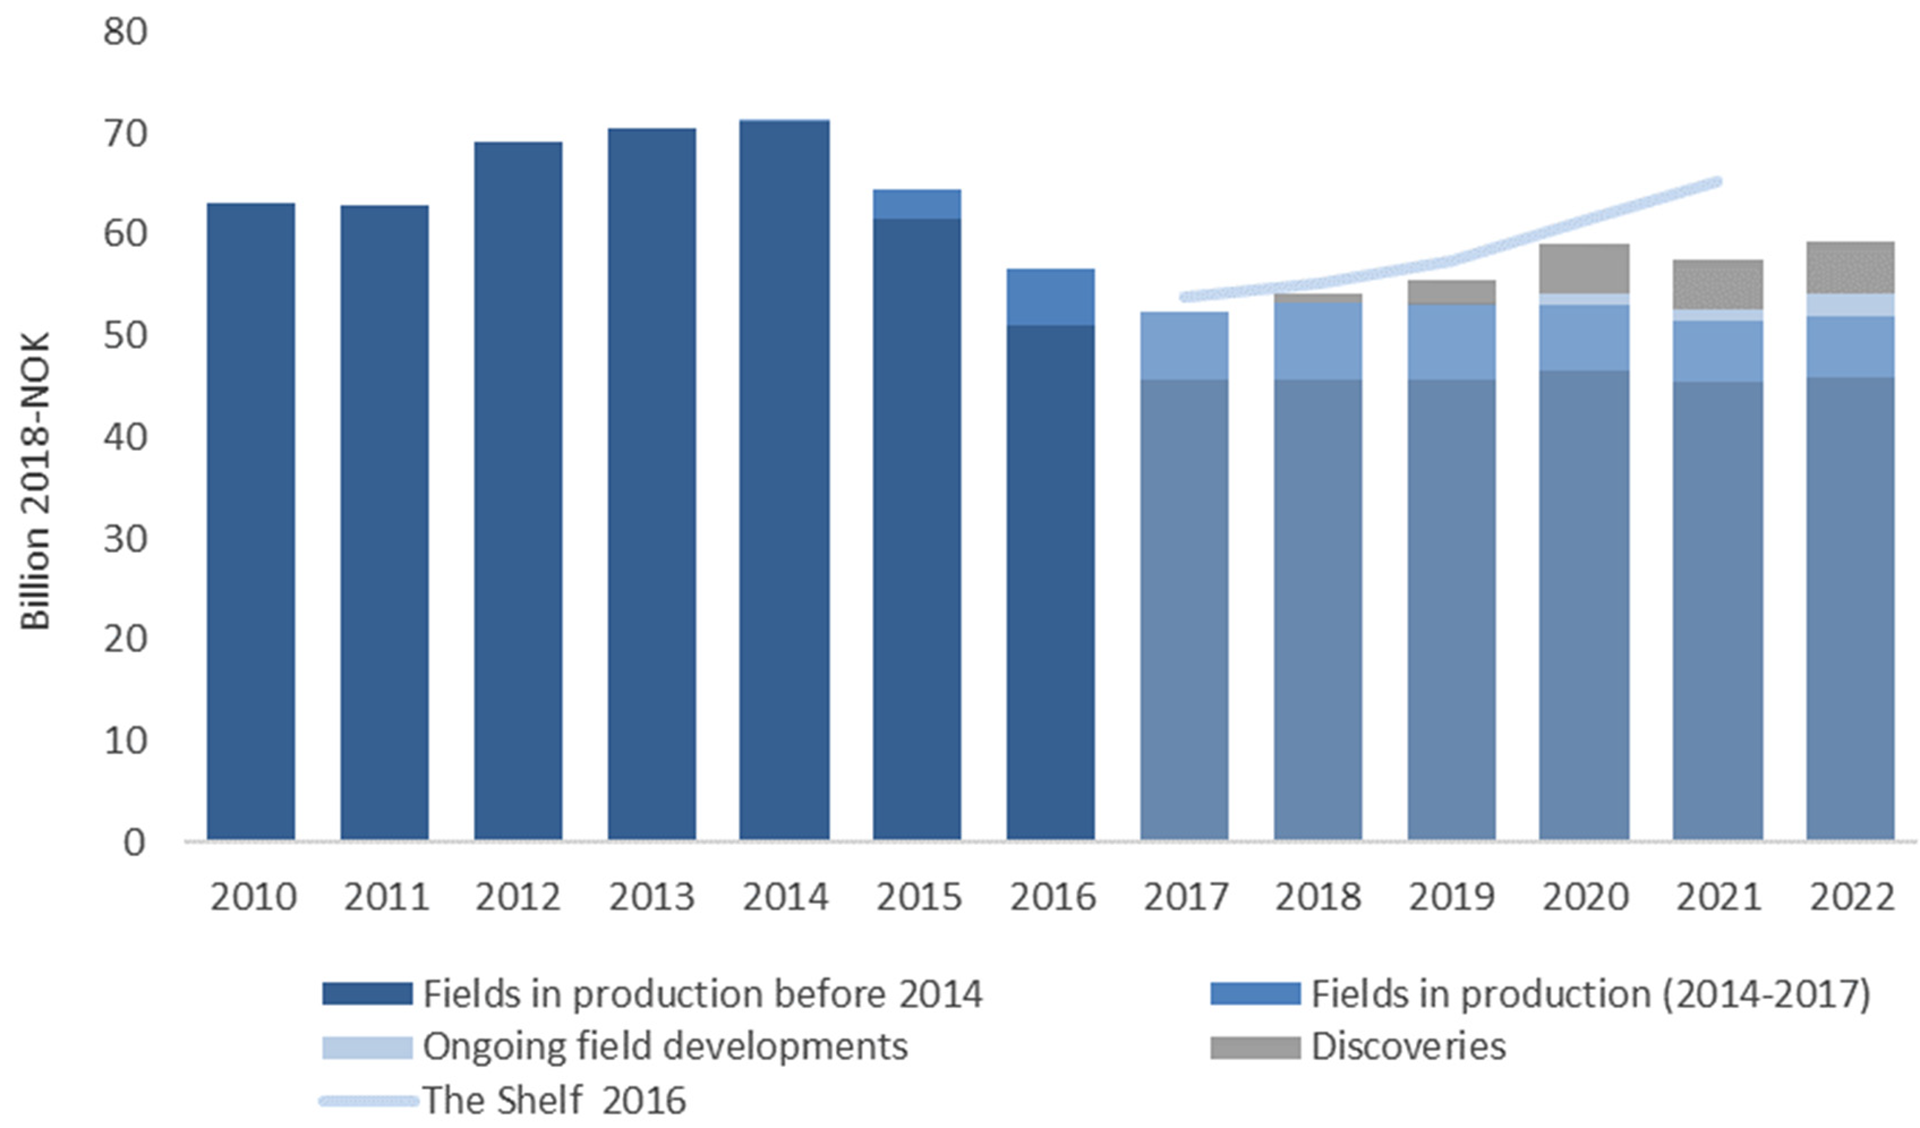
Figure 2‐6
Operating cost specified by field status, forecast 2017‐2022
Overall cost development estimate
Figure 2‐7 shows the overall estimate for operating costs, investments, exploration costs, shutdown and disposal costs, as well as other costs. The Other costs category includes certain smaller items, such as concept studies and preparing for operations.
Overall costs in 2017 totalled about NOK 210 billion. As a result of increased estimates for investments and exploration costs, the overall costs will increase from 2018 to 2020. In comparison, overall costs in 2014 totalled NOK 325 billion.
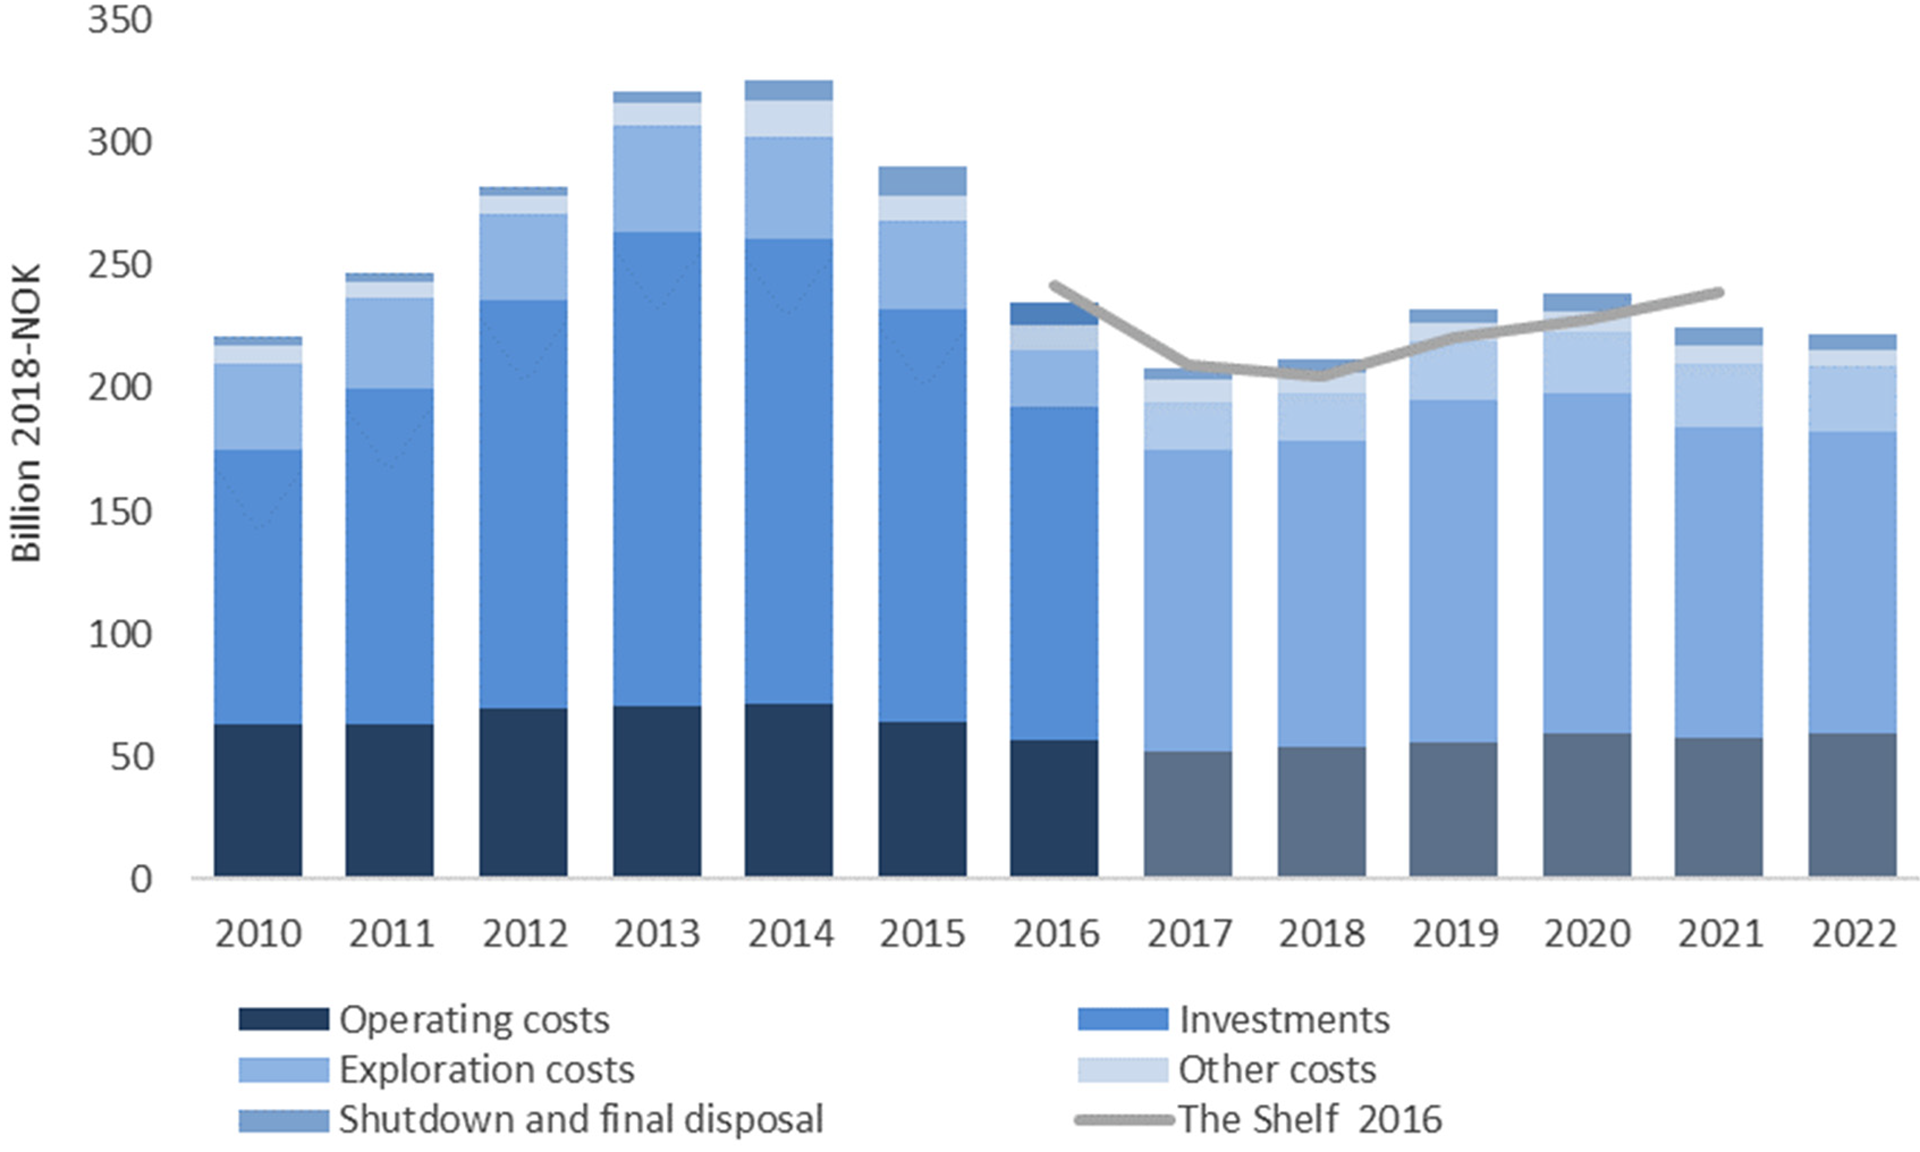
Figure 2‐7
Overall costs, forecast 2017‐2022
The reason that cost projections for the next few years are somewhat higher than the projections given last year, is quicker start‐up of new development projects and thus higher investments than presumed in the Shelf in 2016.