Production figures November 2024

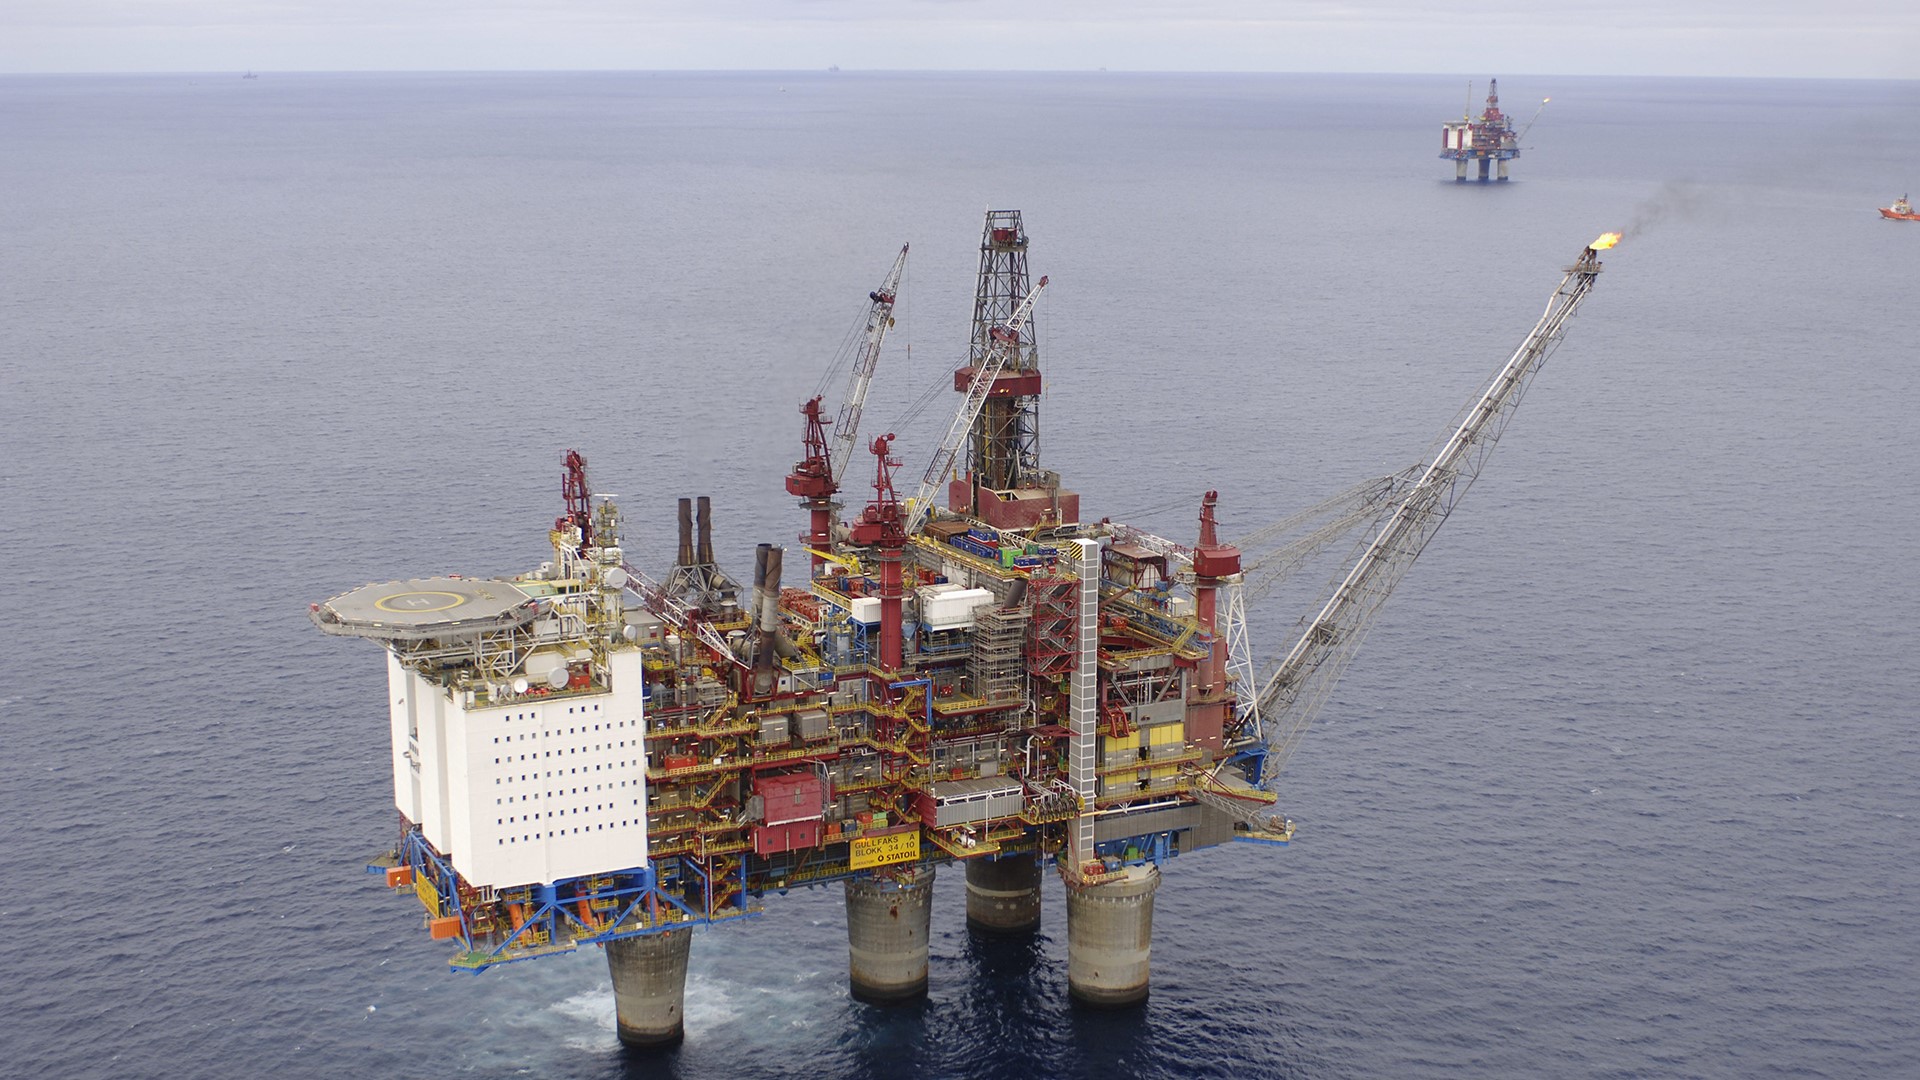
The Gullfaks field is one of the fields that contributes to oil and gas production on the Norwegian continental shelf. Gullfaks A is seen in the foreground. (Photo: Øyvind Hagen/Equinor)
20/12/2024 Preliminary production figures for November 2024 show an average daily production of 1 975 000 barrels of oil, NGL and condensate.
Total gas sales were 10.8 billion Sm3 (GSm3), which is 0.2 (GSm3) more than the previous month.
Average daily liquids production in November was: 1 774 000 barrels of oil, 221 000 barrels of NGL and 18 000 barrels of condensate.
Production figures November 2024
| Oil mill bbl/day |
Sum liquid mill bbl/day |
Gas MSm³/day |
Total MSm³ o.e/day |
||
|---|---|---|---|---|---|
| Production | November 2024 | 1.729 | 1.971 | 360.8 | 0.674 |
| Forecast for | November 2024 | 1.682 | 1.934 | 349.5 | 0.657 |
| Deviation from forecast | 0.047 | 0.037 | 11.3 | 0.017 | |
| Deviation from forecaset in % | 2.8 % | 1.9 % | 3.2 % | 2.6 % | |
| Production | October 2024 | 1.781 | 2.000 | 341.9 | 0.660 |
| Deviation from | October 2024 | -0.052 | -0.029 | 18.9 | 0.014 |
| Deviation in % from | October 2024 | -2.9 % | -1.4 % | 5.5 % | 2.1 % |
| Production | November 2023 | 1.805 | 2.045 | 365 | 0.690 |
| Deviation from | November 2023 | -0.076 | -0.074 | -4.2 | -0.016 |
| Deviation in % from | November 2023 | -4.2 % | -3.6 % | -1.2 % | -2.3 % |
Oil production November 2024
Liquid production November 2024
Gas production November 2024
Director Communication, public affairs and emergency response
Updated: 20/12/2024