Resource evaluation
As mentioned above, the NPD has conducted shallow stratigraphic drilling in the area and the evaluation of these boreholes is continuing. They lie a very considerable distance from exploration wells in the southern Barents Sea. Many parameters used in the resource estimates are therefore highly uncertain. Future exploration drilling in Barents Sea South and in the Russian sector, and more detailed mapping in Barents Sea North, could change the view of expected volume and fluid parameters. In addition to reducing the uncertainty range (see the fact box) for the parameters, future well results will say something about the probability of finding petroleum in the various reservoir levels.
Uncertainty range |
|
Expected value: The average value. This is generally defined as the arithmetic mean of all the outcomes in the statistical distribution. It is much used, and has the property that the expected value for various distributions can be summed to give a sum of distributions. Uncertainty: Expresses the range of possible outcomes or results. This can be described in many ways, most often with the aid of a low and a high estimate. Uncertainty is usually calculated using statistical methods, such as Monte Carlo simulations. High and low uncertainties can then be described with the aid of statistical concepts. Where undiscovered resources are concerned, the NPD generally uses P95 for the low estimate. This means that, given the assumptions applied in the analysis, the probability of a result equal to or larger than the P95 value is 95 per cent. P5 is used for the high estimate, which means a five per cent probability that the result will be equal to or larger than the P5 value. |
Based on the play analysis described above, expected recoverable resources for the evaluated area of Barents Sea North are calculated to be 1 370 million scm oe. The geological uncertainty in this large and still less evaluated area is reflected by the spread of the resource estimate, from a low of 350 million scm oe (P95) to a high of 2 460 million scm oe (P05). Expected recoverable resources break down into 825 million scm of fluids and 545 billion scm of gas (figure 35).

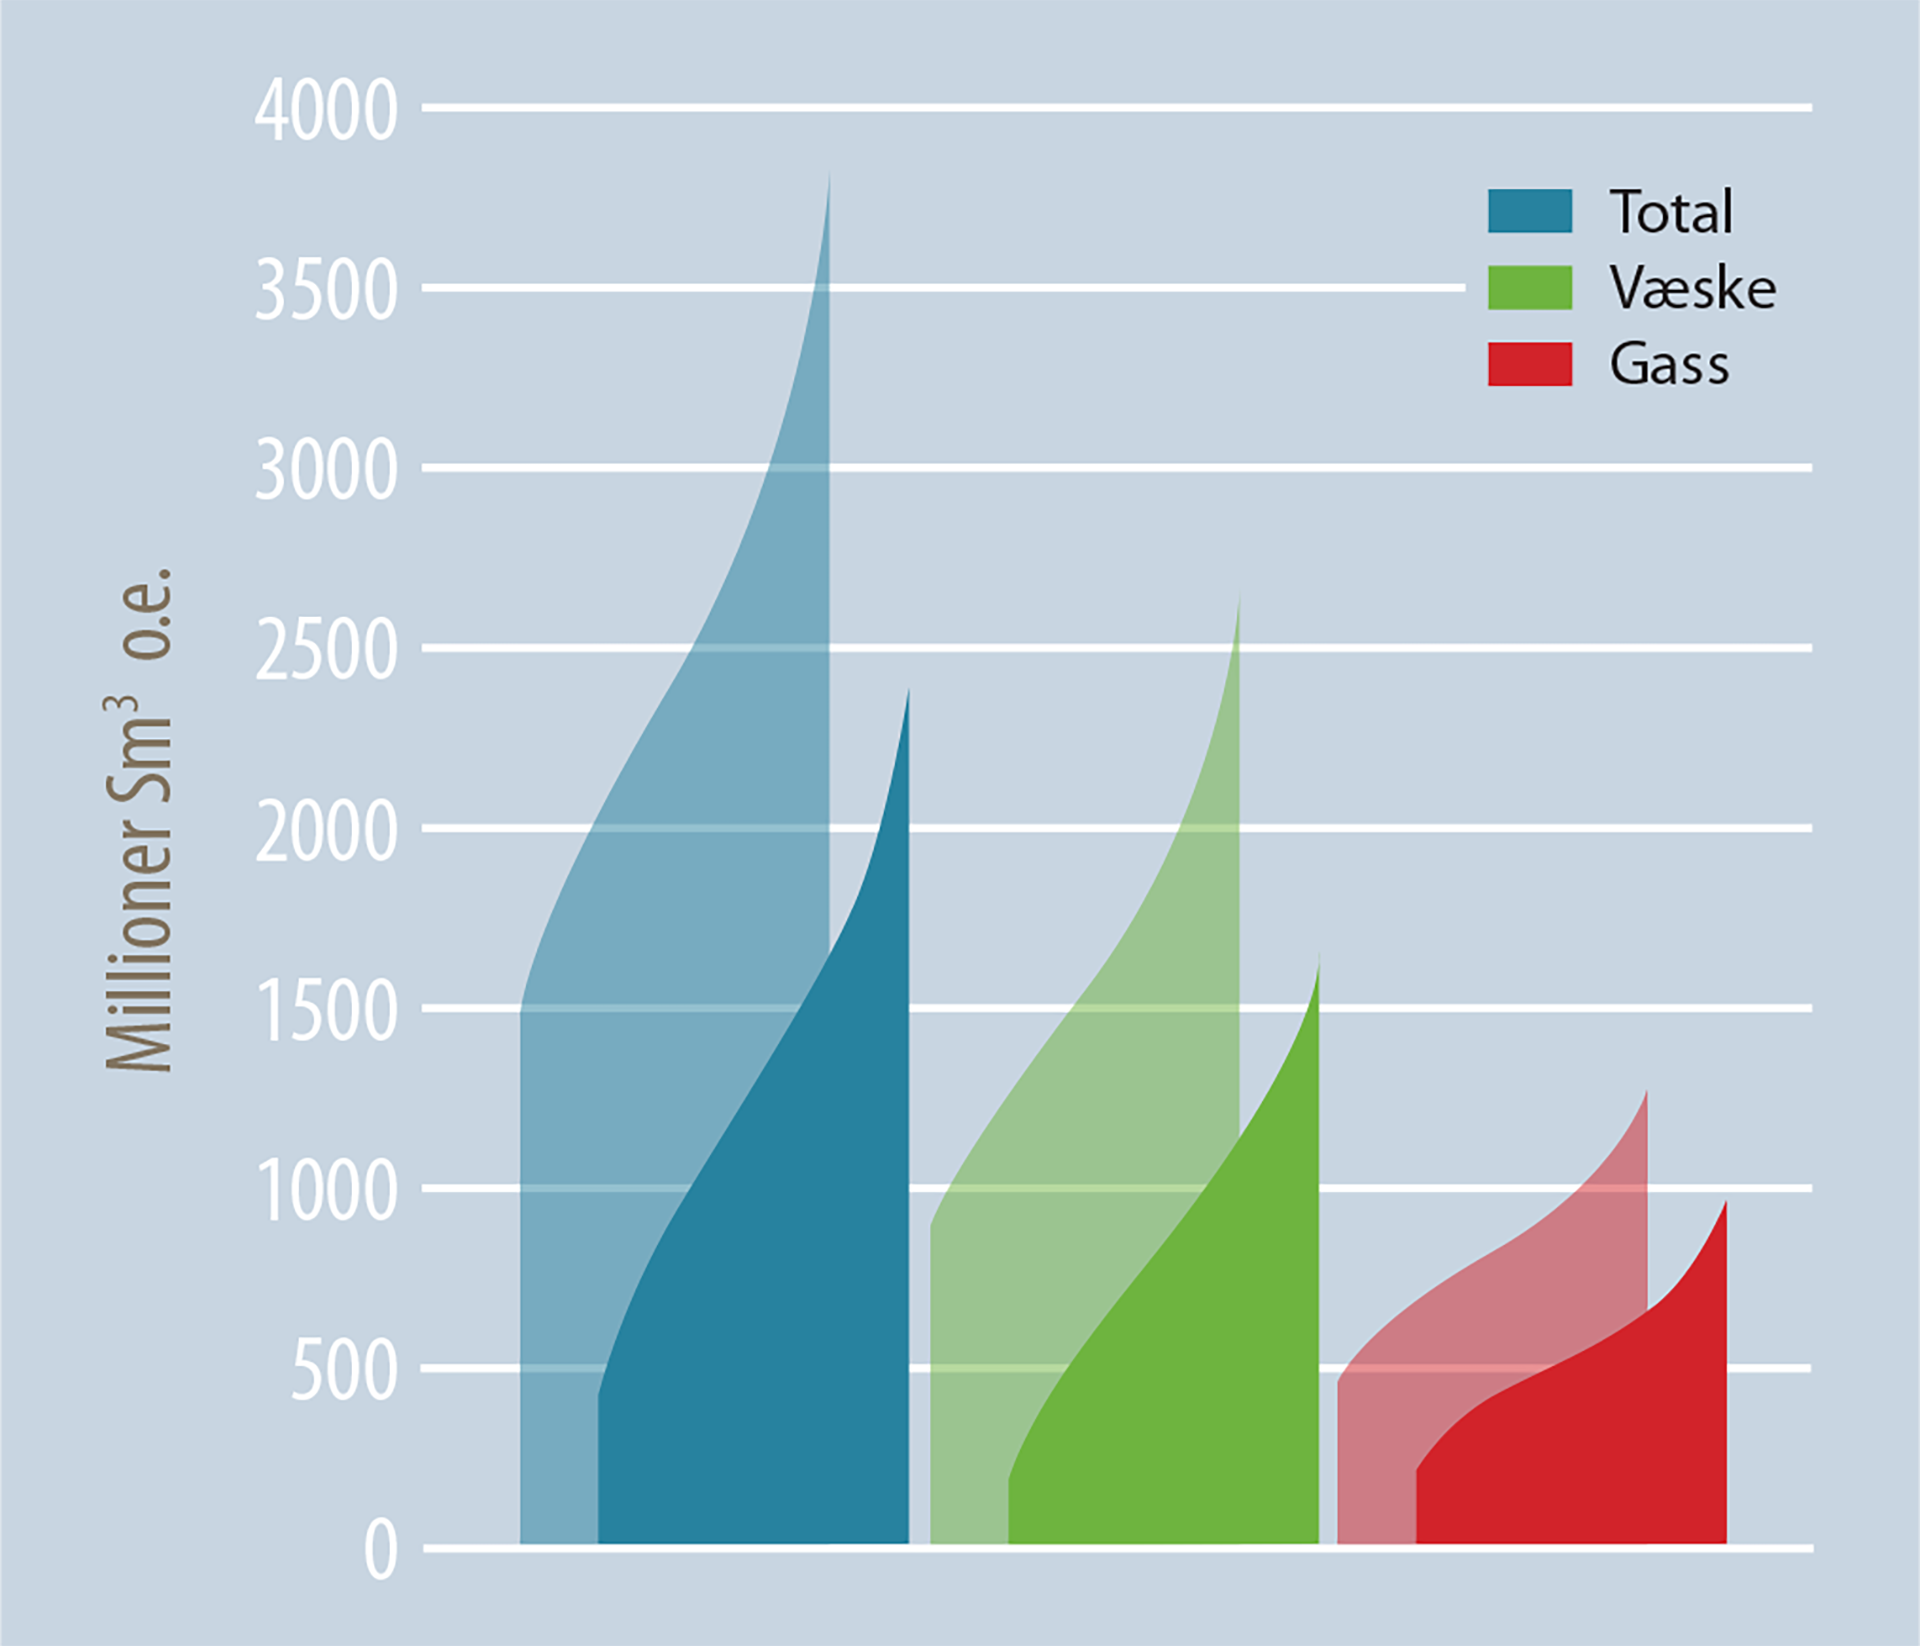
Figure 35.
Expected (mean) recoverable resources.

Figure 36.
Uncertainty range for the estimated resources. Rear column: in place. Front column: recoverable.
The balance between oil and gas differs from that in Barents Sea South. While the estimate for the latter area assigns the biggest volume potential to gas (60 per cent), fluid resources are expected to form the greater part in Barents Sea North (60 per cent). Much of this reflects the higher probability of oil-generating source rocks at favourable depths (the Steinkobbe/ Botneheia Formation) which could generate a substantial volume. At the same time, the big uncertainty range in the estimates shows that knowledge of the area is limited.

Figure 37.
Total recoverable resources by geological epoch.
Mapping identified a number of large structural traps in all the plays. The number of these and the geological properties of the plays mean that the contribution to resources differs between the various plays (figure 38).

Figure 38
presents the cumulative distribution of the recoverable resources, where the contributions from the various geological epochs/ periods (the Triassic plays have been merged) emerges clearly.
The results show that the plays with Triassic reservoirs make the biggest contribution to the resource potential, with no less than 56 per cent of the area’s overall recoverable resources (figure 37). This particularly reflects the probability of discovering oil in the Triassic plays.
Furthermore, the estimates show that only three per cent of total recoverable resources are expected to lie in Early Carboniferous reservoirs (figure 37). This is both because the reservoir properties are expected to be challenging, and because the probability of success is low.
Jurassic reservoirs contribute 18 per cent of the total recoverable resources. While reservoir properties here are expected to be good, great uncertainty prevails about the retention of hydrocarbons over time because reservoirs lie at shallow depths.
Upper Carboniferous-Permian carbonates contribute 23 per cent, but reservoir quality in particular could be challenging. Nevertheless, secondary porosity could have helped to preserve reservoir quality.

Figure 39
presents the changes in expected value (mean) for recoverable undiscovered resources in the Barents Sea overall – in other words, the expectation in 2016 and its size in May 2017 after including the results for eastern parts of Barents Sea North. As can be seen, including the latter area leads to a virtual doubling (up 80 per cent) in the resources.
SCENARIO X
In addition to the analyses presented above, the NPD has developed a scenario X. This reflects the great uncertainty over the resource outcome in an unopened area, and the possibility that the outcome will be at the extreme end of the NPD’s resource distribution. In this scenario, an exploration well is drilled. Its results confirm the play with the biggest resource potential (Olenekian, Anisian and Ladinian). The result also lead the expectations to increase for the rock volume in this play. Because of the dependence of the Carnian-Norian and Jurassic plays on this source, the play probability rises for these.
The scenario illustrates a possible outcome which should be included in the assessment of the possible consequences of opening the areas for exploration activity. As figure 40 shows, the scenario produces a big change in the resource distribution. That includes an increase in the expected value of the total estimated recoverable resources from 1 370 million scm oe to 2 500 million. Corresponding rises can be seen in the changes to the fluid and gas distributions.