Discoveries
At 31 December 2018, there were 85 discoveries where the licensees have yet to submit a PDO to the government. These contain total recoverable resources of 660 million scm oe, and represent 15 per cent of remaining discovered petroleum resources.
Resources in discoveries
Resources in the discovery portfolio break down into 360 million scm of liquids (oil, natural gas liquids (NGL) and condensate) and 300 billion scm of gas. The total investment required to develop the whole portfolio is estimated to be in the order of NOK 400 billion in 2018 value. Developments are either in the clarification phase (RC 4), likely but unclarified (RC 5) or not evaluated (RC 7). Figure 1.1 presents the portfolio by development status in resource classes (RCs).

Figure 1.1 Discovery portfolio by volume and development status.
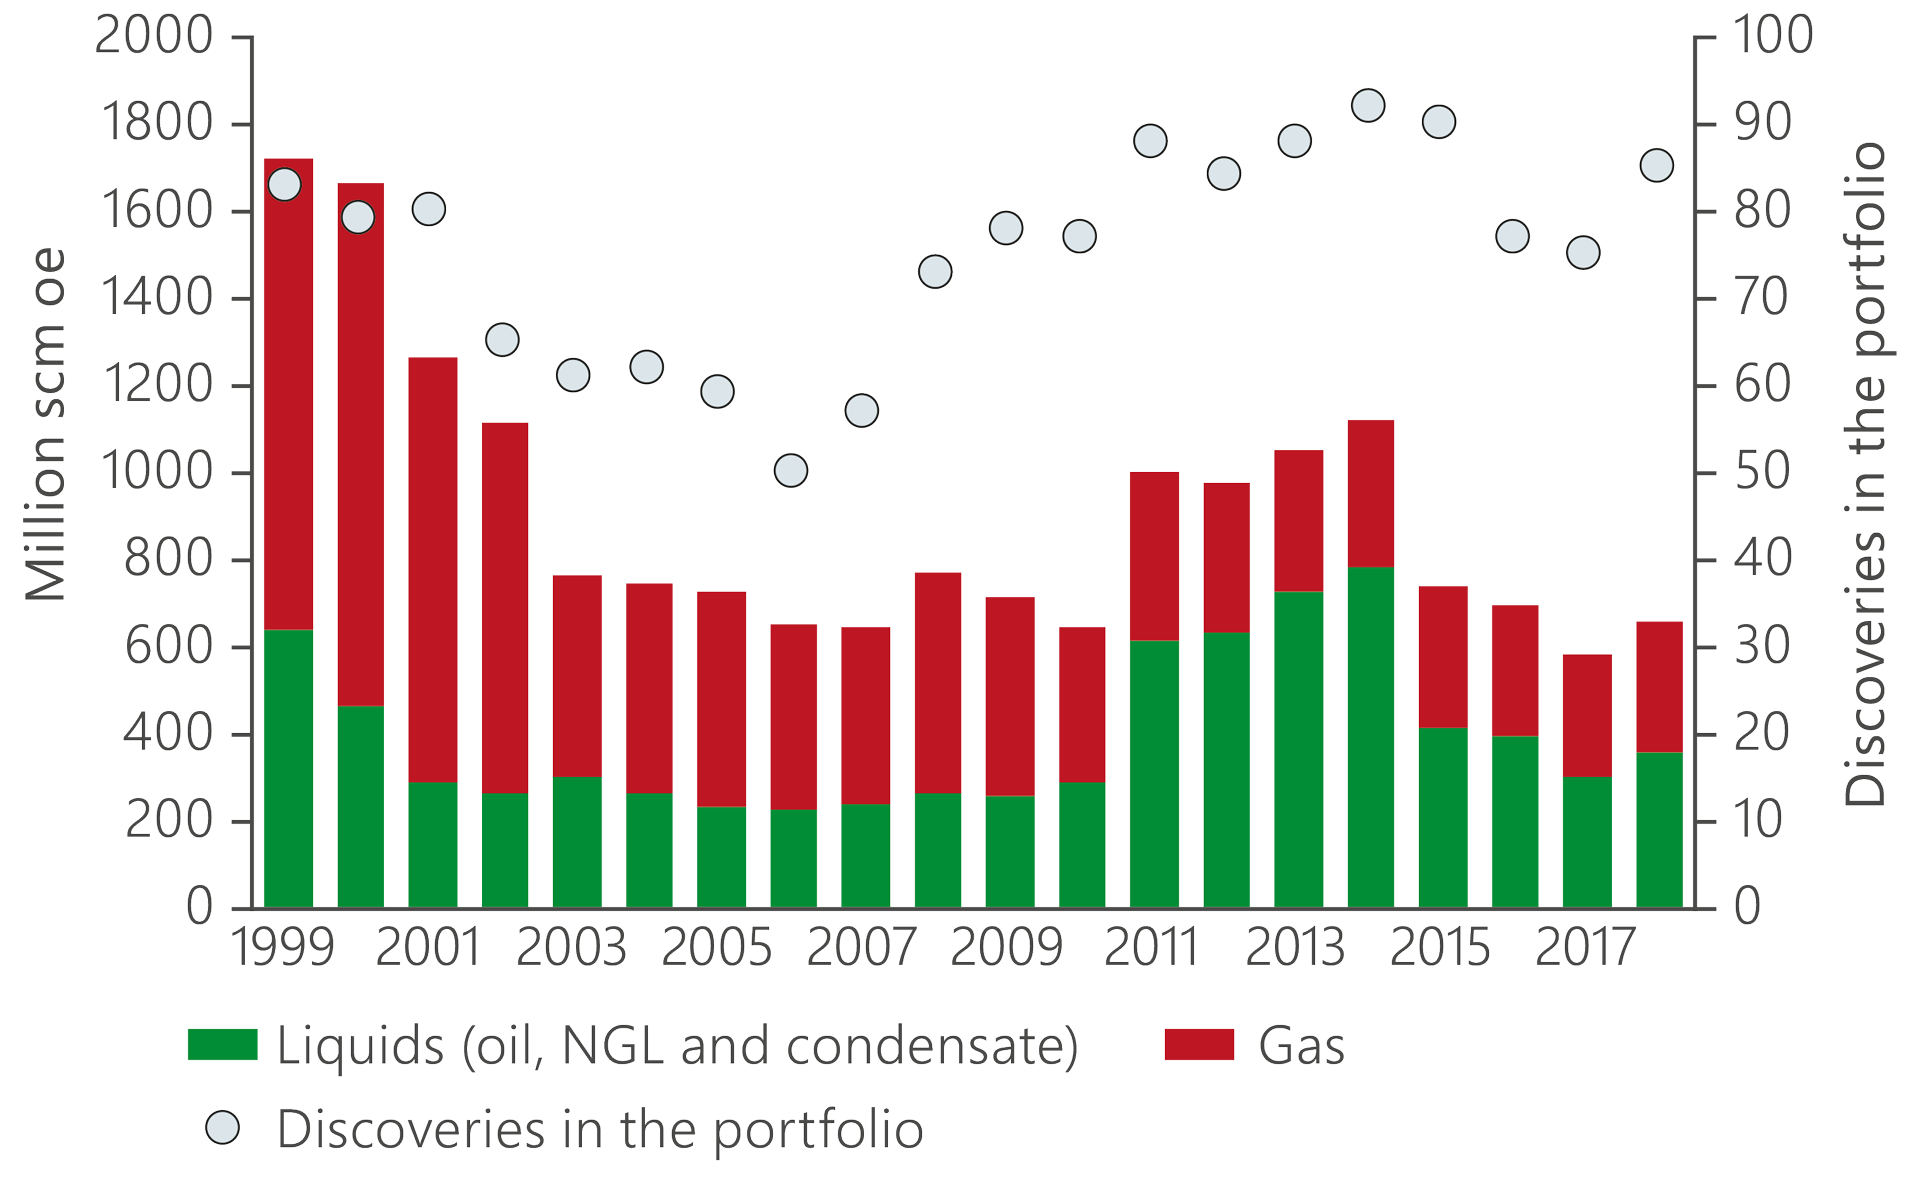
The number of discoveries in the portfolio at 31 December 2018 was about the same as in 1999. However, their average size had declined over the same period from 20.8 to 7.8 million scm of recoverable oe. This is because more of the big discoveries have been developed, while new additions to the portfolio are by and large smaller than before. Figure 1.2 shows how the number of discoveries and volume estimates in the portfolio have developed since 1999.

Figure 1.2 Development of resources and numbers of finds in the discovery portfolio from 1999 to 20181
When discoveries in the portfolio diminish in size, the industry must find solutions which make developments profitable with a smaller resource base. This has so far been successful. More discoveries are being developed and the level of activity on the NCS is high, while technology and profitable solutions for development and production are being created for ever smaller discoveries. Figure 1.3 shows the average size of approved new developments and their total number by decade.

Figure 1.3 Average size at first PDO and number of approved development plans.
Figure 1.4 presents the number of discoveries and resources in the discovery portfolio by the number of years since they were found. Most discoveries in the present portfolio have been made during the past 20 years.
 Figure 1.4 Discoveries and resources in the portfolio by years since discovery.
New discoveries are crucial for maintaining a high level of production in the long term. Many exploration wells have been drilled in 2019. At 31 August, 32 of them had been completed and 10 discoveries made. The level of exploration activity is also expected to remain high next year.
Resources in discoveries by sea area
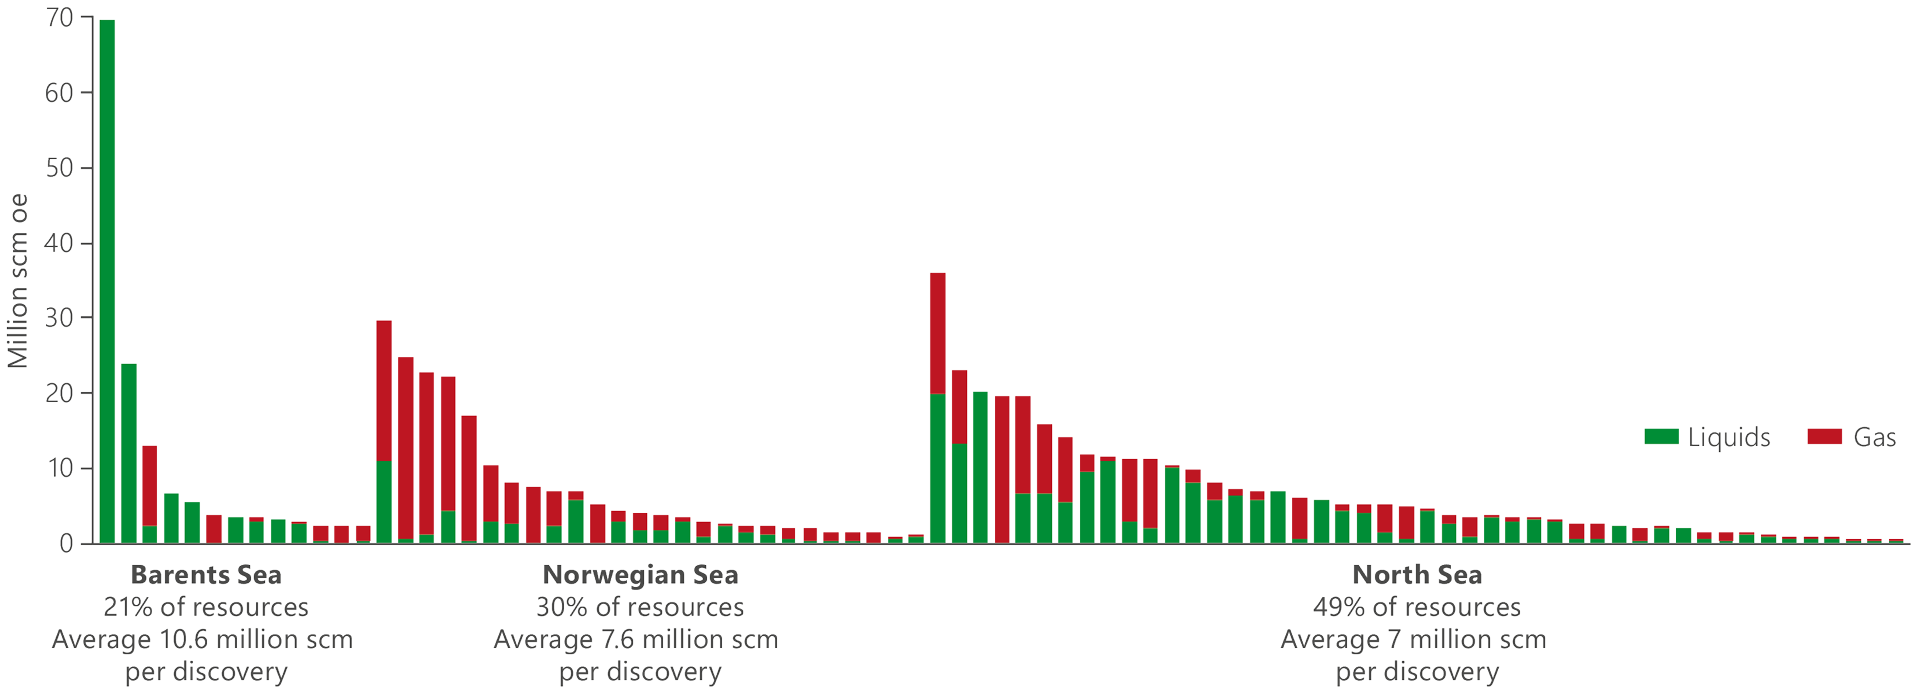
Most of the discoveries and roughly half the total resources in the discovery portfolio lie in the North Sea, just under a third in the Norwegian Sea and about a fifth in the Barents Sea.
The average discovery size is greatest in the Barents Sea, at 10.9 million scm recoverable oe. That is followed by 7.6 million scm oe in the Norwegian Sea and seven million scm oe in the North Sea. Figure 1.5 presents discoveries by sea area and expected recoverable resources.

Figure 1.5 Discoveries by sea area and expected recoverable resources at 31 Desember 2018.
Many discoveries in the North Sea have estimated recoverable resources below 10 million scm oe. These will probably be developed with subsea facilities and tied back to the extensive infrastructure in the area.
In the Norwegian Sea, 40 billion scm of gas were found during 2018 in 6604/5-1 Balderbrå and 6506/11-10 Hades/Iris, which rank as the biggest gas discoveries on the NCS since 2011. Several other large gas discoveries are also present in this area, and most of these are likely to be tied back to existing infrastructure.
The Barents Sea is a less mature area. Little infrastructure has been developed so far and relatively few discoveries are being considered for development for the moment. At the same time, Wisting in the Barents Sea is the biggest discovery on the NCS. Its licensees are working to mature solutions for a stand-alone development. In the event, that would provide the northernmost oil infrastructure on the NCS.
Existing infrastructure must be maintained and utilised
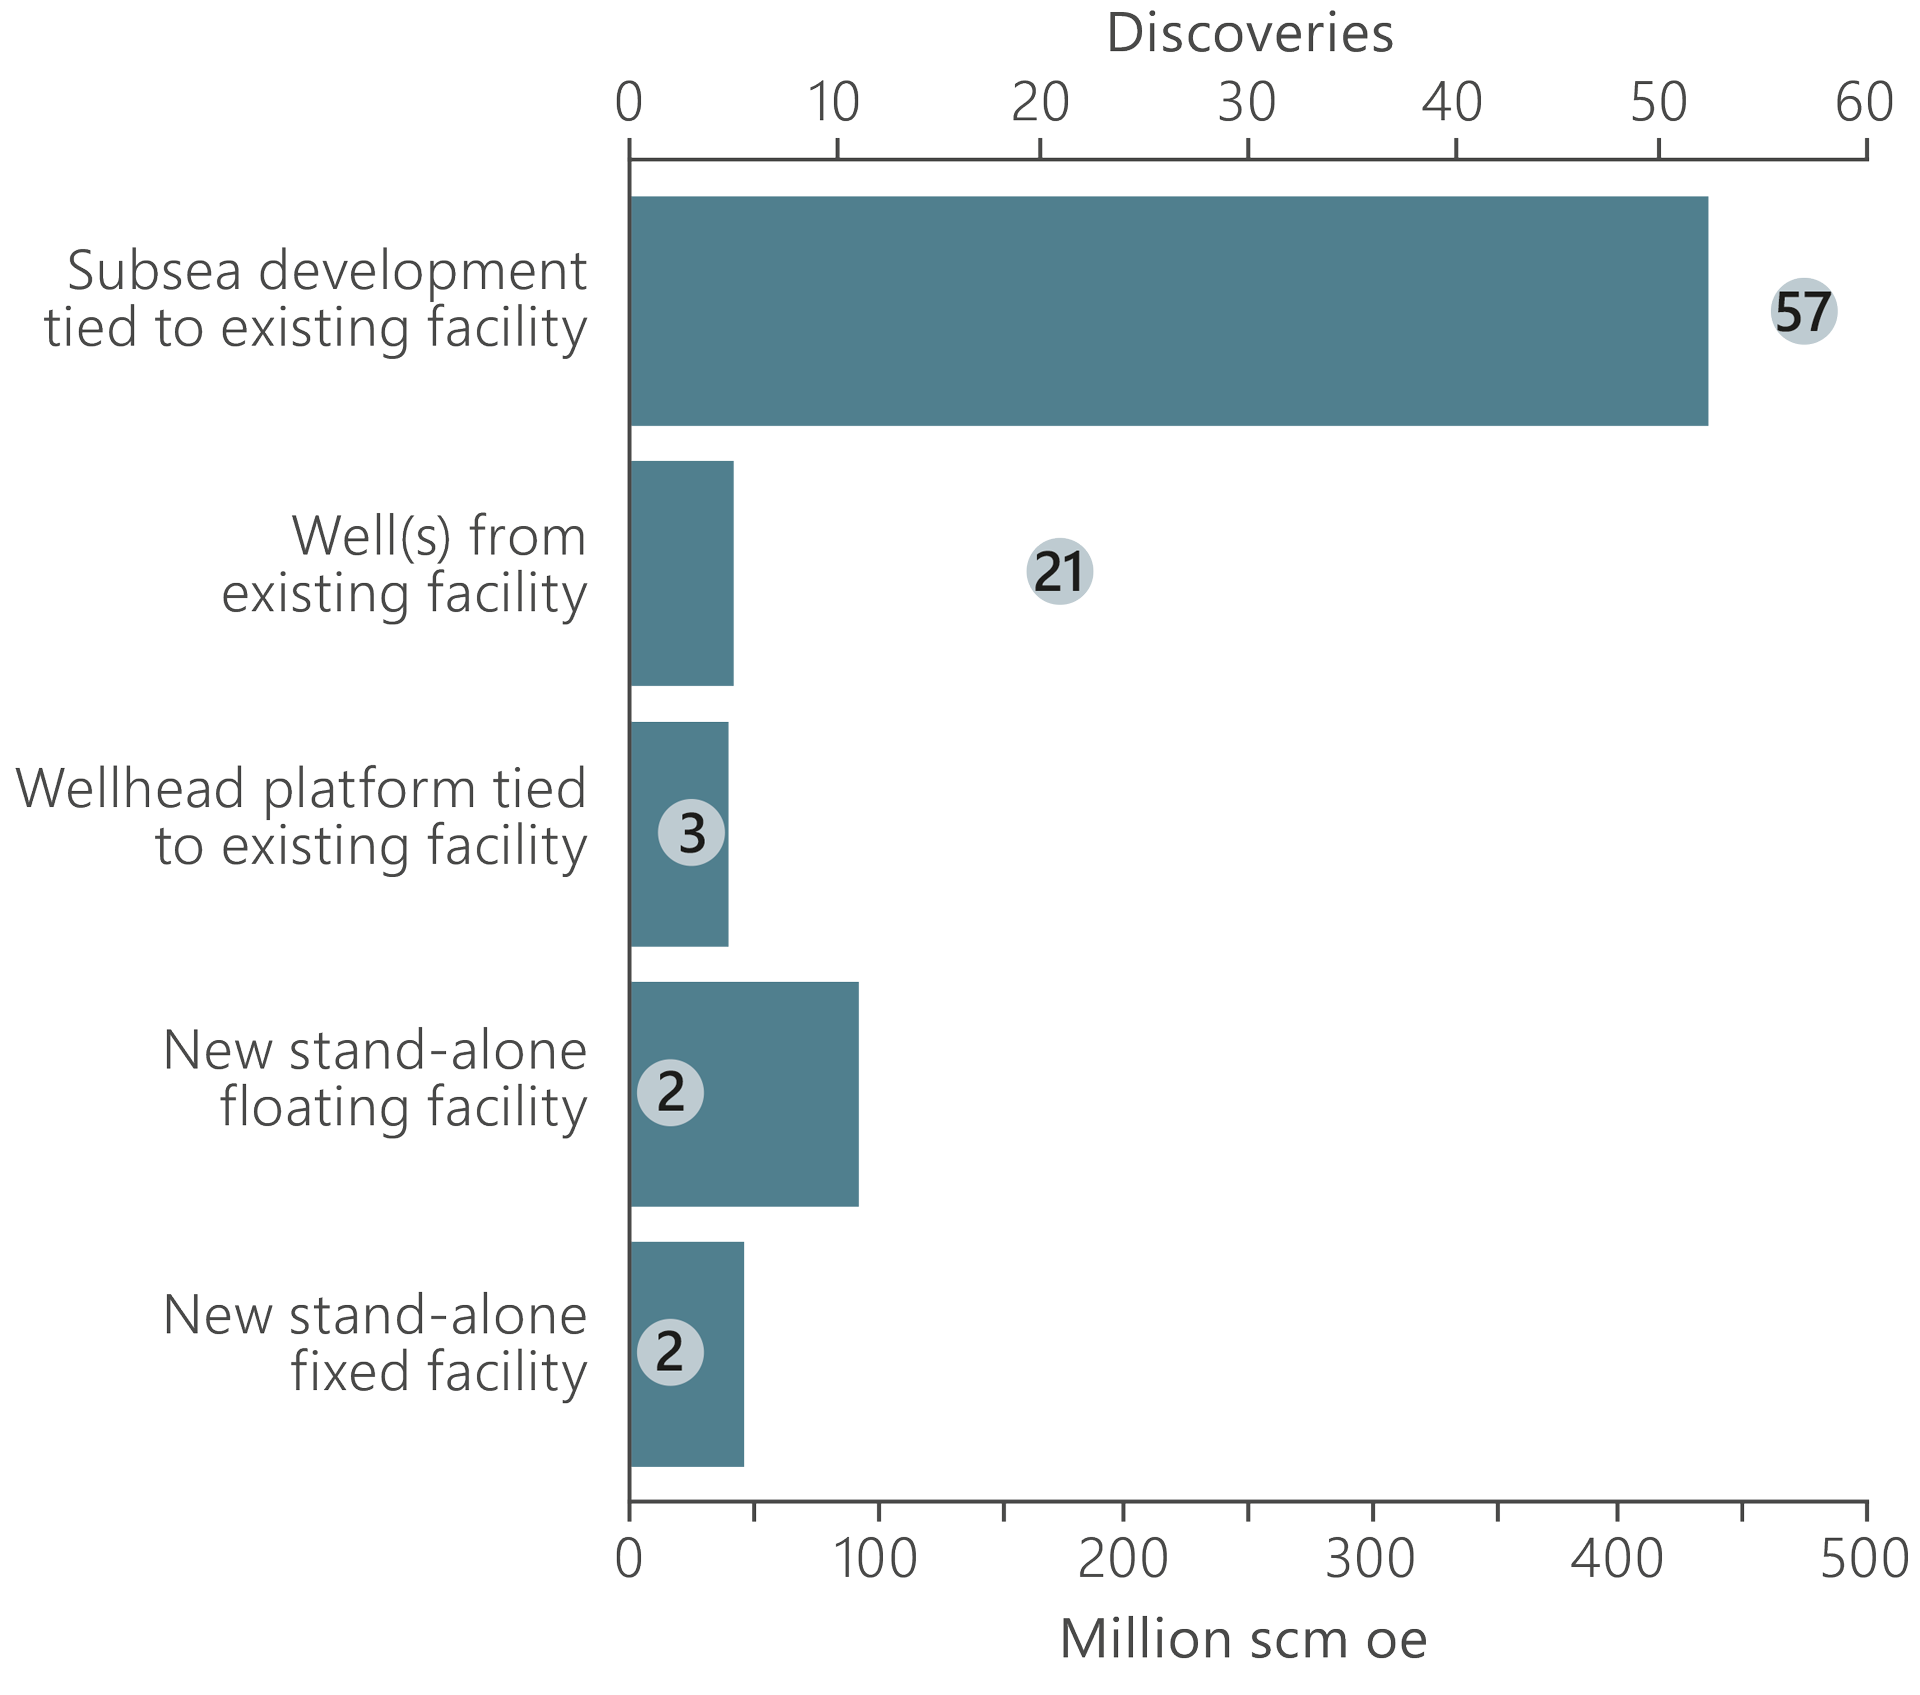
Phasing into existing or future infrastructure makes it possible to develop discoveries which are too small to be profitable on their own. This is expected to be the commonest development solution for discoveries in the portfolio.
Current plans indicate that around 80 discoveries amounting to roughly 500 million scm recoverable oe could be developed in this way. Maintaining the infrastructure is a precondition for phasing in discoveries by allowing the technical lifetime of the facilities to be extended if necessary. Figure 1.6 presents the discoveries and resources in the portfolio by the most probable development solution.

Figure 1.6 Discoveries and resources in the portfolio by the most probable development solution.
Subsea development is also relevant for larger discoveries. Seven of the 10 biggest finds are expected to be developed in this way and phased into a host field. These could collectively represent an investment of more than NOK 60 billion in 2018 value at today’s level of costs, and provide good examples of profitable utilisation of existing infrastructure. This includes the Grand development, where plans call for the joint development of several discoveries to be phased into the Grane facility in the North Sea.
Transporting unprocessed oil and gas over long distances poses a technical challenge because of the risk that deposits could plug the pipeline. This is particularly a problem for oil discoveries located a long way from possible host facilities. In such cases, measures must be taken to safeguard the transport.
One example is the Fenja development, where a technology was assessed for transporting oil in electrically heated pipelines over distances of around 60 kilometres. This type of technology development is crucial for being able to make even better use of the infrastructure.
Figure 1.7 presents the discoveries in the portfolio sorted by size and distance to possible host facilities. About 80 per cent of the discoveries and resources lie within a radius of 40 kilometres. This transfer distance does not normally pose problems for transporting unprocessed oil and gas.

Figure 1.7 Resources and distance from possible host facilities for discoveries in the portfolio.
Stand-alone developments
A number of discoveries in the portfolio could be developed jointly, with new stand-alone production facilities. That applies to finds with combined resources of more than 190 million scm oe, which could yield up to NOK 130 billion in investment at 2018 value with today’s level of costs. These estimates include redeveloping and phasing in fields which have been shut down (such as Frøy).
It is important that new facilities are built with enough flexibility to accept additional resources, and that development and activity are coordinated where that would be of value for society. The government is working to encourage collaboration across production licences. That is crucial for identifying solutions which create the greatest possible overall value, as in the area between Alvheim and Oseberg in the North Sea and in the Alta-Gohta area of the Barents Sea.
From “production unlikely” to development project
The companies are encouraged to relinquish discoveries they have no faith in, so that other players with new ideas get the opportunity to assess them for development. At present, 147 discoveries are classed as “production unlikely” (RC 6).
They lie in both active and relinquished production licences, and are regarded today as non-commercial because they are too small, require the development of new technology or lie too far from infrastructure. It is important that these do not get written off, but are re-evaluated at regular intervals in the light of such factors as new technology, available infrastructure and changes to market conditions.
Thirty-seven discoveries of this kind, with combined estimated resources of 150-200 million scm recoverable oe, have had their status changed to possible developments since 2001. Most lie in the “production likely, but unclarified” phase or are to be re-evaluated. Seven of them have been developed or decided for production, and a decision on test production has been taken on another.
All seven discoveries are relatively small and have been or are being phased into existing fields. This demonstrates that even discoveries classed at one point as “production unlikely” can in certain cases be developed through coordination and the use of existing infrastructure.
Shut-down fields can be redeveloped
Twenty-five fields on the NCS have ceased production. Generally speaking, all profitable petroleum in terms of value to society should be produced before fields are shut down. Nevertheless, conditions such as technology development, market changes and new infrastructure could mean that resources not found commercially viable before cessation may become profitable later.
At present, 10 projects have been reported to the NPD where the aim is to recover more of the resources in six shut-down fields. These could recover roughly 40 million scm oe, split equally between oil and gas. One example is Tor near Ekofisk. The licensees have submitted a PDO for reopening this field, which ceased production in 2015. Figure 1.8 presents the resources in projects related to shut-down fields by their redevelopment status (RC).

Figure 1.8 Resources in projects on shut-down fields by redevelopment status (RC).
Discoveries must be developed at the right time
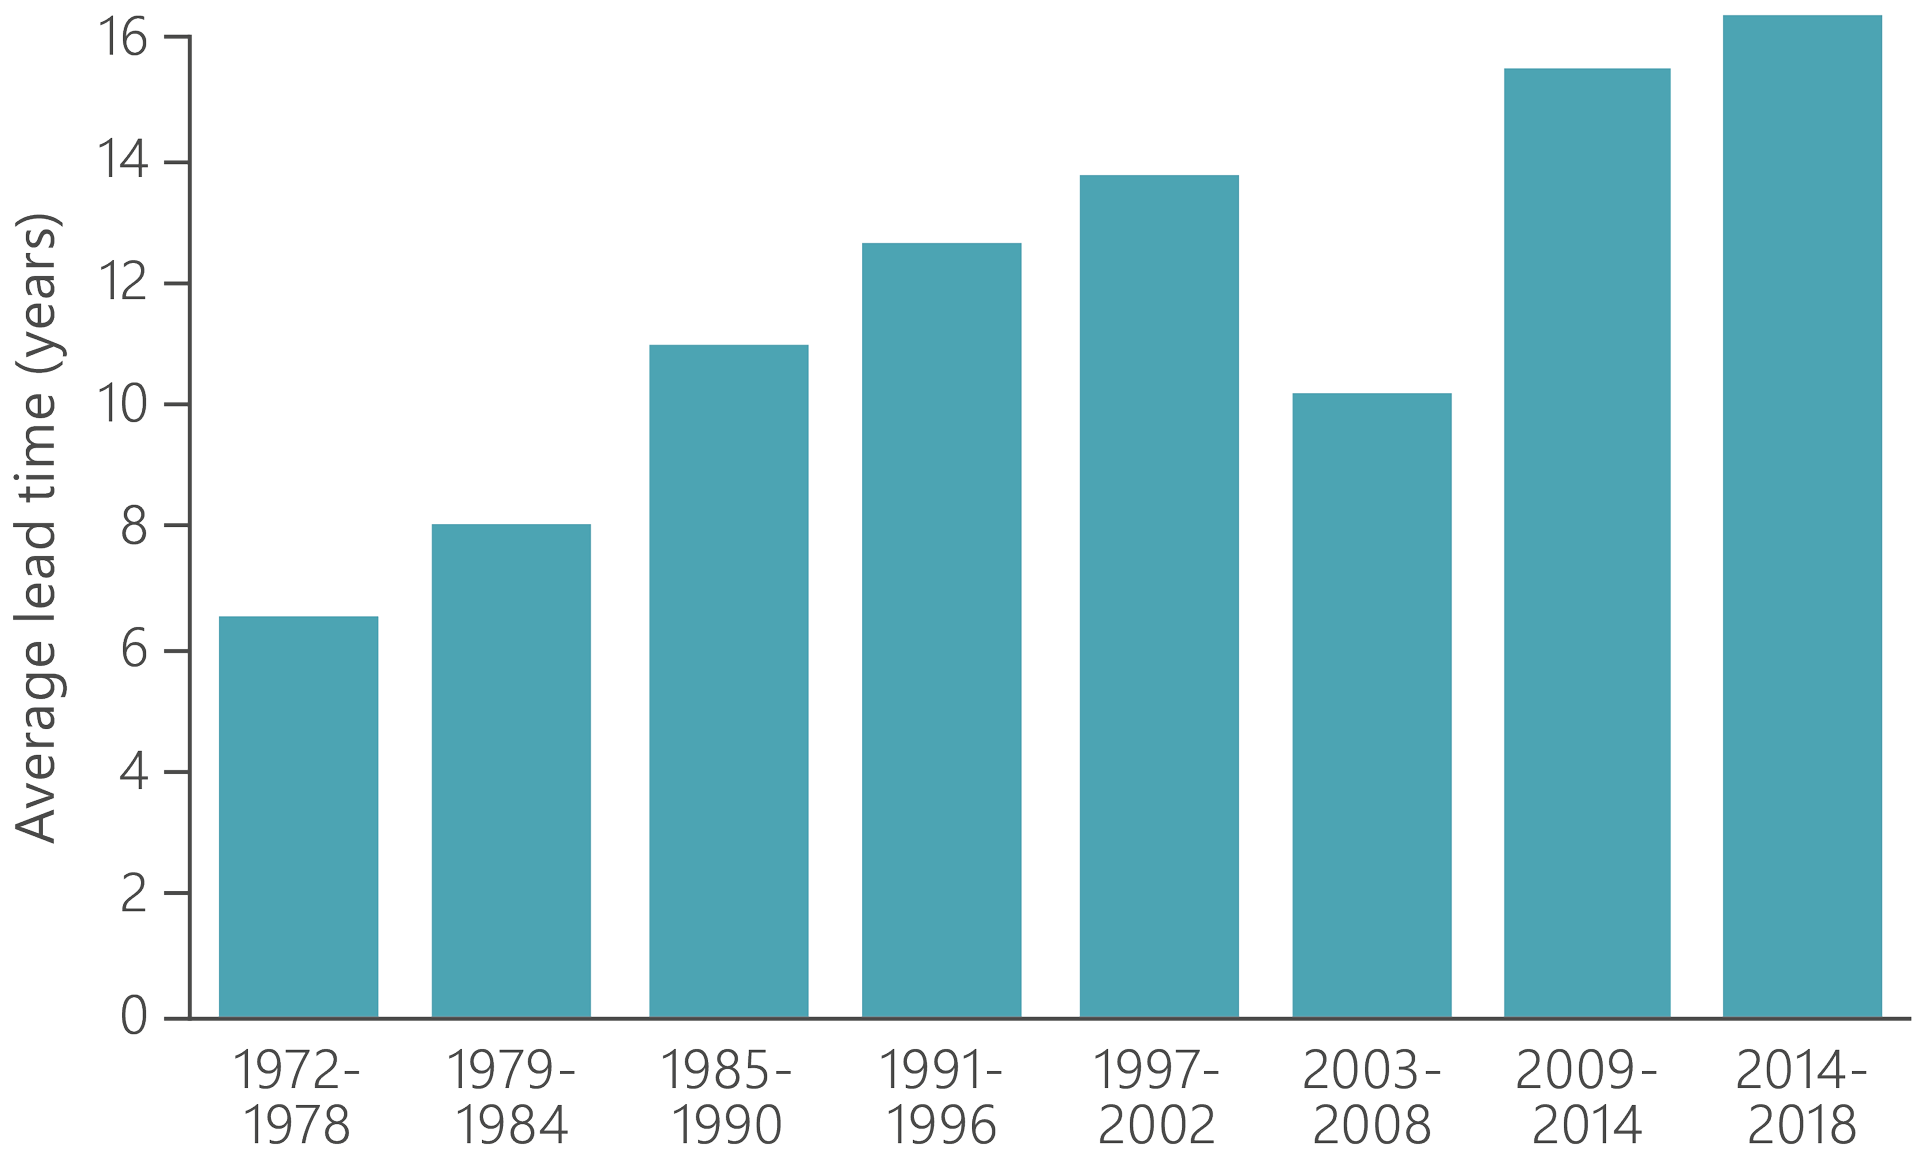
The period from proving a discovery until it comes on stream is known as lead time. The average lead time for developing new fields is 12 years, but with big variations from project to project. Apart from a period in the early 2000s, lead time has increased steadily from six years in 1972-78 to 16 in 2014-18.
As the NCS matures, fewer big discoveries are being made. At the same time, spare capacity becomes available in the infrastructure and new technology permits cost-effective development of discoveries which were earlier regarded as non-commercial. This means that an ever-growing number of the old discoveries are being developed and the average lead time is growing. Figure 1.9 shows the average lead time by year of coming on stream.

Figure 1.9 Average lead time by year of coming on stream.
A long lead time for certain discoveries is not necessarily negative. At times, these need to wait for spare capacity in available infrastructure, technological progress, additional resources or changes to market conditions in order to be developed.
A good example is Gina Krog, which was proven in 1978 but which was not brought into production because of its small size, complexity and the lack of local infrastructure. Spare capacity and the discovery of additional resources meant that it finally came on stream in 2017.