The challenging barrels
A study conducted by the Norwegian Petroleum Directorate (NPD) in the autumn of 2018 showed that large quantities of oil and gas are contained in tight reservoirs. It is important that the companies work to achieve profitable recovery of these volumes.
In parallel, work by the NPD shows that much immobile oil can be recovered with the aid of various EOR methods. To reduce uncertainty over the recovery potential, these techniques must be tested out on the fields.
Tight reservoirs
Most discoveries and fields have reservoir zones where the oil or gas is difficult to produce. One reason for this could be that the formations are so impermeable (tight) that the hydrocarbons flow poorly. Permeability is measured in Darcy (D).
Tight reservoirs on the NCS have been mapped by the NPD in terms of their permeability, with 10 milliDarcy (mD) as the upper limit for inclusion. Such formations often call for the use of unconventional technology to achieve profitable development.
Big oil and gas volumes in place
The operators reported data from tight reservoirs in 30 discoveries and fields. In addition, the NPD performed its own assessment of such formations in a further 12 discoveries.
Tight reservoirs in the 42 discoveries and fields covered by the study contain some 2 000 million scm oe in place. This breaks down into roughly 1 200 million scm of oil and 800 billion scm of gas – which is considerably more, for example, than resources originally in place in Ekofisk, one of the largest fields on the NCS.
Figure 3.1 presents the mapped oil and gas volumes with the estimated uncertainty range. The latter is relatively low for the oil volumes in place because a number of the tight reservoirs are found in fields on stream, and are therefore well mapped.
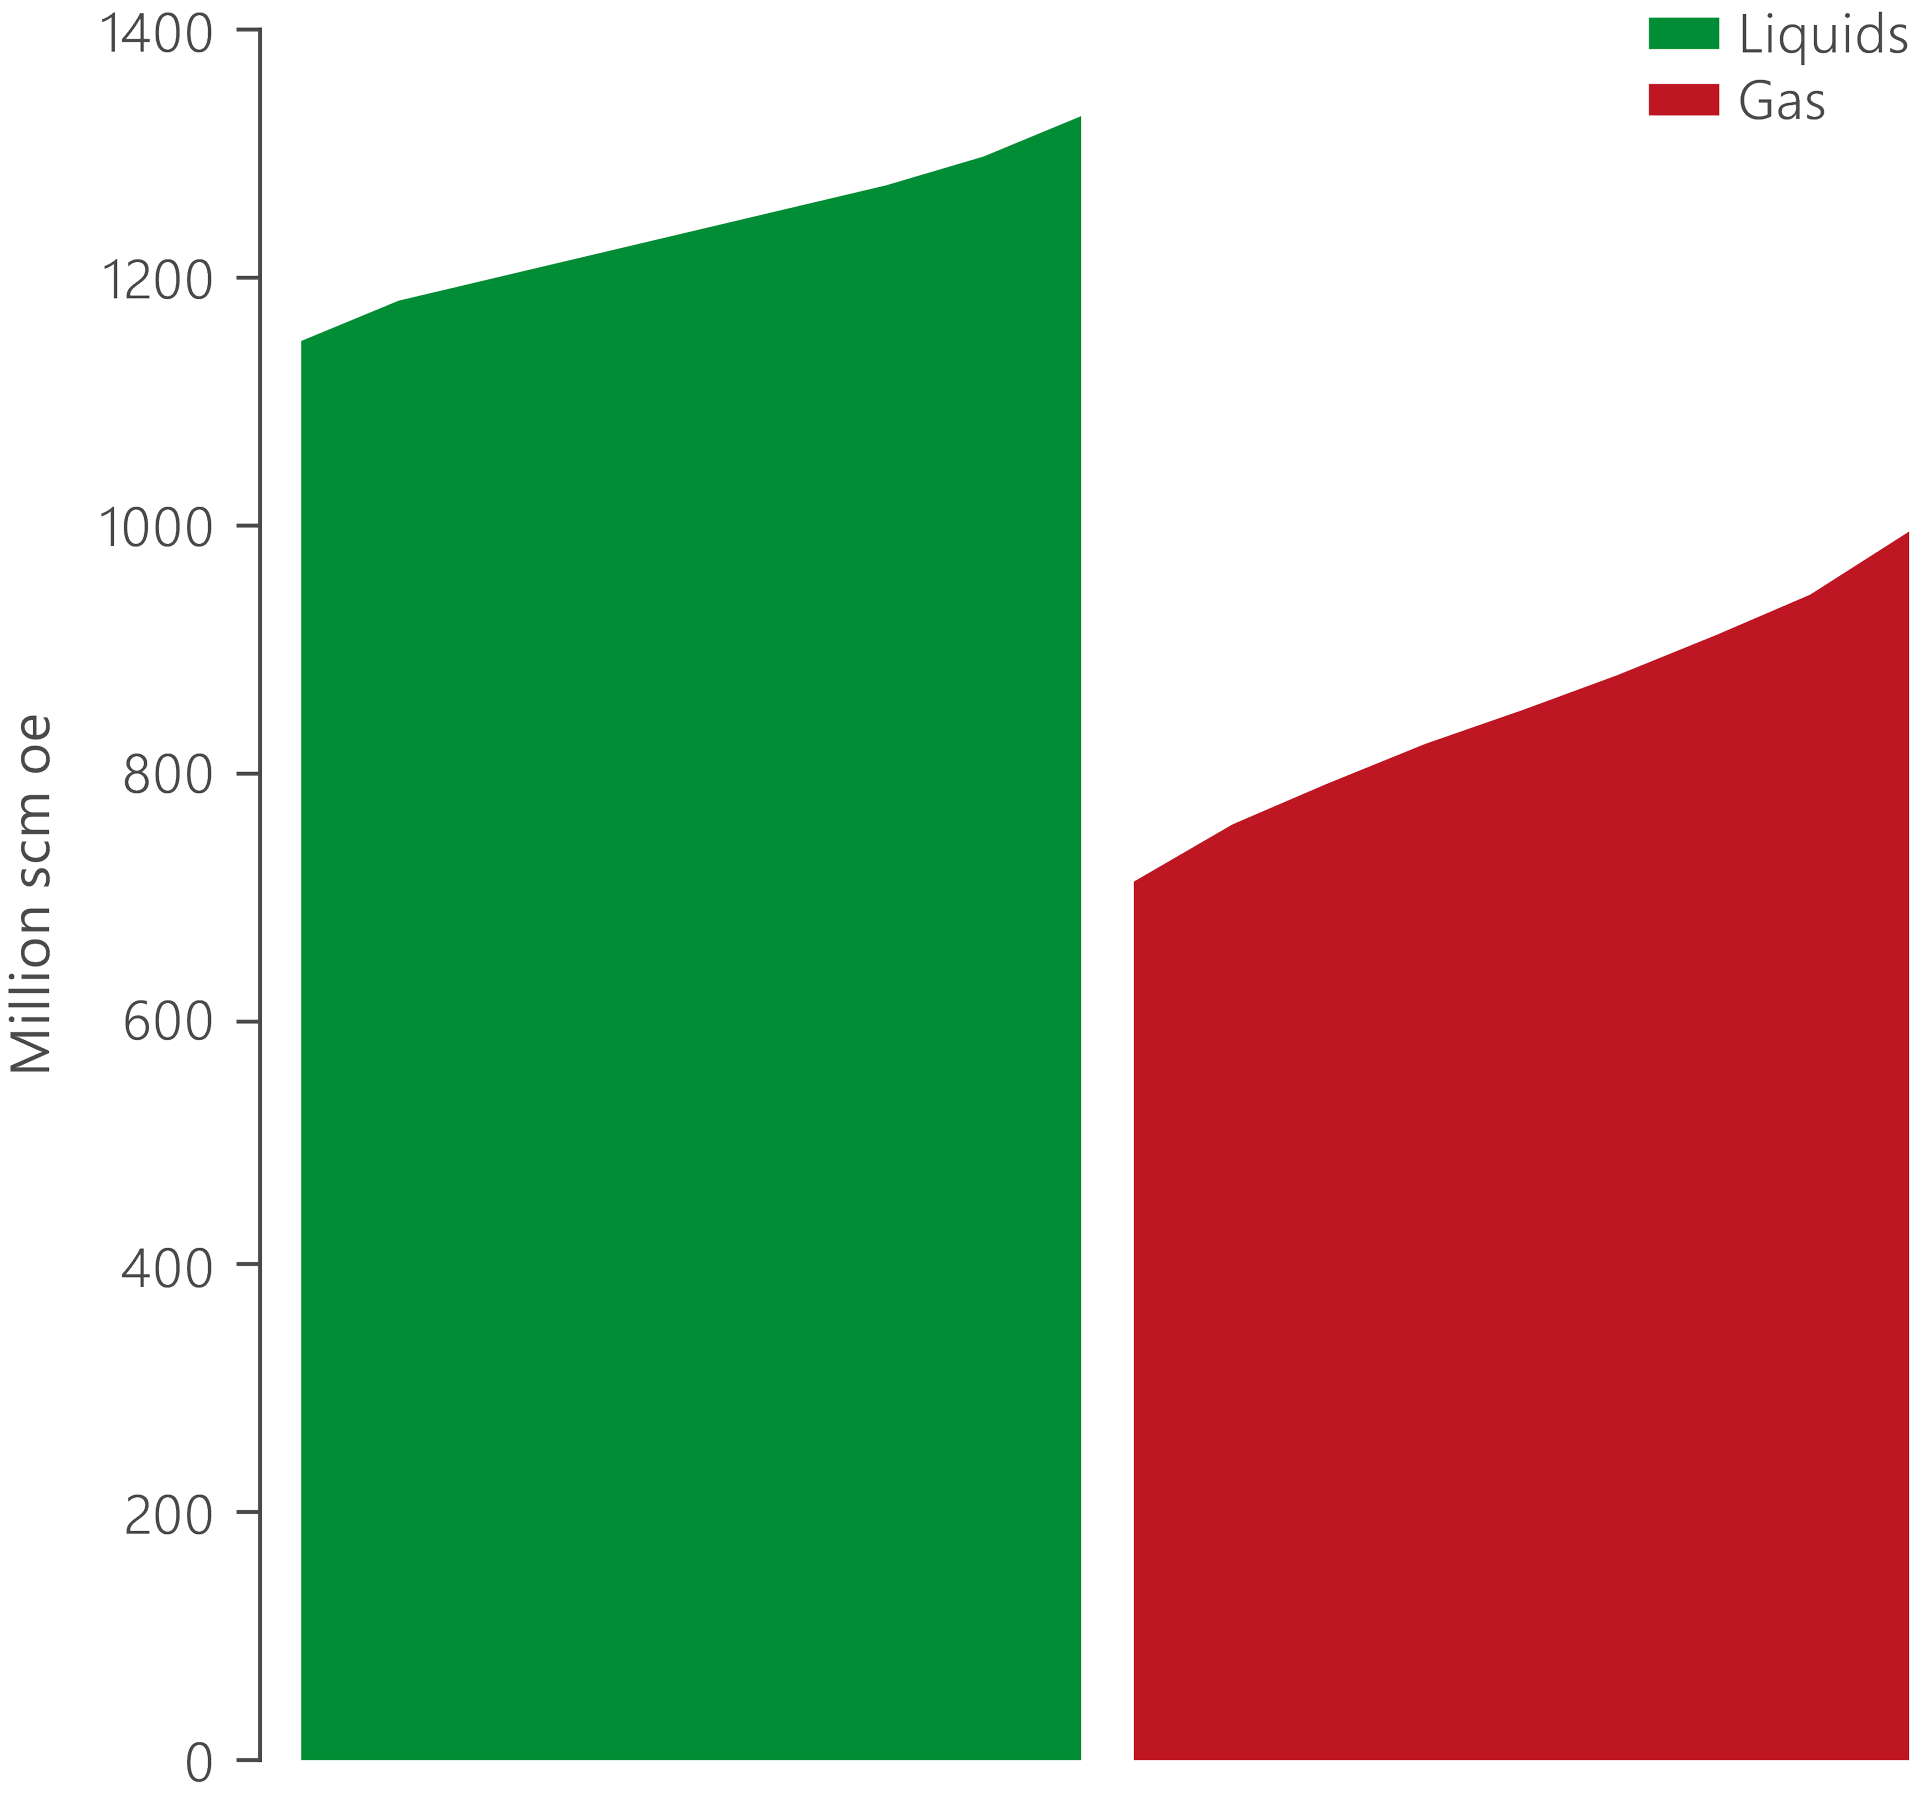
Figure 3.1 Mapped oil and gas volumes in place in tight reservoirs, including the uncertainty range.
Tight reservoirs by area
North Sea
The estimate for mapped volumes in place in tight reservoirs in the southern part of Norway’s North Sea sector is in the order of 750 million scm of oil and 90 billion scm of gas. Most of this lies in carbonate reservoirs in the Ekofisk, Eldfisk and Valhall area. Producible oil has also been identified in the Utsira High basement. That comprises hard and tight rocks but is so heavily fractured and porous in this area that oil has migrated in.
Mapped volumes in tight reservoirs in the northern North Sea sector are estimated at roughly 360 million scm of oil and 80 billion scm of gas. Much of the volume in this area lies in sandstone reservoirs. On Oseberg and Gullfaks, however, large volumes are also found in the overlying Shetland Group chalk and partly in the Lista Formation.
Test production of the oil in the Shetland Group chalk has been conducted on Oseberg, but output rates are considered too low to be profitable for the time being. Tight chalk in the Shetland Group is being produced on Gullfaks, with water injection and horizontal wells used to improve recovery. See article in chapter 2, "Fields".
Norwegian Sea
Mapped volumes in place in tight Norwegian Sea reservoirs are estimated at about 130 million scm of oil and 420 billion scm of gas. These volumes exist exclusively in sandstone reservoirs. A large proportion is found in the Tilje and Garn Formations, which lie deep and have very varying reservoir properties.
The Lavrans, Linnorm, Noatun and Njord North Flank 2 and 3 discoveries all contain tight reservoir zones, where the licensees are currently assessing development opportunities using various technologies to improve profitability. Tiny-hole technology used in the tight Garn Formation zones in Smørbukk South provides an example of testing new technical approaches to improve productivity in such rocks.
Discoveries have also been relinquished because the licensees have not found the tight zones profitable to develop. An example is 6506/6-1 Victoria in the Norwegian Sea, which has large volumes in place but has been relinquished by the licensees.
Barents Sea
Mapped volumes in place in tight Barents Sea reservoirs are estimated at five million scm of oil and 270 billion scm of gas. Since the Barents Sea is less explored than the North and Norwegian Seas, its resource base is more uncertain. The tight reservoirs in this part of the NCS are found in Triassic sandstones.
Figure 3.3 below summarises oil and gas volumes in tight reservoirs by sea area.
Producing from tight reservoirs
Achieving profitable production from tight reservoirs calls for measures to increase exposure to the wells, so that the oil and gas flow better. This can be done by fracturing the formation close to the wells and/or by drilling many well paths in the tight zones.
Various types of fracturing and multilateral wells are currently the most relevant methods for recovering resources in tight reservoirs. Fracturing combined with acid stimulation is used on the carbonate fields in the Ekofisk area. Tiny-hole technology is also appropriate in a number of places, with many holes in the same well increasing exposure to the reservoir and allowing oil and gas to flow more easily into the wells. Where suitable, fracturing combined with water and gas injection can also help to improve recovery.
Tight reservoir zones can be produced together with more permeable ones. Producing both tight and good formations in the same well requires zone control for optimal reservoir management. See the fact box in chapter 2. While this can help to improve recovery from the tight zones, the technology must be further developed and become more cost-effective.
In a number of cases, producing from tight reservoirs can only become profitable if development is based on a tie-back to existing infrastructure. Large volumes and relatively low output rates mean a long production horizon. Solutions which allow the resources to be produced within the operating life of existing infrastructure are therefore important.
A number of projects for producing tight reservoirs are under assessment, have been decided or are under development. A water injection pilot on Gullfaks in the North Sea has contributed to a decision on improved recovery from the tight Shetland/Lista reservoirs. The licensees are assessing various development solutions for the tight reservoirs in 6406/9-1 Linnorm in the Norwegian Sea.
Test production is planned for 34/11-2-S Nøkken and 16/1-12 Rolvsnes in the North Sea, and tiny-hole technology has been tested for improving recovery from the tight chalk reservoirs in Valhall. Various completion solutions are also being developed to increase reservoir exposure in the Ekofisk area.
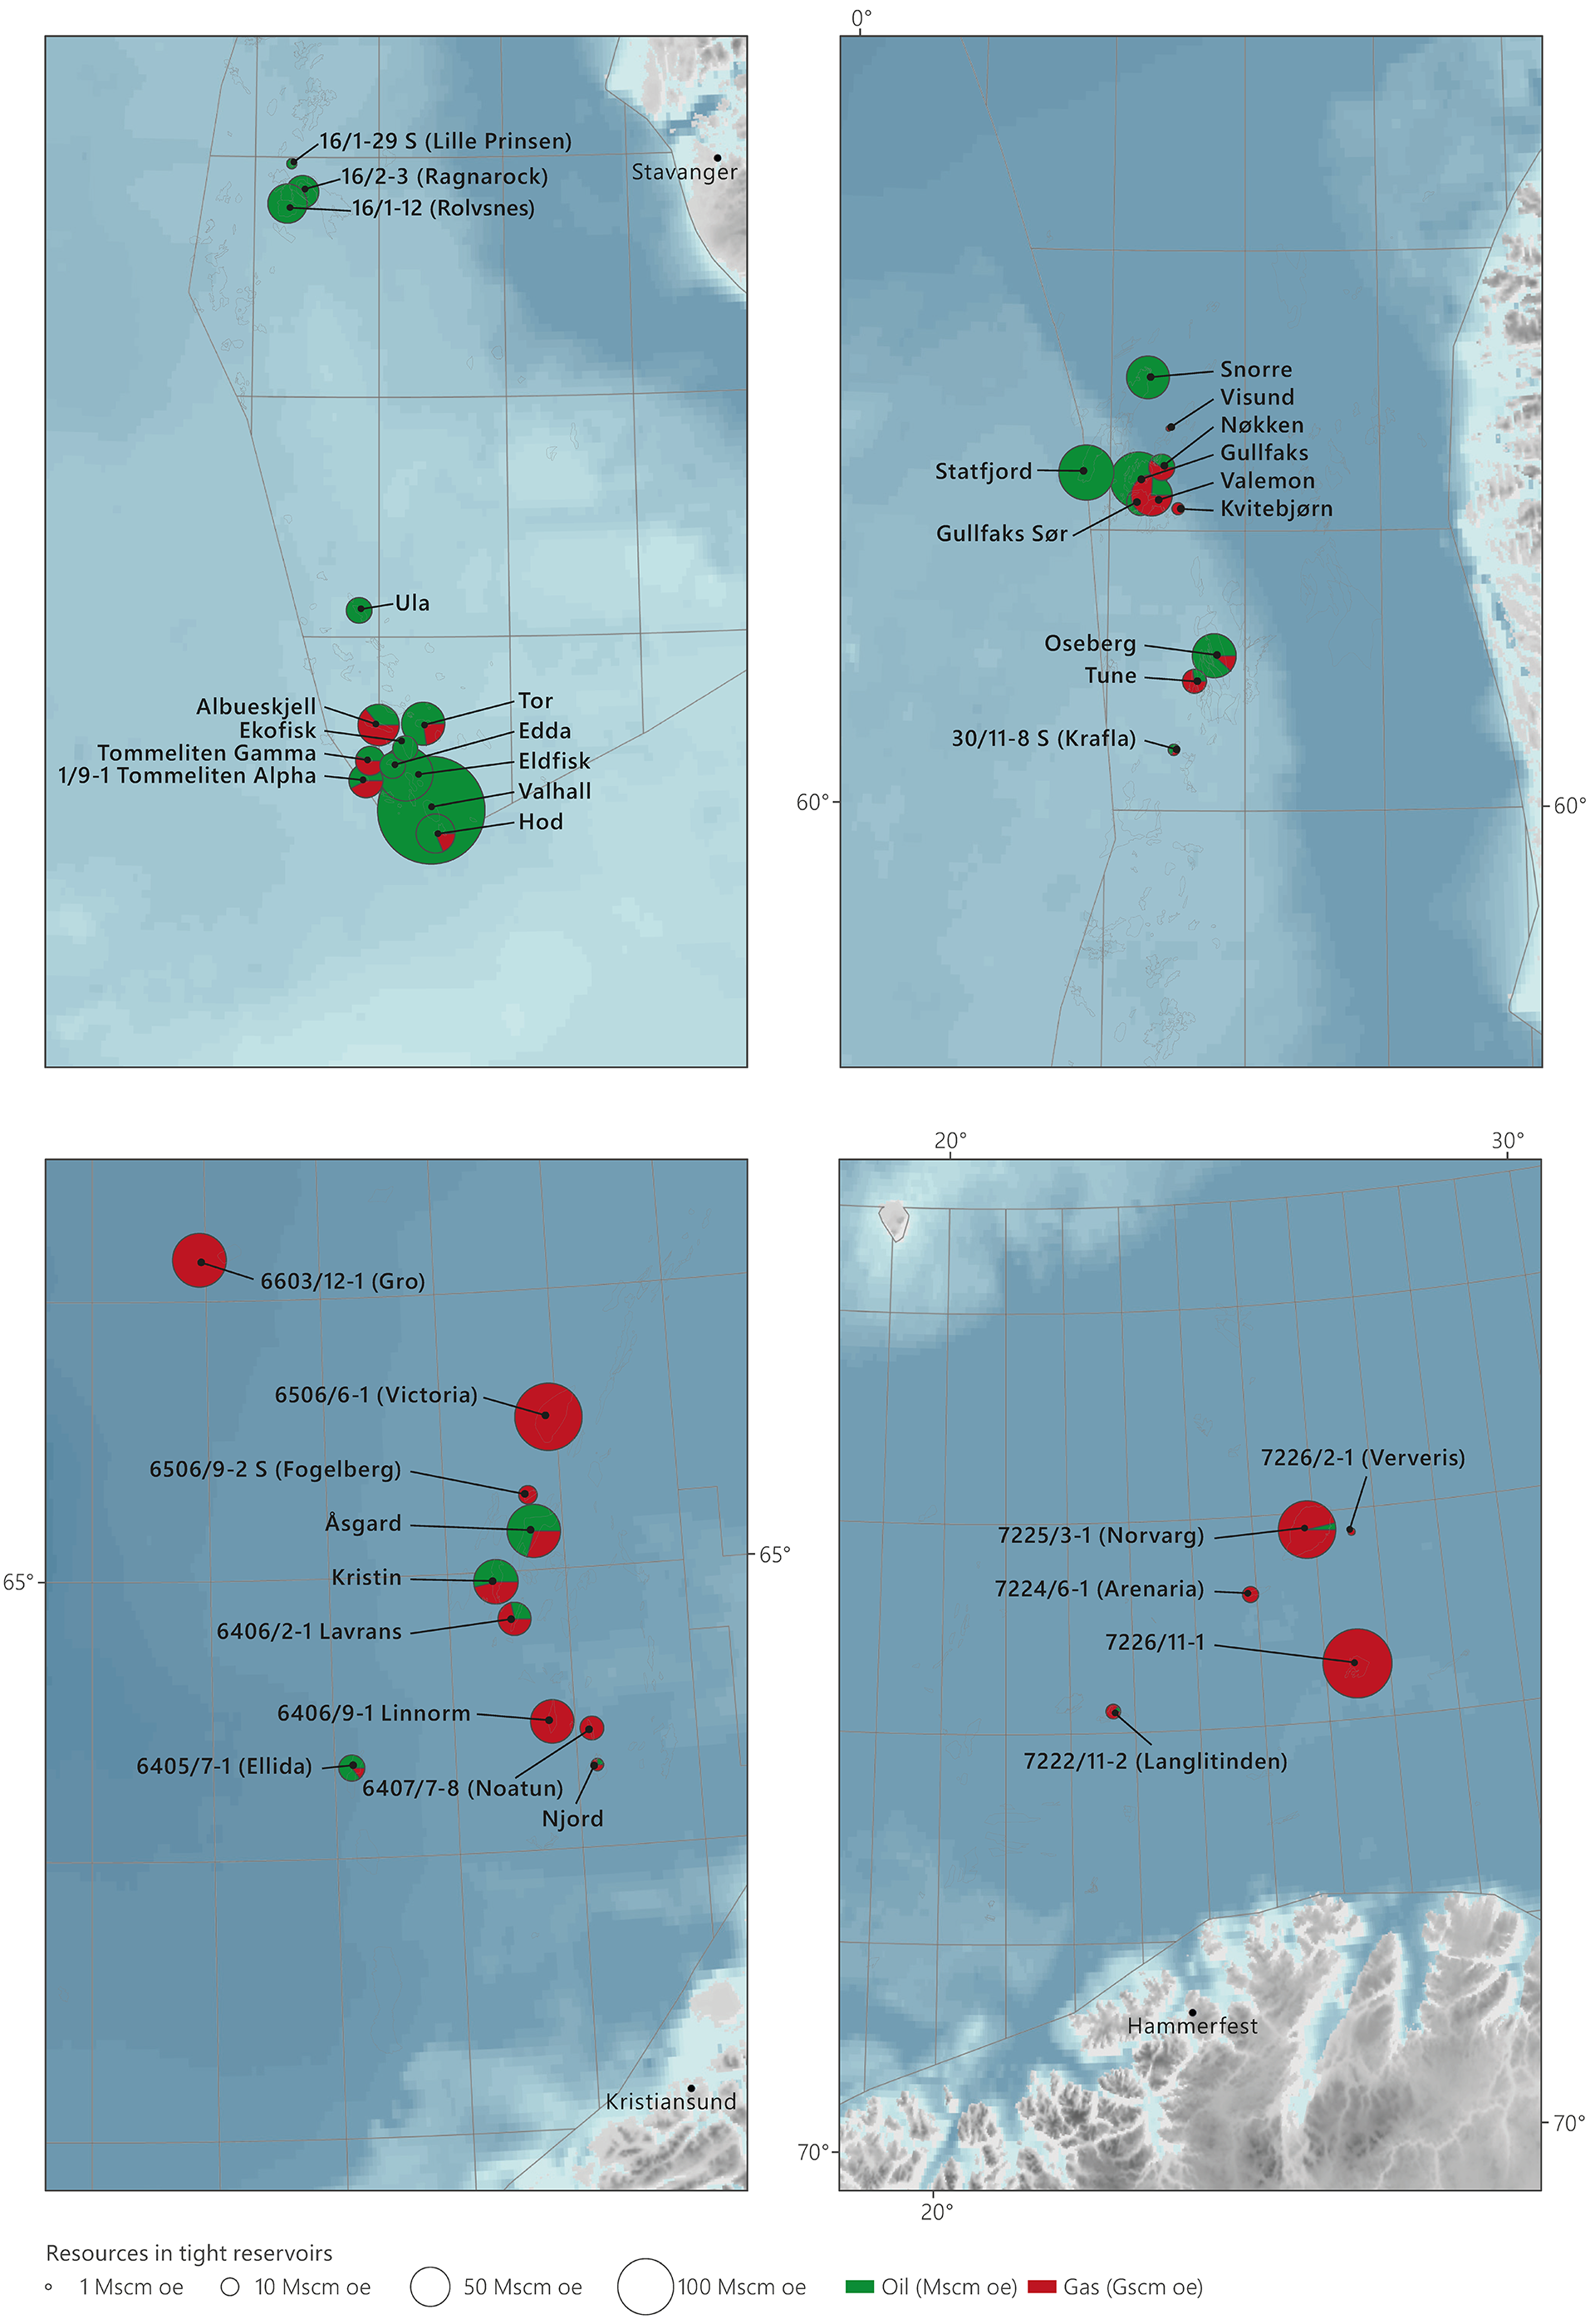
Figure 3.2 Overview of oil (green) and gas (red) in place in tight reservoirs in the southern and northern parts of Norway’s North Sea sector as well as in the Norwegian and Barents Seas.
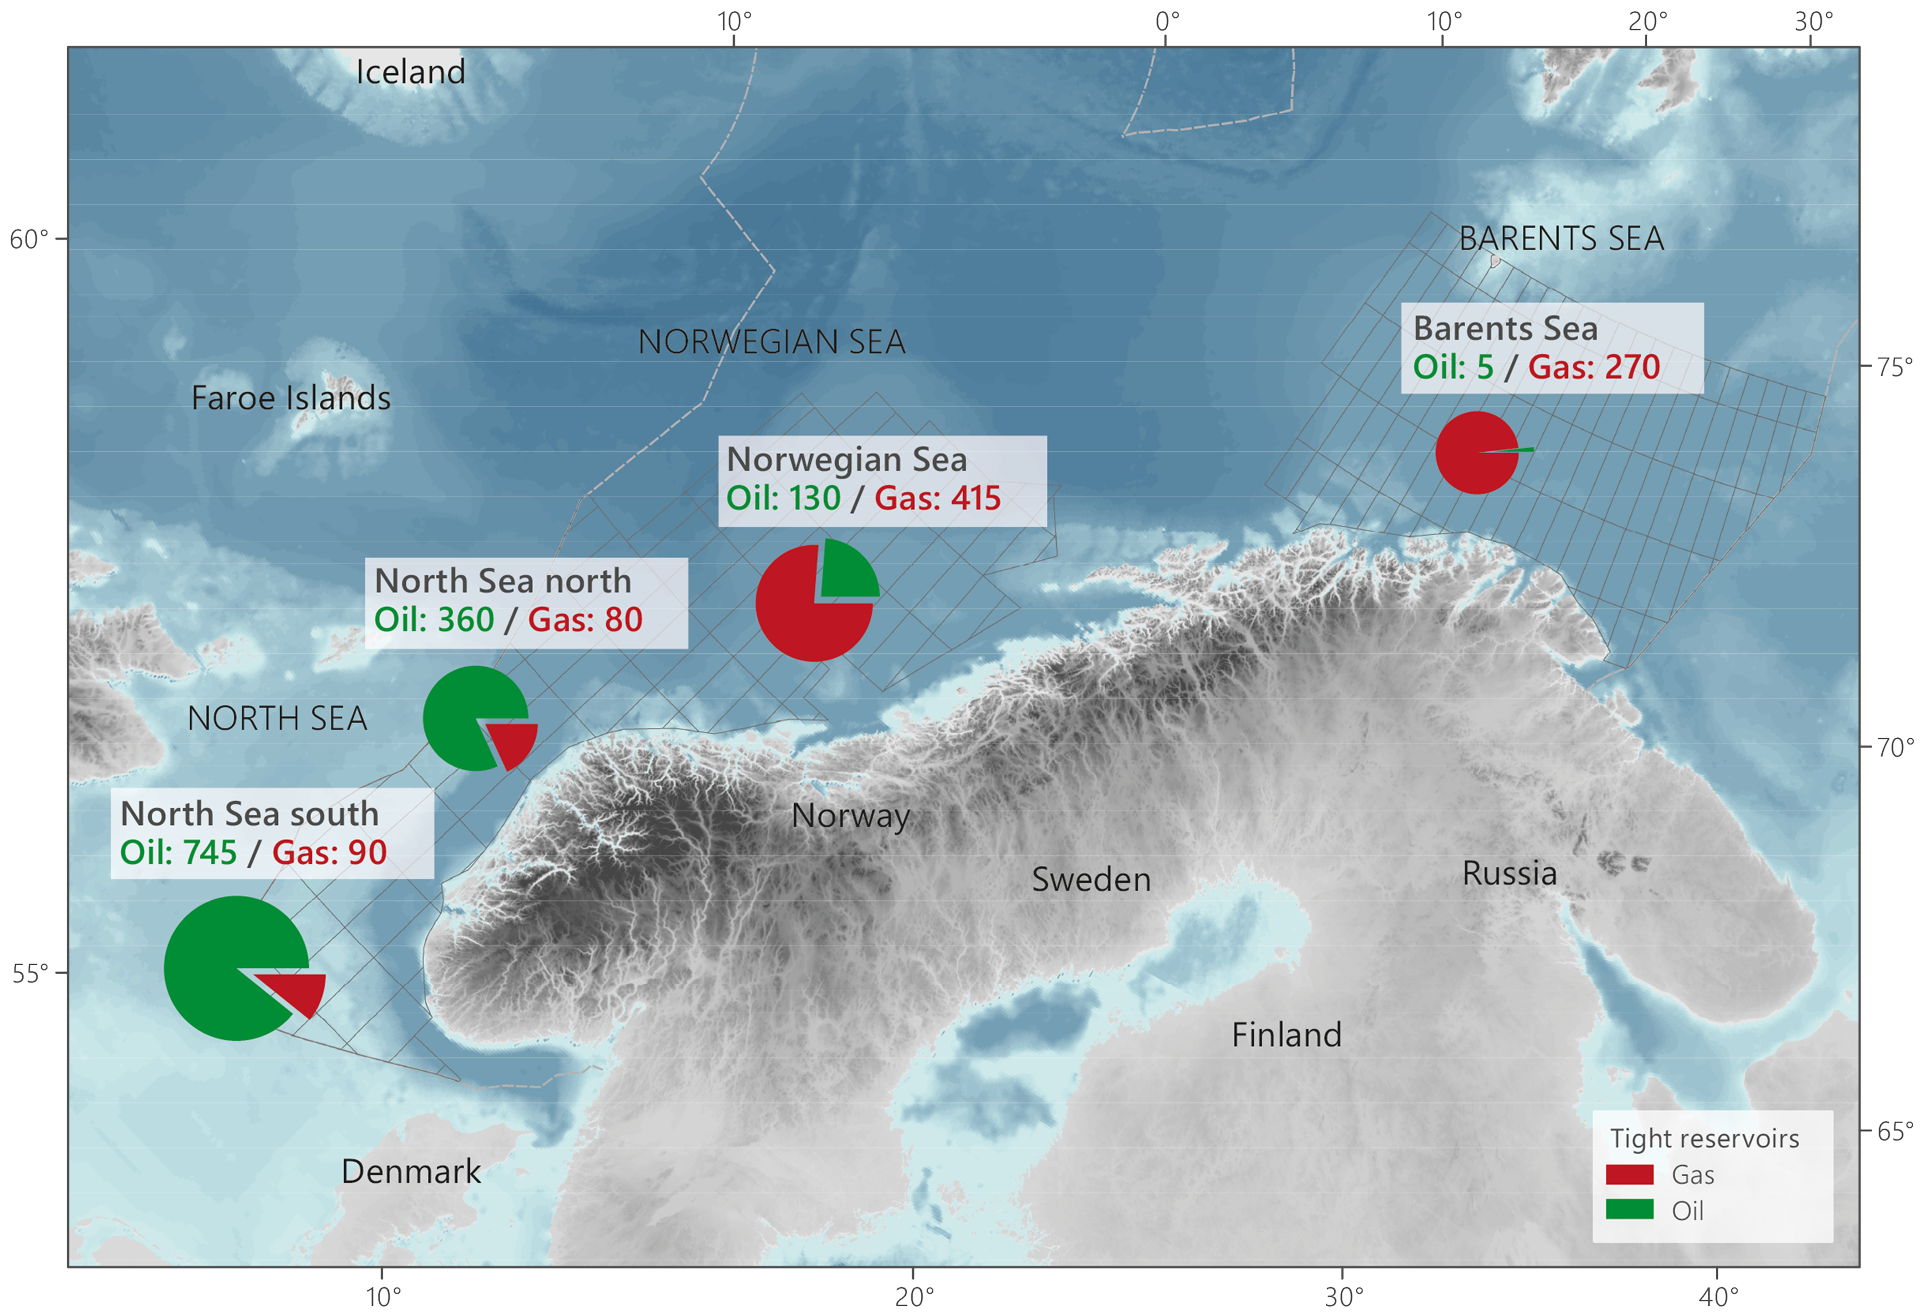
Figure 3.3 Oil and gas in place in tight reservoirs by area. Amounts in million scm oe.
Recoverable oil and gas volumes in tight reservoirs
The operators have reported recoverable volumes from tight reservoirs for 27 of the 42 discoveries and fields covered by the NPD’s study. Estimated recovery factors vary greatly between the different reservoirs. On that basis, the NPD has calculated an average recovery factor of 20 per cent (five to 40 per cent) for oil and 30 per cent (10 to 50 per cent) for gas in the chalk reservoirs. In sandstone reservoirs, the average recovery factor is estimated at 12 per cent (four to 40 per cent) for oil and 25 per cent (18 to 40 per cent) for gas.
Assuming that this applies to all the 42 discoveries and fields in the study, the recovery potential in the mapped tight reservoirs is estimated to be in the order of 450 million scm oe. This breaks down as 200 million scm oe and 250 million scm oe for chalk and sandstone reservoirs respectively. Developing efficient new well technology and more cost-effective development solutions could mean that recovering more of the oil and gas in tight reservoir zones will become profitable.
Based on input from Lundin: Recovering oil from fractured basement rock
Advanced methods to improve recovery
Water, gas or a combination of these are injected into most oil fields on the NCS to improve recovery. Such injection maintains pressure while also pushing oil through the reservoir and towards the production wells. Nevertheless, substantial quantities of oil remain which cannot be recovered in this way. The NPD estimates that about half this remaining oil is immobile (see the article "Recovering oil from fractured basement rock"). Recovering part of these resources calls for EOR methods which are more advanced than water and gas injection.
Several EOR techniques involve known technology and are used with fields on land worldwide, but have not so far been applied to any extent offshore. An EOR study conducted by the UK government in 2012 indicated a technical potential of almost 1 000 million scm of oil on the UK continental shelf (UKCS). It is estimated that 10-20 per cent of this could be commercial.
On that basis, Britain’s Oil and Gas Authority (OGA) and the operators on the UKCS developed an EOR strategy in 2016. That has led to several projects, including injection of low-salinity water and polymers on the Clair Ridge and Captain fields respectively. This demonstrates that EOR can also be implemented on offshore fields comparable with those on the NCS.
Technical potential
The technical EOR potential in 27 fields and discoveries was mapped by the NPD in 2017. This analysis has now been updated and expanded to 46 fields and discoveries. Based on reservoir data reported to the NPD by the operators, it shows a technical EOR potential of about 700 million scm of recoverable oil. This is almost as much as two Johan Sverdrup fields. Figure 3.6 presents the resource overview for the fields and discoveries studied, including the technical EOR potential.
Fourteen different EOR methods are assessed in the analysis for all fields and discoveries. The technical potential is estimated by summing the potential volume offered by the method which gives the largest volume per field and discovery.
Despite the substantial technical potential, annual reporting to the government shows that only a few projects of this type are under assessment on the NCS.
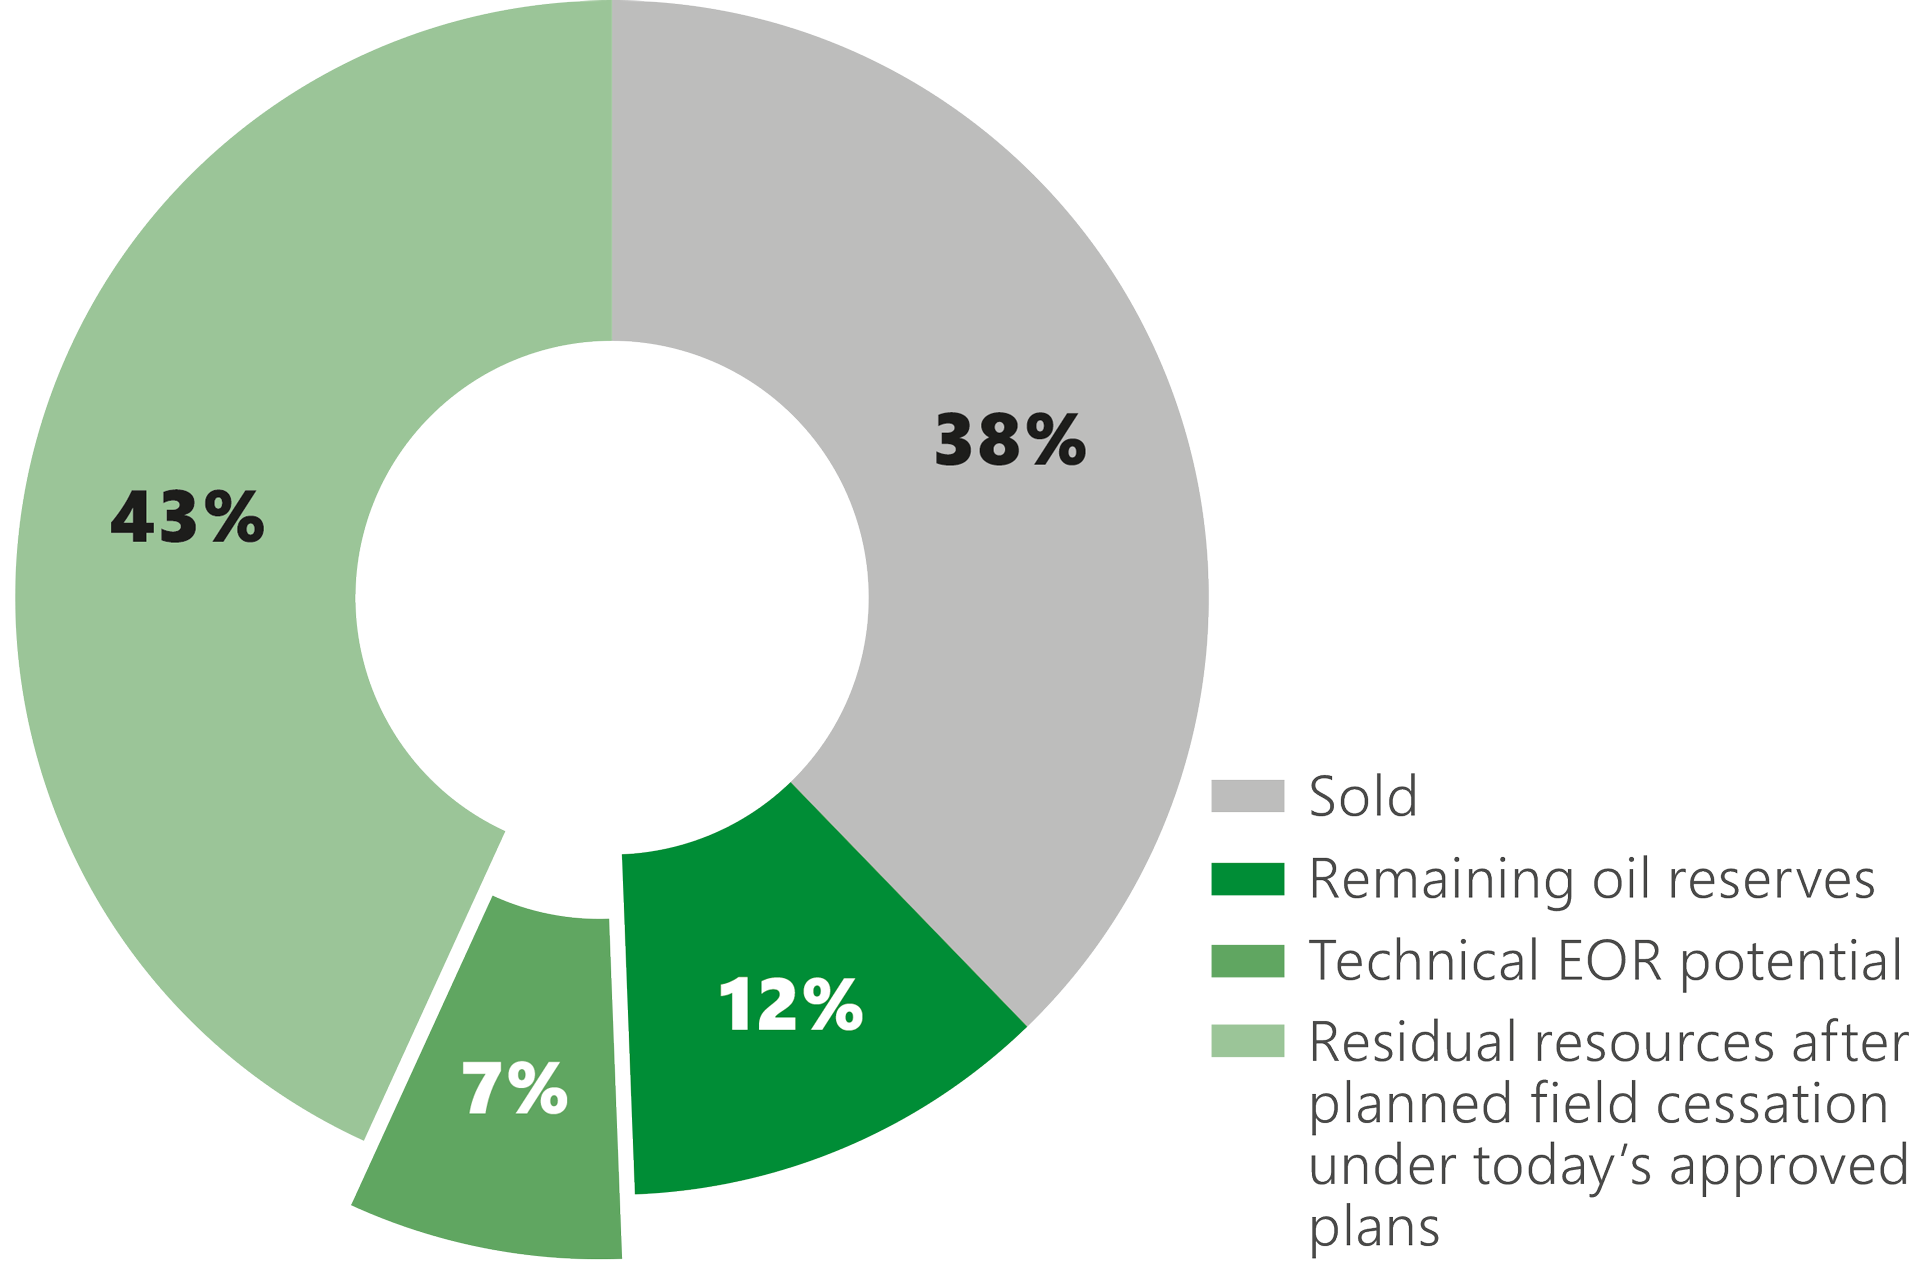
Figure 3.6 Resource overview for the 46 fields and discoveries in the study, including the technical EOR potential.
Scaled potential
The technical potential does not take account of whether the EOR methods are commercial or practical for possible implementation on the fields. As a result, the NPD has expanded its analysis to look at the effect of factors other than the sub-surface parameters which are significant for EOR projects.
New data were acquired from the operators for the expanded analysis. This information primarily relates to operational criteria which are important for mapping opportunities to adopt EOR methods on planned and existing facilities. The operators themselves have ranked the criteria which could affect implementation of the EOR methods.
These include space and weight capacities on facilities, corrosion resistance of the equipment, the water treatment system and distance from infrastructure. The NPD has also estimated production profiles and capital costs as a basis for calculating a present value for each method. A flat oil price of USD 60 per barrel and a discount rate of seven per cent have been assumed.
Based on operator reports and the NPD’s own assessments, a scaled EOR potential of 350 million scm of oil has been calculated with an uncertainty range of 180-500 million scm. This is almost as much as the reserves in Johan Sverdrup. Figure 3.8 presents both technical and scaled EOR potentials with uncertainty ranges.
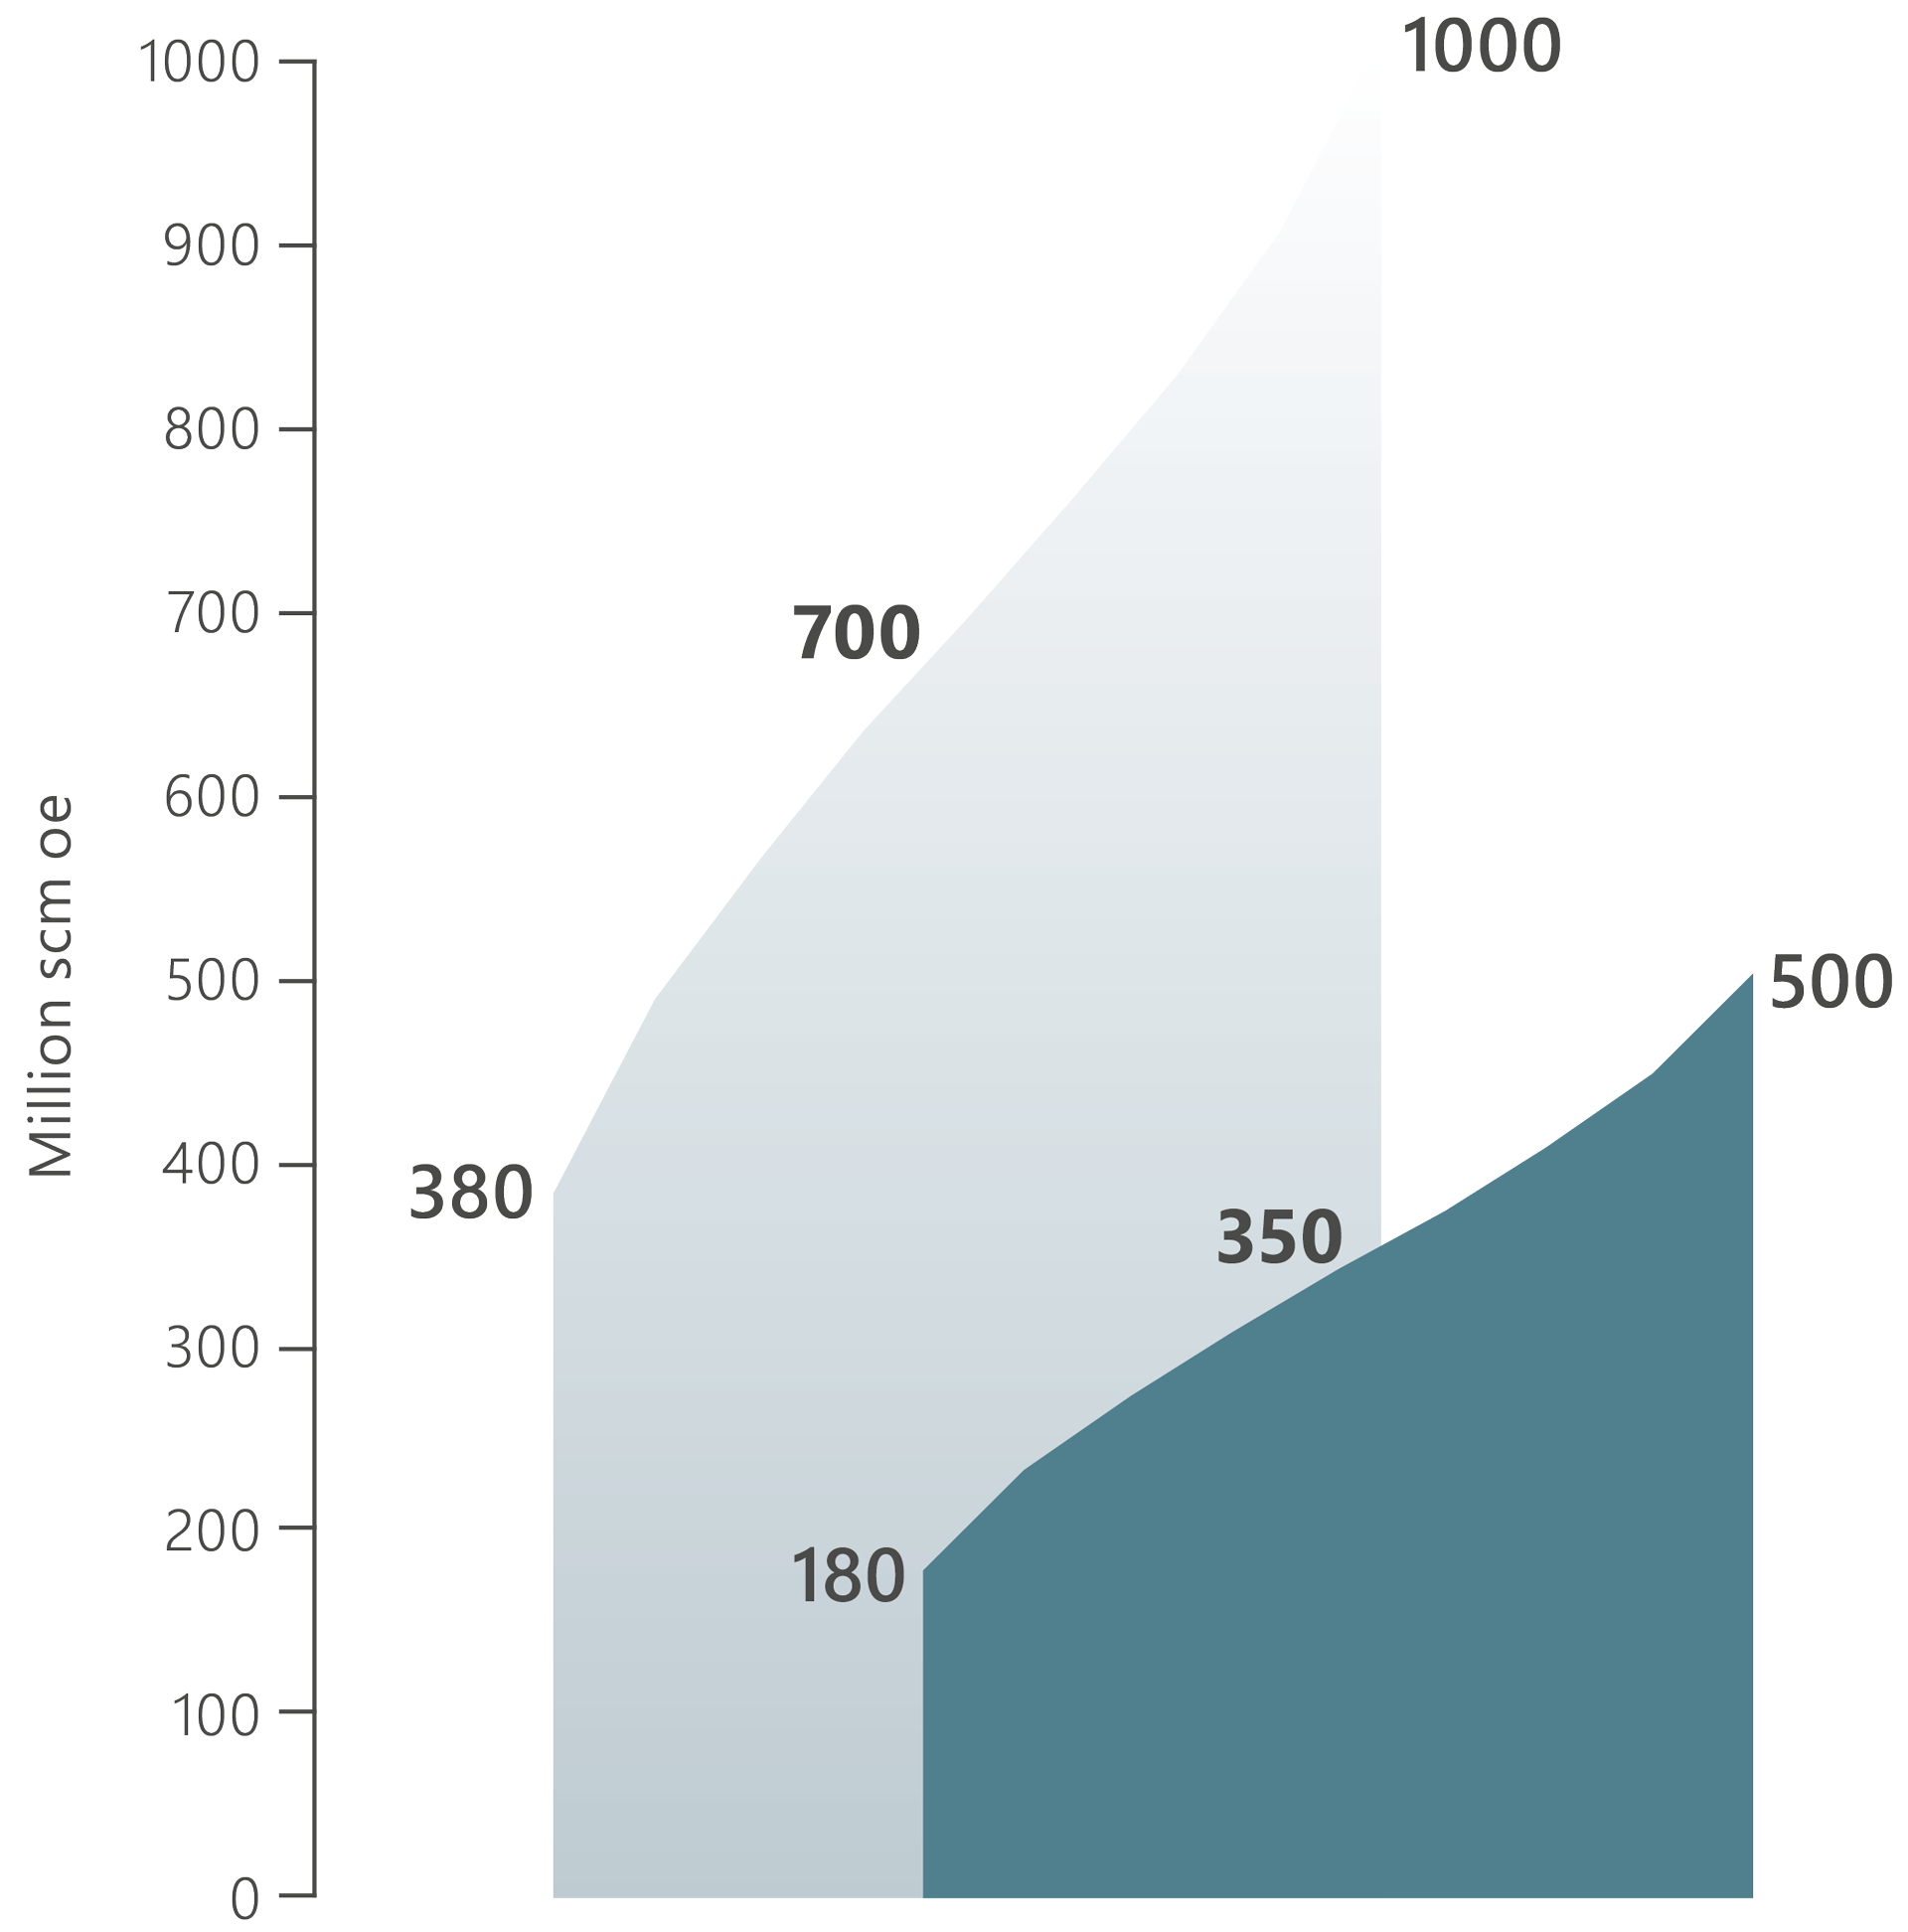
Figure 3.8 Technical and scaled EOR potential with uncertainty ranges.
Calculating the scaled EOR potential
Methods ranked differently
The scaled potential in this analysis provides a different internal ranking of methods than the 2017 study. Generally speaking, gas-based methods such as water alternating gas (WAG) injection with miscible hydrocarbon emerge favourably from the scaling, particularly on fields where injection equipment is already installed. Low-salinity and smart water also rank high because of their relatively low cost. The same applies to thermally activated polymers and gels injected directly into the well without major modifications on facilities.
Figure 3.9 presents the scaled potential for each method summed for all discoveries and fields in the study. Several EOR solutions have a substantial potential even after scaling. That contrasts with the improved recovery measures reported by the companies, where advanced methods have a modest total recoverable volume of two million scm.
Advanced methods could contribute to recovering substantial volumes if they are qualified. The NPD therefore wants to see an increased commitment to identifying measures which could improve recovery from oil fields on the NCS.
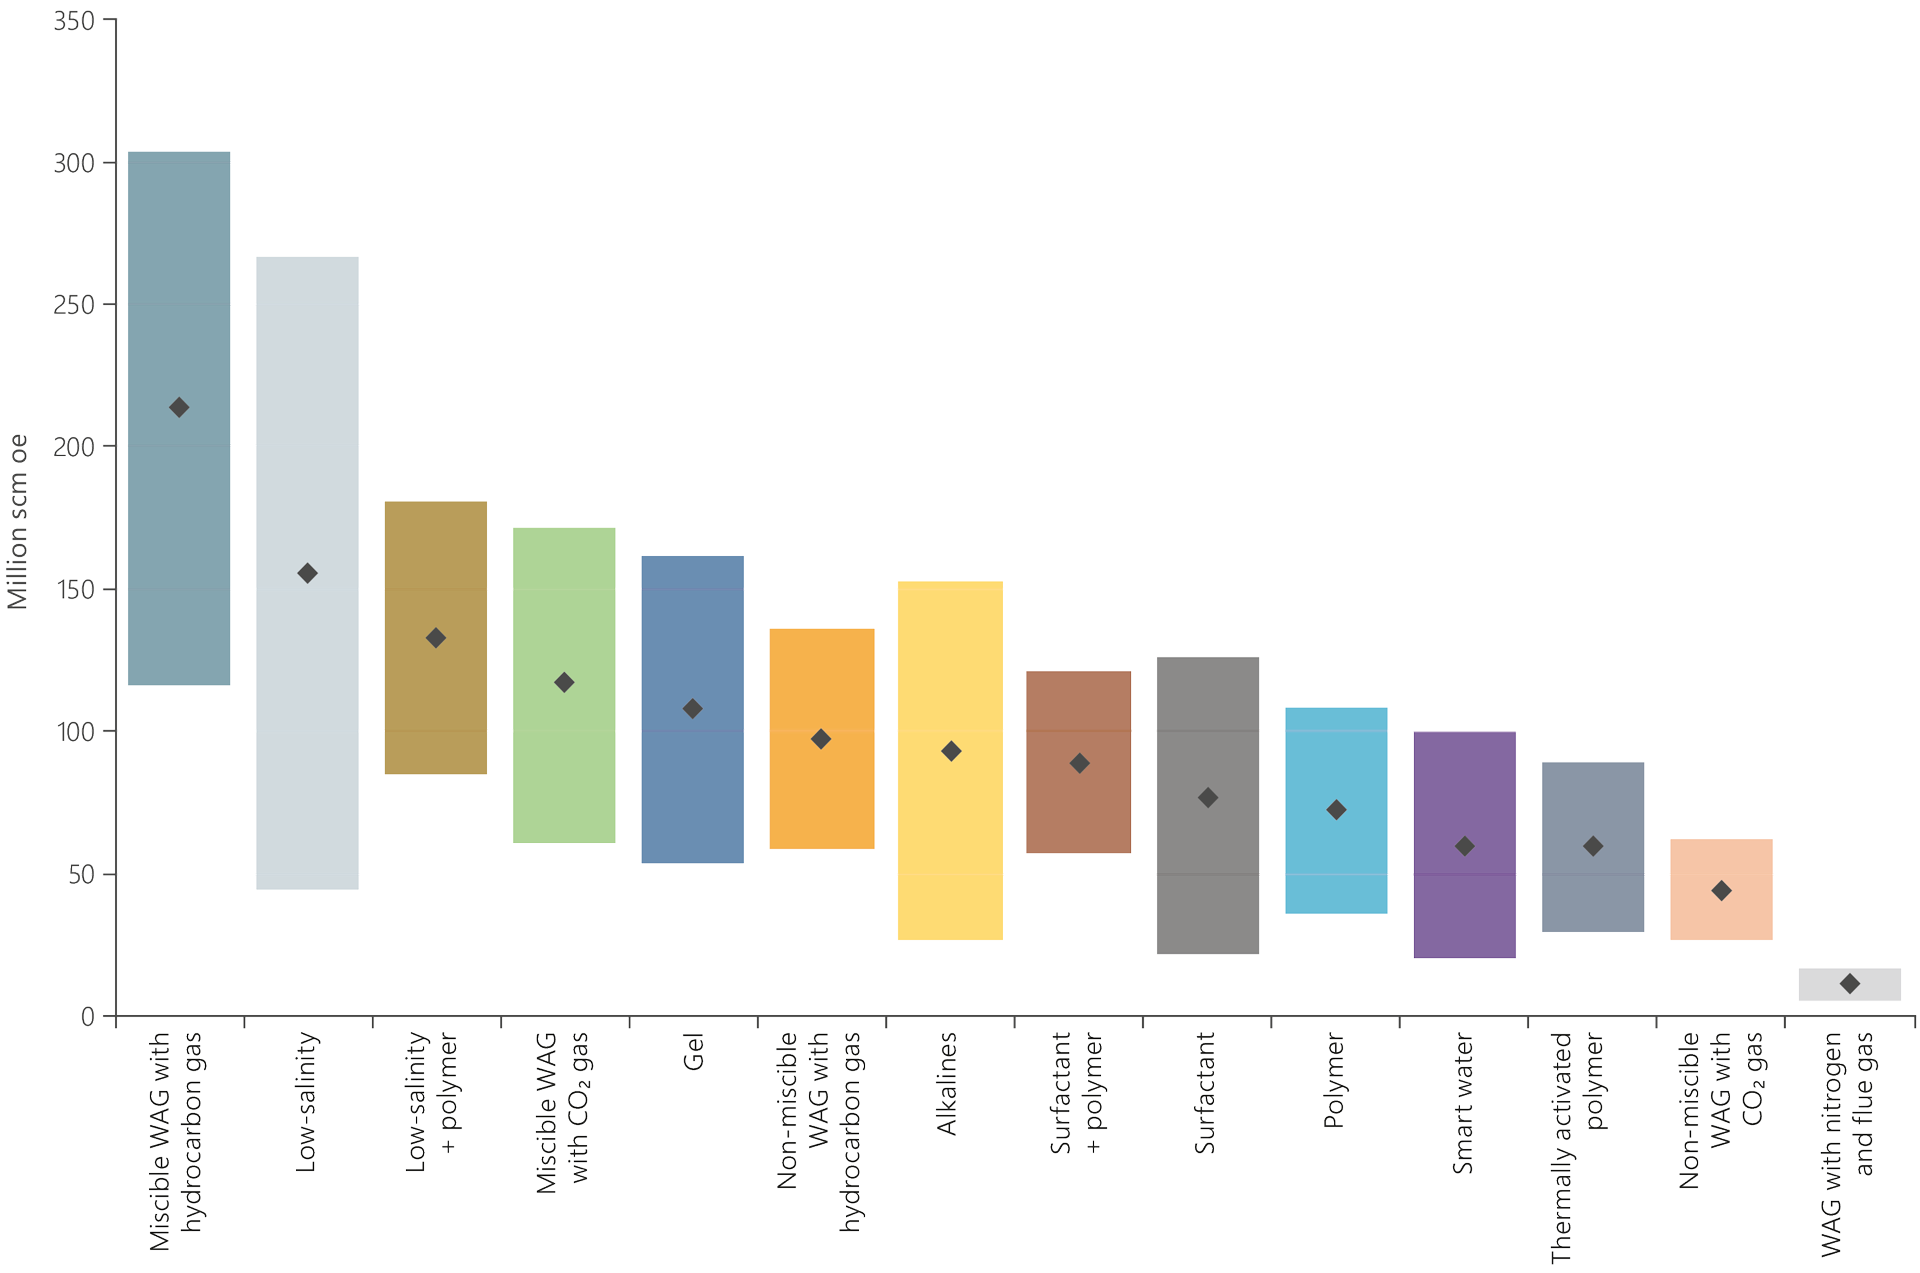
Figure 3.9 Scaled EOR potential per method with uncertainty range.
Field pilots
The analysis reveals a substantial potential for EOR. Despite this, the companies are hesitant to adopt these methods on the fields. One reason could be that they are challenging to model. The uncertainty range for recoverable volumes thereby becomes so great that getting projects approved in the companies has proved difficult.
It is important that licensees test EOR methods through field pilots in order to reduce the uncertainty range and verify applicability. Many chemicals used for EOR, for example, are not qualified for use on the NCS, despite showing good results in the lab and fields on land around the world. The need for field pilots is also supported by research teams which have demonstrated the potential of the EOR methods over many years.
One example of a field pilot is polymer injection in Johan Sverdrup. A condition set by the government when approving the PDO was that a two-well polymer pilot should be conducted after production began. The purpose is to confirm a possible improved recovery potential and to gain experience in using polymers. Valuable information will also be obtained on opportunities for utilising such injection on other NCS fields.

Figure 3.10 The Johan Sverdrup field. Illustration: Equinor.
Research and development in the petroleum industry
Substantial sums are spent annually on R&D for exploration, development, production and technologies to reduce emissions/discharges. Such investment by the oil companies totalled some NOK 3.7 billion in 2018. Of this, roughly NOK 2.8 billion was charged to Norwegian production licences. Spending was split between research internally by the companies and at external players. About NOK 1.6 billion went to external Norwegian R&D teams (such as the supplies industry, research institutes or the higher education sector). A large proportion of the investment is tax deductible by the companies. The government thereby contributes large sums indirectly.
The SkatteFunn scheme allows small and medium-sized enterprises to deduct 20 per cent of their R&D project costs from income tax. Large enterprises can deduct 18 per cent. The SkatteFunn portfolio in the petroleum sector covered 713 active projects in 2018, with an estimated tax saving of NOK 435 million.
Direct grants are also made to R&D programmes through the Research Council of Norway’s Petromaks 2, Demo2000 and Petrosenter programmes. These are directed primarily at universities, research institutes and the supplies industry. Their 2019 budgets total about NOK 380 million. Figure 3.12 shows how the programmes, with their respective budgets, are directed at different types of research.
The government thereby contributes both directly and indirectly (through tax reliefs) to financing the sector’s commitment to research and technology development. It therefore expects the amounts invested to result in the development and adoption of new solutions which increase value creation and reduce emissions/discharges from the industry. Sharing knowledge and technology across companies and production licences is also important.
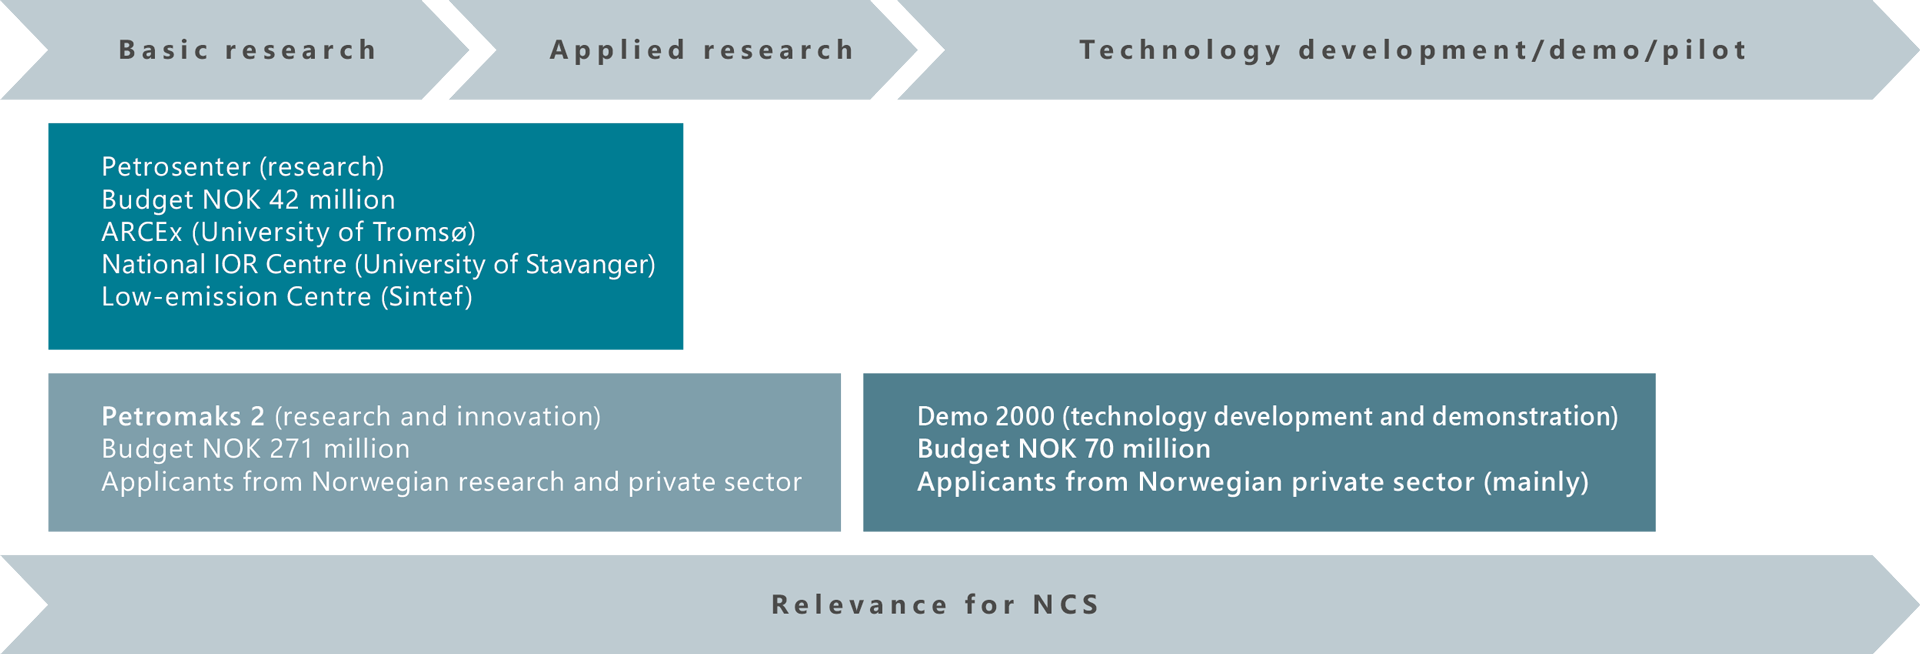
Figure 3.12 Research Council of Norway R&D programmes for the petroleum sector with their respective budgets.