Resource accounts at 31 December 2018
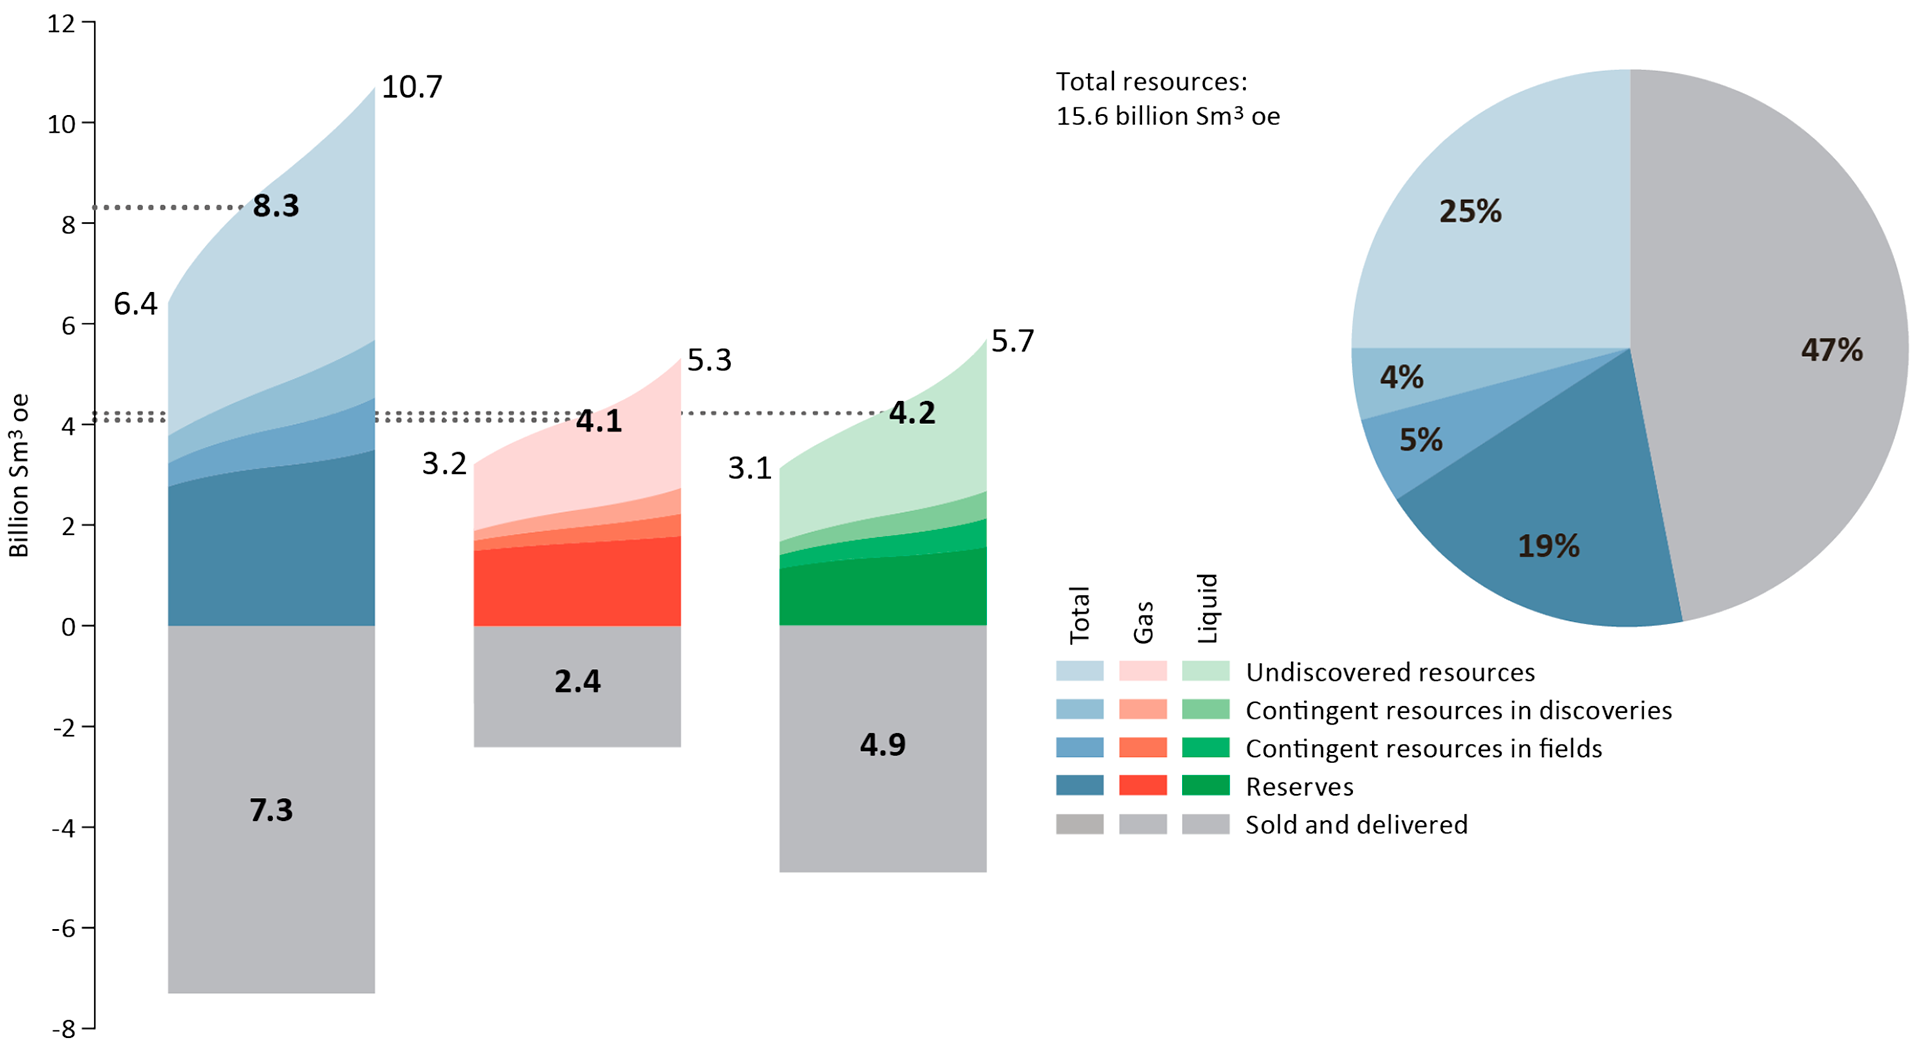
The Norwegian Petroleum Directorate’s estimate for total proven and unproven petroleum resources on the Norwegian Continental Shelf is about 15.6 billion standard cubic metres of oil equivalents.
This is 24 million more than at 31 December 2017. Of this volume, 47 per cent has been sold and delivered. Around 47 per cent of the remaining resources have not yet been proven.
The article also includes a summary of the NPD’s resource accounts pursuant to the UNFC classification.
Resources is a collective term for all oil and gas that can be recovered. The resources are classified according to their maturity, i.e. how far they have progressed in the planning process leading up to production. The main categories are reserves, contingent resources and unproven resources.
Oil and condensate are quoted in million standard cubic metres (Sm3 ). NGL is quoted in million tonnes, and gas is quoted in billion standard cubic metres. The conversion factor for NGL in tonnes to Sm3 is 1.9. Total oil equivalents are stated in million Sm3 o.e., 1000 Sm3 gas = 1 Sm3 o.e..
Total resources
The Norwegian Petroleum Directorate’s basic estimate for total proven and unproven petroleum resources is about 15.6 billion standard cubic metres of oil equivalents (Sm3 o.e.). Of this, 7.3 billion Sm3 o.e., or 47 per cent, have been sold and delivered. The estimate for resources that have not yet been proven is 3.9 billion Sm3 o.e. This has been reduced by the added growth of resources from new discoveries in 2018, approx. 60 million Sm3 o.e.
It is expected that 8.3 billion Sm3 o.e. remain to be produced. Of this, 4.4 billion Sm3 o.e. are proven resources.
Download: All tables that are part of the resource accounts for the Norwegian Shelf at 31 December 2018
Petroleum resources and uncertainty in estimates at 31 December 2018
Total petroleum resources on the Norwegian Continental shelf per 31 December 2018 |
|||||
| Oil mill. Sm3 |
Gas bill. Sm3 |
NGL mill. tonn |
Condensate mill. Sm3 |
Sum o.e. mill. Sm3 |
|
| Produced | 4347.9 | 2454.4 | 217.9 | 114.5 | 7330.8 |
| Reserves* | 1177.3 | 1621.6 | 92.3 | 21.9 | 2996.2 |
| Contingent resources in fields | 233.9 | 233.7 | 17.1 | 2.5 | 502.7 |
| Contingent resources in discoveries | 318.2 | 301.0 | 17.5 | 7.2 | 659.6 |
| Production not evaluated (RC 7A) | 135.0 | 70.0 | 205.0 | ||
| Undiscovered resources | 1980.0 | 1830.0 | 130.0 | 3940.0 | |
| Total | 8192.2 | 6510.8 | 344.8 | 276.2 | 15634.2 |
| * Includes resource classes 1, 2 and 3 | |||||
The Norwegian Continental Shelf - Changes from 2017 |
|||||
| Change Oil y-o-y mill. Sm3 |
Change Gas y-o-y bill. Sm3 |
Change NGL y-o-y mill. tonn |
Change Condensate y-o-y mill. Sm3 |
Change Sum y-o-y mill. Sm3 |
|
| Produced | 86.4 | 113.3 | 17.6 | -2.8 | 230.4 |
| Reserves* | 46.2 | -107.4 | -17.2 | 1.2 | -92,8 |
| Contingent resources in fields | -104.3 | -7.6 | -3.7 | 0.1 | -118.8 |
| Contingent resources in discoveries | 43.2 | 7.5 | 2.3 | 5.3 | 60.3 |
| Production not evaluated (RC 7A) | 5.0 | 0.0 | 0.0 | 0.0 | 5.0 |
| Undiscovered resources | -15.0 | -40.0 | 0.0 | -5.0 | -60.0 |
| Total | 61.5 | -34.1 | -1.1 | -1.2 | 24.2 |
| * Includes resource classes 1, 2 and 3 | |||||
Download: Table (excel)
Reserves
Reserves are recoverable petroleum volumes that have not yet been produced, but where a decision has been made that they will be produced. This applies both to resources where the authorities have approved a Plan for Development and Operation (PDO) and the resources that the licensees, the companies in the production licence, have resolved that they will produce, but have not yet secured the necessary approval from the authorities.
At year-end, reserves amounted to 2996 million Sm3 o.e. 54 per cent of this is gas. The gross reserves, or the estimate before production has been deducted, increased by 138 million Sm3 o.e. compared with the previous year. The reasons for this solid increase are reserve growth on several producing fields, submission of the PDO for Johan Sverdrup construction phase 2 and the Nova field. Production in 2018 amounted to 230 million Sm3 o.e. This entails a net reduction in reserves of 93 million Sm3 o.e., or about 3 per cent.
Contingent resources
Contingent resources are proven oil and gas which the licensees have not yet decided to produce. Petroleum volumes in potential improved recovery projects are included in this category. At year-end, contingent resources amounted to 1367 million Sm3 o.e. Resources that have been assessed as not being commercially recoverable are not included in the accounts.
Each year, decisions are made to develop some of the contingent resources, which are then moved to the reserves category. The growth in the contingent resources category comes both from new discoveries and from amended resource estimates and new opportunities in fields and discoveries.
Twenty-seven wildcat wells were completed in 2018, and 12 discoveries were made; three in the Barents Sea, three in the Norwegian Sea and six in the North Sea. The combined estimate for the discoveries we assume can/will be developed is 60 million Sm3 oil equivalents. Evaluation of many of these discoveries has not been completed; and the estimates are therefore very uncertain. As regards five of the discoveries in 2018, development is considered not very likely, and the resources in these discoveries are not included in the accounts.
Resources in discoveries have increased by 60 million Sm3 o.e., to 660 million Sm3 o.e. This increase can be attributed to resource growth from seven new discoveries in 2018. In addition, eight discoveries where development was previously deemed to be unlikely have now been considered for development. However, reduced resource estimates in discoveries and submission of the PDO for Nova resulted in the increase not being larger than 60 million Sm3 o.e.
Contingent resources in fields amount to 708 million Sm3 o.e., or 16 per cent of the remaining proven resources. In 2018, contingent resources in fields were reduced by 114 million Sm3 o.e. compared with the 2017 accounts. The reduction can mainly be explained by the fact that a decision has been made to develop construction phase two for the Johan Sverdrup field.
Unproven resources
Unproven resources include oil and gas that probably exists and can be produced, but have not yet been proven through drilling.
The resource estimate for the unproven resources was not updated in 2018. Such updates are conducted every other year. The next update will be in 2019. The unproven resources are estimated at 3940 million Sm3 o.e. This is a reduction of 60 million Sm3 o.e. compared with the resource accounts for 2017, and is approximately equal to the growth from new discoveries in 2018. Unproven resources account for about 47 per cent of the total remaining resources on the Norwegian Shelf.
UNFC CLASSIFICATION
The “United Nations Framework Classification System 2009” (UNFC-2009) is a classification system developed in part to allow comparison of resource estimates across different classification systems, and thus across countries and organisations.
Since 2014, the Norwegian Petroleum Directorate has also classified the Norwegian petroleum resources according to UNFC-2009.
The resources in each of the approximately 700 Norwegian projects included in the resource accounts are sorted according to three axes: E, F and G. These represent varying degrees of socio-economic attractiveness, technical maturity and uncertainty.
The Norwegian resource accounts at 31 December 2018 converted to UNFC can be summarised as shown in the resource account table under the “UNFC” banner.
An explanation of the methodology used to convert from the Norwegian system to UNFC 2009 can be found in this publication from 2014.
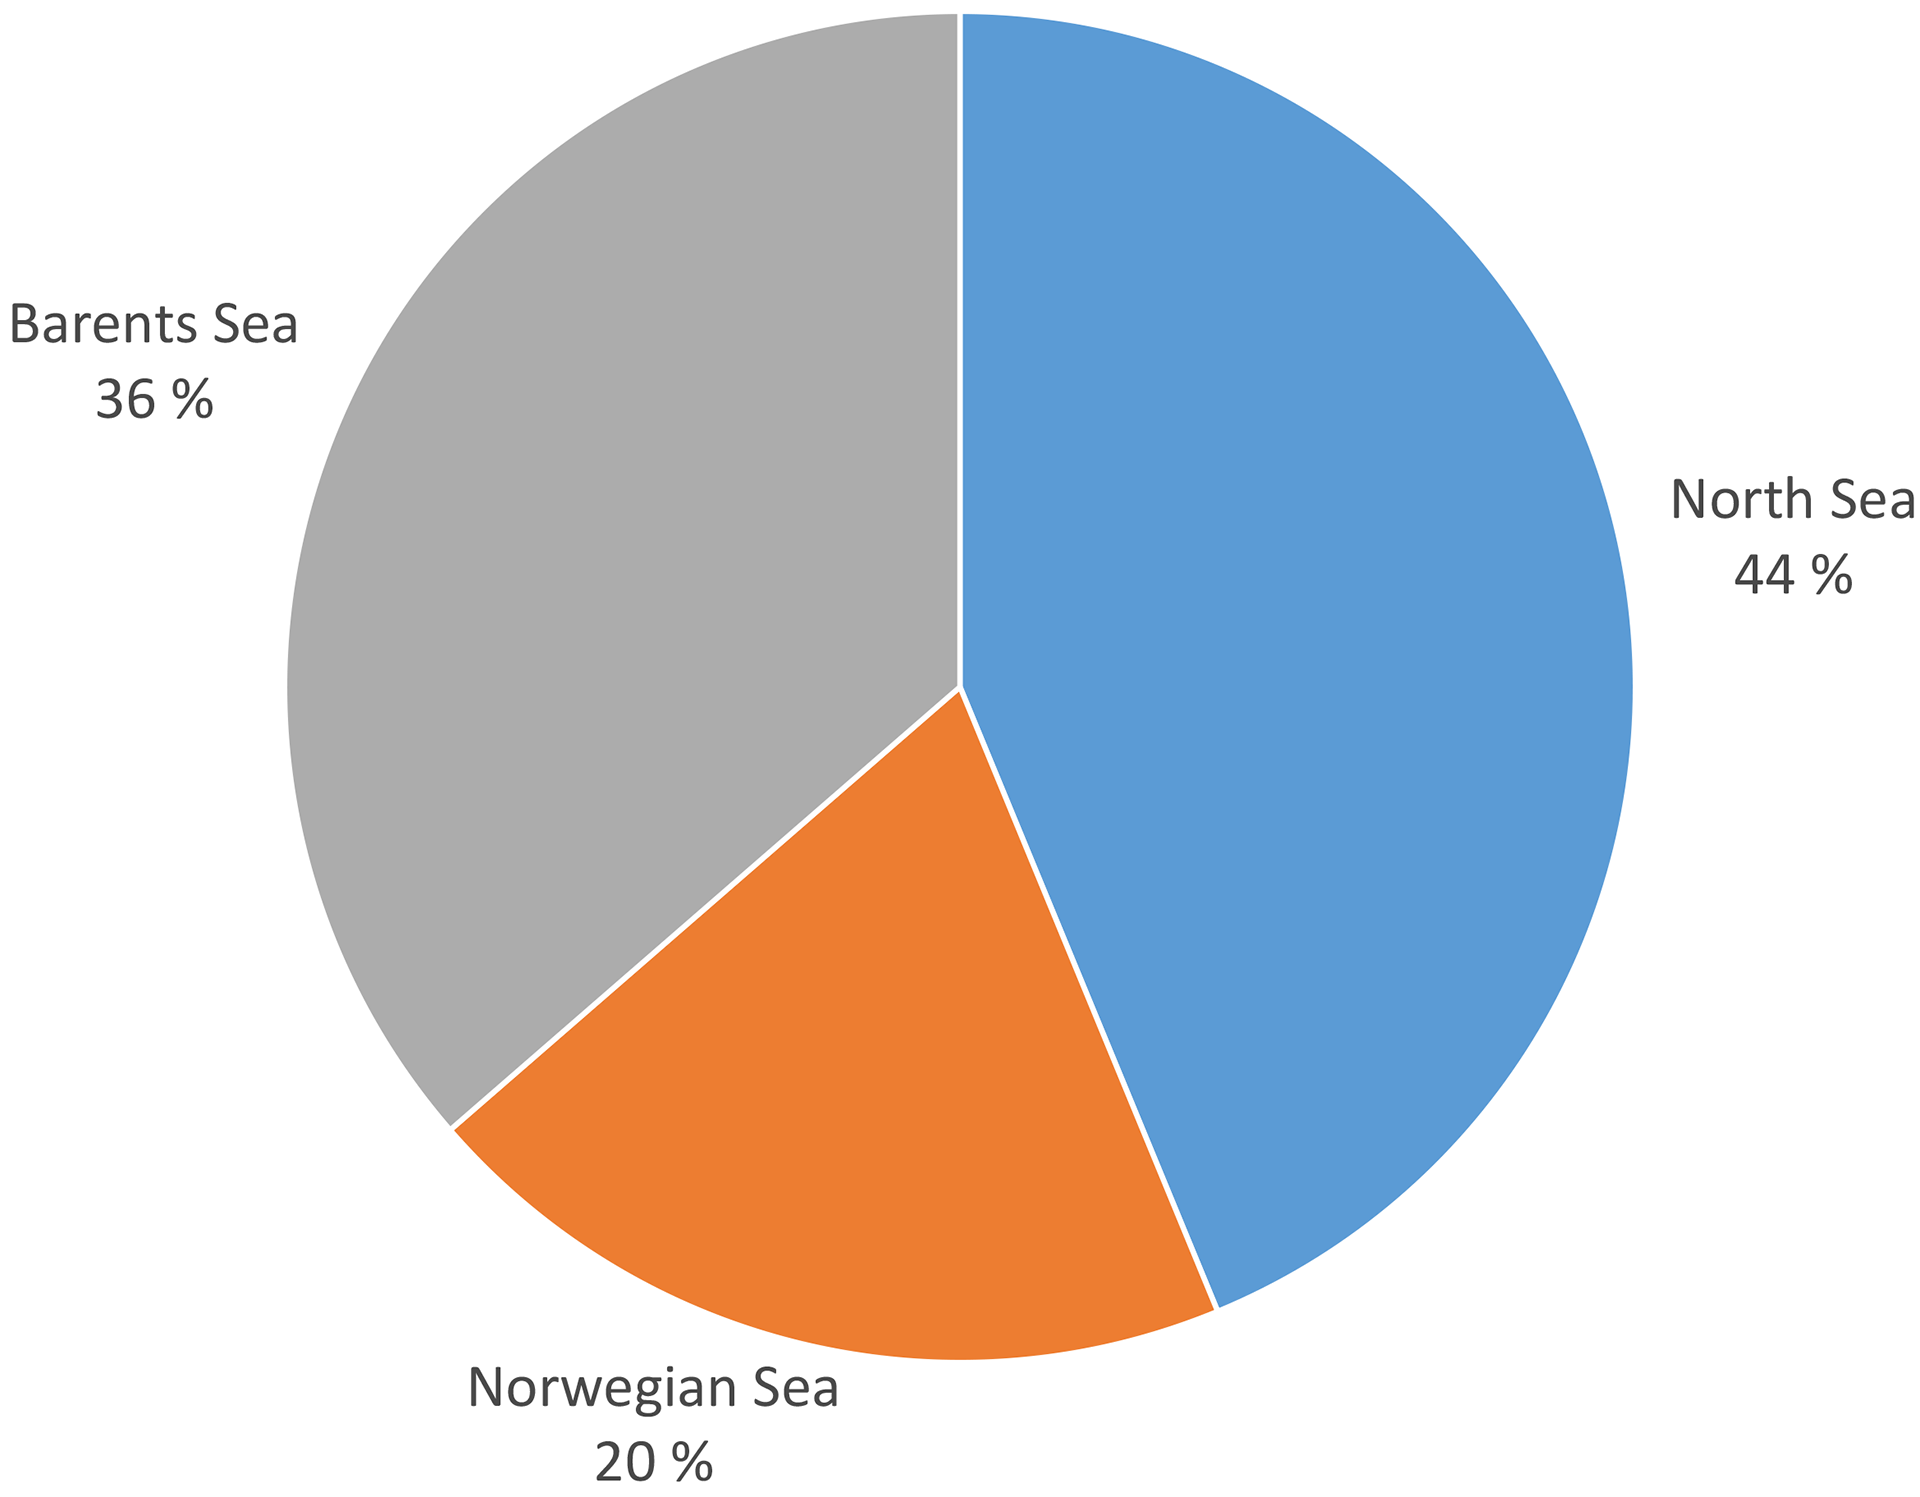
Resources per sea area
The North Sea contains about 44 per cent of the remaining resources. A distribution of the rest of the resources shows that 37 per cent remain in the Barents Sea and 19 per cent remain in the Norwegian Sea. A large percentage of the expected remaining resources in the Barents Sea have not yet been proven.
The North Sea is the engine in the Norwegian petroleum activities with 63 producing fields at year-end. Three fields, Brynhild, Gaupe and Oselvar, were shut down in 2018.
The Norwegian Sea has 18 producing fields. One new field, Aasta Hansteen, came on stream in December 2018. There are two producing fields in the Barents Sea.
Download: All tables that are part of the resource accounts for the Norwegian Shelf at 31 December 2018.
Remaining petroleum resources distributed by sea area at 31 December 2018
The North Sea
The resource accounts for the North Sea show that 161 million Sm3 o.e. were sold and delivered from this part of the Norwegian Shelf over the last year. Gross reserves increased by 175 million Sm3 o.e, before production is deducted. This means that the remaining reserves in the North Sea have increased by 14 million Sm3 o.e. in 2018.
The increase in gross reserves can be attributed to the submission of the PDO for Johan Sverdrup construction phase two and the Nova field. There was also an increase in the reserves in several fields, such as Gudrun, Fram and Edvard Grieg.
Contingent resources in fields were reduced by 125 million Sm3 o.e. in 2018, in part due to the submission of a PDO for development of Johan Sverdrup construction phase two, and because resources were matured to reserves. Contingent resources in discoveries have increased by 46 million Sm3 o.e. compared with last year’s accounts, due in part to growth from new discoveries as well as the fact that the 35/12-2 (Grosbeak) and 24/6-1 (Peik) discoveries are now being assessed for development. Six discoveries were made in the North Sea in 2018. Resource growth is approximately 12 million Sm3 o.e.
The estimate for unproven resources is 715 million Sm3 o.e., a reduction of 10 million Sm3 o.e. compared with last year’s accounts.
Total petroleum resources in the North Sea at 31 December 2018 |
|||||
| Oil mill. Sm3 |
Gas bill. Sm3 |
NGL mill. tonn |
Condensate mill. Sm3 |
Sum o.e. mill. Sm3 |
|
| Produced | 3727.9 | 1869.8 | 156.0 | 70.2 | 5964.3 |
| Reserves* | 948.1 | 1105.9 | 54.8 | 0.0 | 2158.1 |
| Contingent resources in fields | 197.1 | 148.7 | 12.3 | 0.0 | 369.1 |
| Contingent resources in discoveries | 172.5 | 131.6 | 8.8 | 0.0 | 320.9 |
| Undiscovered resources | 420.0 | 245.0 | 50.0 | 715.0 | |
| Total** | 5465.7 | 3501.0 | 231.9 | 120.2 | 9527.4 |
| * Includes resource classes 1, 2 and 3 ** Resources from RK 7A have not been broken down by area |
|||||
North Sea - Changes from 2017 |
|||||
| Change Oil y-o-y mill. Sm3 |
Change Gas y-o-y bill. Sm3 |
Change NGL y-o-y mill. tonn |
Change Condensate y-o-y mill. Sm3 |
Change Sum o.e. y-o-y mill. Sm3 |
|
| Produced | 70.6 | 69.0 | 13.8 | -4.5 | 163.3 |
| Reserves* | 77.5 | -46.2 | -11.6 | 4.4 | 13.7 |
| Contingent resources in fields | -109.6 | -11.8 | -2.1 | 0.0 | -125.5 |
| Contingent resources in discoveries | 35.9 | 12.4 | -1.3 | 0.0 | 45.9 |
| Undiscovered resources | -10.0 | 0.0 | 0.0 | 0.0 | -10.0 |
| Total** | 64.5 | 23.4 | -1.2 | -0.1 | 85.4 |
| * Includes resource classes 1, 2 and 3 ** Resources from RK 7A have not been broken down by area |
|||||
Download: Table (excel)
The Norwegian Sea
The resource accounts for the Norwegian Sea show that 57 million Sm3 o.e. were sold and delivered from this part of the Norwegian Shelf over the last year. At the same time, gross reserves were reduced by 21 million Sm3 o.e. before production is deducted. This entails a reduction in the remaining reserves in the Norwegian Sea amounting to 78 million Sm3 o.e. in 2018.
The reduction in gross reserves is mainly due to the fact that the reserves on the Maria field have been reduced to take account of lack of pressure support from water injection in the reservoir.
Contingent resources in fields were reduced by 10 million Sm3 o.e. in 2018. The reasons for this include the fact that resources have been matured to reserves, and that certain projects have been excluded since they are now assessed as not being commercial. The estimate for contingent resources in discoveries was increased by 21 million Sm3 o.e. compared with last year’s accounts. The most important reasons for this are the 6604/5-1 (Balderbrå) and 6506/11-10 (Hades/Iris) discoveries made in 2018.
Three new discoveries were made in the Norwegian Sea in 2018. Total resource growth is approximately 45 million Sm3 o.e. The estimate for unproven resources is 695 million Sm3 o.e., a reduction of 45 million Sm3 o.e. compared with 2017.
Total petroleum resources in the Norwegian Sea at 31 December 2018 |
|||||
| Oil mill. Sm3 |
Gas bill. Sm3 |
NGL mill. tonn |
Condensate mill. Sm3 |
Sum o.e. mill. Sm3 |
|
| Produced | 610.6 | 531.0 | 59.3 | 35.9 | 1290.2 |
| Reserves* | 118.0 | 360.2 | 31.9 | 5.7 | 544.6 |
| Contingent resources in fields | 31.7 | 58.4 | 3.8 | 1.9 | 99.1 |
| Contingent resources in discoveries | 27.8 | 148.0 | 7.6 | 6.2 | 196.4 |
| Undiscovered resources | 300.0 | 355.0 | 40.0 | 695.0 | |
| Total** | 1088.1 | 1452.6 | 102.6 | 89.7 | 2825.3 |
| * Includes resource classes 1, 2 and 3 ** Resources from RK 7A have not been broken down by area |
|||||
Norwegian Sea - Changes from 2017 |
|||||
| Change Oil y-o-y mill. Sm3 |
Change Gas y-o-y bill. Sm3 |
Change NGL y-o-y mill. tonn |
Change Condensate y-o-y mill. Sm3 |
Change Sum o.e. y-o-y mill. Sm3 |
|
| Produced | 11.9 | 37.7 | 3.6 | 0.9 | 57.3 |
| Reserves* | -27.7 | -39.7 | -4.9 | -1.1 | -77.8 |
| Contingent resources in fields | 3.0 | -9.6 | -1.6 | 0.0 | -9.5 |
| Contingent resources in discoveries | 1.1 | 8.5 | 3.2 | 5.4 | 21.0 |
| Undiscovered resources | 0.0 | -40.0 | 0.0 | -5.0 | -45.0 |
| Total** | -11.7 | -43.2 | 0.3 | 0.2 | -53.9 |
| * Includes resource classes 1, 2 and 3 ** Resources from RK 7A have not been broken down by area |
|||||
Download: Table (excel)
The Barents Sea
The resource accounts for the Barents Sea show that 12 million Sm3 o.e. were sold and produced from this part of the Norwegian Shelf over the last year. At the same time, gross reserves were reduced by 17 million Sm3 o.e before production is deducted. This yields a reduction in remaining reserves of 29 million Sm3 o.e. in 2018.
The reduction in gross reserves is due to the fact that the reserves in the Snøhvit field have been reduced due to updating of the geological models.
Contingent resources in fields have increased by 16 million Sm3 o.e. compared with 2017. The reason for this is that a PDO has been approved for the resources in Johan Castberg and the resources have been transferred from discovery to field. Estimated contingent resources in discoveries have been reduced by 7 million Sm3 o.e.
Three new discoveries were made in the Barents Sea in 2018. Resource growth amounts to approximately 3 million Sm3 o.e.
The unproven resources in the Barents Sea include volumes in the Barents Sea south, southeast and northeast. This year’s estimate for unproven resources is 2530 million Sm3 o.e., a reduction of 5 million Sm3 o.e compared with 2017.
Total petroleum resources in the Barents Sea at 31 December 2018 |
|||||
| Oil mill. Sm3 |
Gas bill. Sm3 |
NGL mill. tonn |
Condensate mill. Sm3 |
Sum o.e. mill. Sm3 |
|
| Produced | 9.3 | 53.6 | 2.6 | 8.4 | 76.3 |
| Reserves* | 111.1 | 155.5 | 5.6 | 16.2 | 293.5 |
| Contingent resources in fields | 5.1 | 26.6 | 1.1 | 0.6 | 34.5 |
| Contingent resources in discoveries | 117.9 | 21.4 | 1.1 | 1.0 | 142.3 |
| Undiscovered resources | 1260.0 | 1230.0 | 40.0 | 2530.0 | |
| Total** | 1503.4 | 1487.2 | 10.3 | 66.3 | 3076.5 |
| * Includes resource classes 1, 2 and 3 ** Resources from RK 7A have not been broken down by area |
|||||
Barents Sea - Changes from 2017 |
|||||
| Change Oil y-o-y mill. Sm3 |
Change Gas y-o-y bill. Sm3 |
Change NGL y-o-y mill. tonn |
Change Condensate y-o-y mill. Sm3 |
Change Sum o.e. y-o-y mill. Sm3 |
|
| Produced | 3.8 | 6.7 | 0.3 | 0.8 | 11.8 |
| Reserves* | -3.7 | -21.5 | -0.7 | -2.1 | -28.7 |
| Contingent resources in fields | 2.4 | 13.8 | 0.0 | 0.0 | 16.2 |
| Contingent resources in discoveries | 6.0 | -13.3 | 0.3 | 0.0 | -6.6 |
| Undiscovered resources | -5.0 | 0.0 | 0.0 | 0.0 | -5.0 |
| Total** | 3.7 | -14.4 | -0.2 | -1.3 | -12.3 |
| * Includes resource classes 1, 2 and 3 ** Resources from RK 7A have not been broken down by area |
|||||
Download: Table (excel)
Updated: 10/07/2023