Resource Accounts as of 31 December 2020
The Norwegian Petroleum Directorate's estimate of total proven and unproven petroleum resources on the Norwegian continental shelf is about 15.8 billion standard cubic metres of oil equivalents.
The Resource Accounts are an overview of the Norwegian Petroleum Directorate’s (NPD’s) estimates of total proven and unproven petroleum resources on the Norwegian continental shelf.
Resources is a generic term for all oil and gas that can be recovered. The resources are classified according to their maturity; in other words, how far they have progressed in the planning phase leading up to production. The major classes are reserves, contingent resources and unproven resources.
Oil and condensate are reported in million standard cubic metres (Sm3). NGL is reported in million tonnes, and gas is reported in billion standard cubic metres. The conversion factor for NGL in tonnes to Sm3 is 1.9. 1,000 Sm3 gas = 1 Sm3 o.e. Total oil equivalent volume is stated in million Sm3 o.e.
The article also includes a summary of the NPD’s resource accounts according to the UNFC classification.
Total resources
The basic estimate in the Resource Accounts shows that the total proven and unproven petroleum resources on the Norwegian continental shelf amount to approx. 15.8 billion standard cubic metres of oil equivalent (Sm3 o.e.). This is 28 million more than as of 31 December 2019. 49 per cent of the resources, or 7.8 billion Sm3 o.e., have been sold and delivered.
The NPD estimates 8 billion Sm3 o.e. remaining resources. Estimates are uncertain and vary between 5.9 and 10.8 billion Sm3 o.e. 4.2 billion Sm3 o.e.
Of the estimate of 8 billion Sm3, 4.2 billion Sm3 o.e, or 52 per cent, are proven resources.
The estimate for resources that are not proven is 3.8 billion Sm3 o.e. About 60 percent of these are in areas that are open for petroleum activities. The estimate has been reduced by 75 million Sm3 o.e. due to the fact that equivalent volumes were proven through exploration in 2020.
Petroleum resources and uncertainty in the estimates as of 31 December 2020

|
Total petroleum resources on the Norwegian continental shelf as of 31 December 2020 |
|||||
|---|---|---|---|---|---|
|
|
Oil |
Gas |
NGL |
Condensate |
Total o.e. |
|
Sold and delivered |
4,529.0 |
2,681.8 |
236.0 |
116.8 |
7,776.1 |
|
Reserves |
1,124.9 |
1,440.3 |
75.5 |
18.3 |
2,727.0 |
|
Contingent resources in fields |
346.2 |
342.1 |
16.9 |
2.6 |
722.9 |
|
Contingent resources in discoveries |
348.5 |
313.1 |
21.9 |
2.4 |
705.5 |
|
Undiscovered resources |
1,940.0 |
1,775.0 |
0.0 |
120.0 |
3,835.0 |
|
Total |
8,288.6 |
6,552.1 |
350.3 |
260.1 |
15,766.4 |
|
Norwegian continental shelf – changes from 2019 |
|||||
|---|---|---|---|---|---|
|
|
Change |
Change |
Change |
Change |
Change |
|
Sold and delivered |
98.2 |
110.3 |
8.3 |
1.7 |
226.0 |
|
Reserves |
-44.1 |
-104.2 |
-11.6 |
-2.4 |
-172.8 |
|
Contingent resources in fields |
11.0 |
32.1 |
1.6 |
0.2 |
46.4 |
|
Contingent resources in discoveries |
-4.3 |
2.9 |
5.1 |
-5.0 |
3.3 |
|
Undiscovered resources |
-45.0 |
-30.0 |
0.0 |
0.0 |
-75.0 |
|
Total |
15.8 |
11.2 |
3.4 |
-5.5 |
27.9 |
Download: Table (Excel)
Reserves
Reserves are recoverable petroleum volumes that are not produced, but where a decision to produce has been made. This includes both resources where the authorities have approved plans for development and operation (PDOs) and the resources which the licensees, the companies in the production licence, have decided to produce, but have not yet secured the necessary permits from the authorities.
At year-end, the reserves amounted to 2,727 million Sm3 o.e. 53 per cent of this is gas. The gross reserves, or the estimate before production is deducted, has seen an increase of 53 million Sm3 o.e. compared with the previous year.
Production in 2020 amounted to 229 million Sm3 o.e. The change in the accounts is 226 million Sm3 o.e. This is a technical accounting change which entails a net reduction in reserves of 173 million Sm3 o.e., or about 6 per cent.
Contingent resources
Contingent resources are proven oil and gas for which no production decision has been made. Petroleum volumes in potential projects to improve recovery on fields in operation are included in this resource class. The growth in the contingent resources category comes both from new discoveries and from changed resource estimates and new opportunities in fields and discoveries. Each year, decisions are made to develop some of the contingent resources. At that point, they are transferred to the reserves category.
At year-end, the contingent resources amounted to 1,428 million Sm3 o.e. This corresponds to 34 per cent of the remaining proven resources. Resources that are assessed as not commercially producible, are not included in the accounts.
A total of 34 wildcat wells were completed in 2020, and 15 discoveries were made; seven in the Norwegian Sea, eight in the North Sea. The total estimate for the discoveries we presume can/will be developed is 76 million Sm3 o.e. Evaluations are not complete for several of the discoveries, and the estimates are therefore very uncertain. One of the discoveries in 2020 is assessed as unlikely for development, and the resources in that discovery are not included in the accounts.
Resources in discoveries have increased by 3 million Sm3 o.e., to 705 million Sm3 o.e., and account for 17 per cent of the remaining proven resources. The change is small, and is due to a combination of several factors. Growth from new discoveries in 2020 has been good, while at the same time, 14 of the discoveries in last year’s accounts are now considered to have a low probability of development and have thus been removed from this year’s accounts. Other changes come from submitted development plans and adjusted estimates for several discoveries.
Contingent resources in fields account for 723 million Sm3 o.e., or 17 per cent of the remaining proven resources. Of the contingent resources, 265 million Sm3 o.e. are potential measures in fields (RK 7A); these are not included in the tables covering the respective ocean areas. In 2020, the contingent resources in fields increased by 46 million Sm3 o.e. compared with the 2019 accounts. This increase can be explained by the fact that multiple fields have identified potential measures to improve recovery on the field, for example by drilling more wells or extending facility lifetime and thereby extending the production period.
Unproven resources
Unproven resources include oil and gas that probably exists and can be produced, but which has not yet been proven through drilling. The resource estimate for the unproven resources was updated in 2019. Such an update is undertaken every other year, and the next update will be in 2021.
The unproven resources are adjusted to reflect the annual exploration results. The estimate in this year’s resource accounts is 3,835 million Sm3 o.e., which is a reduction of 75 million Sm3 o.e. compared with last year’s accounts. Unproven resources account for about 48 per cent of the total remaining resources on the Norwegian shelf.
About 60 per cent of unproven resources are located in areas that are open for petroleum activities.
Estimates of unproven resources are very uncertain.
UNFC classification
The United Nations Framework Classification System (UNFC) is a classification system set up in part to allow for comparing resource estimates across various classification systems, and thus also across countries and organisations.
The NPD has also classified the Norwegian petroleum resources according to UNFC since 2014.
The resources in each of the approximate 700 projects included in the Resource Accounts are sorted along three axes; E, F and G. These axes represent varying degrees of environmental/ socioeconomic attractiveness, technical maturity and uncertainty.
The Norwegian Resource Accounts as of 31 December 2020, converted to UNFC, can be summarised as shown in the Resource Accounts table under the “UNFC” tab.
An explanation of the methodology used to convert from the Norwegian system to UNFC can be found in this publication from 2014.
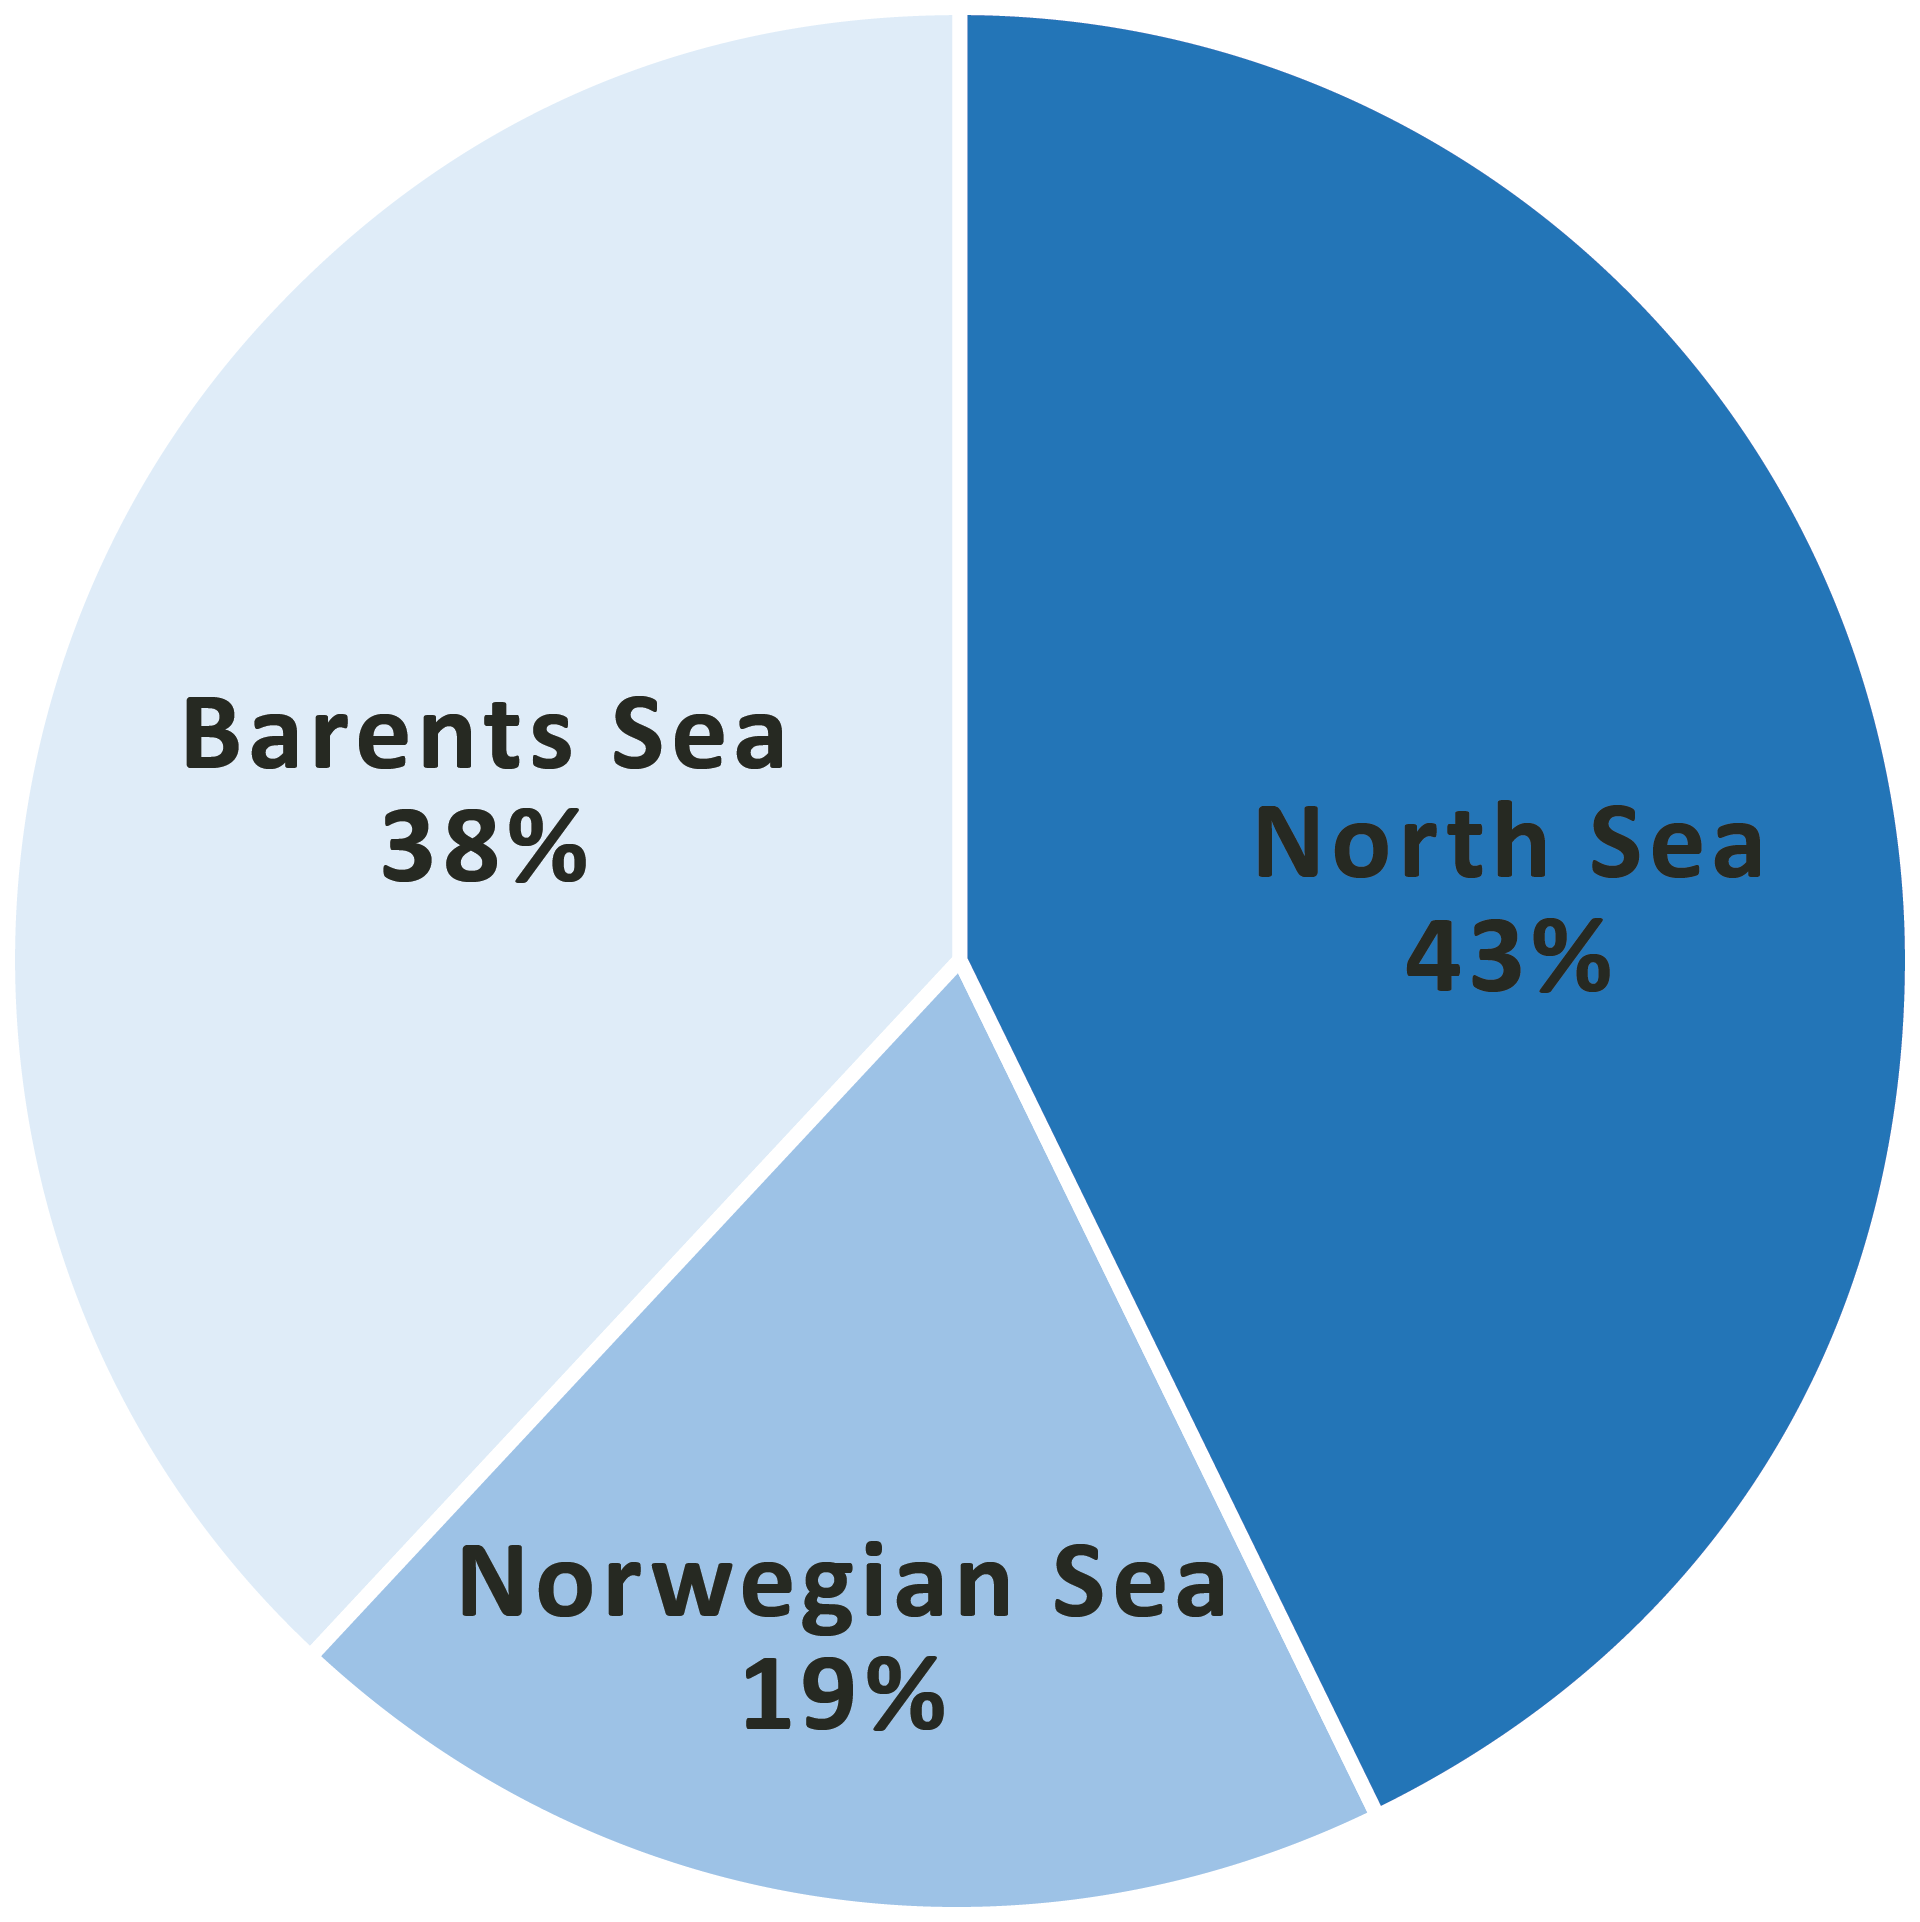
Resources per ocean area
The North Sea is home to about 43 per cent of the remaining resources. The distribution of the remainder shows that 38 per cent remain in the Barents Sea and 19 per cent remain in the Norwegian Sea. Large parts of the remaining expected resources in the Barents Sea are not proven.
At year-end there were 67 producing fields in the North Sea. One new field came on stream in 2020, Skogul, and production also started from the redeveloped Tor field. The Gyda field shut down production in 2020 after nearly 30 years, 10 years longer than estimated in the development plan.
There are 20 producing fields in the Norwegian Sea. One new field started production; Dvalin. The Ærfugl field had its official start-up in November 2020 (for technical accounting purposes, the resources in Ærfugl were entered under the Skarv field). There are two producing fields in the Barents Sea.
Remaining petroleum resources distributed by ocean area as of 31 December 2020
North Sea
The Resource Accounts for the North Sea show that 166 million Sm3 o.e. has been sold and delivered from this part of the Norwegian shelf in 2020. Gross reserves have increased by 71 million Sm3 o.e., before production is deducted. The remaining reserves in the North Sea were reduced by 96 million Sm3 o.e. in 2020. At year-end, the reserves amounted to 2,023 million Sm3 o.e.
The largest contribution to the increase in gross reserves comes from Breidablikk, which submitted a PDO in 2020, i.e. a plan for developing the 25/11-27 (F structure) and 25/8-4 (D structure) discoveries. In addition, the reserves on Hod have increased as a consequence of the submission of a PDO for a redevelopment of the field. Reserves have also increased on a number of other fields such as Edvard Grieg, Sleipner Vest and Statfjord, while there was a reduction on Valhall.
The contingent resources in fields were reduced by 18 million Sm3 o.e. in 2020. The reduction is mainly due to the submission of a PDO in connection with redevelopment of Hod.
Contingent resources in discoveries are reduced by 13 million Sm3 o.e. compared with last year’s accounts. The reduction is due to submission of a PDO for Breidablikk, but the growth from new discoveries means that the reduction is limited. Eight discoveries were made in the North Sea in 2020. The resource growth from seven of the discoveries is approx. 22 million Sm3 o.e.
The estimate for unproven resources is 665 million Sm3 o.e. This is a reduction of 20 million Sm3 o.e. compared with last year’s accounts.
|
Total petroleum resources in the North Sea |
|||||
|---|---|---|---|---|---|
|
|
Oil |
Gas |
NGL |
Condensate |
Total o.e. |
|
Sold and delivered |
3,882.0 |
2,009.9 |
167.4 |
70.4 |
6,280.3 |
|
Reserves |
917.7 |
1,015.7 |
46.9 |
0.0 |
2,022.6 |
|
Contingent resources in fields |
150.5 |
127.4 |
10.9 |
0.0 |
298.8 |
|
Contingent resources in discoveries |
178.3 |
139.8 |
10.8 |
0.0 |
338.7 |
|
Undiscovered resources |
375.0 |
240.0 |
0.0 |
50.0 |
665.0 |
|
Total |
5,503.6 |
3,532.8 |
236.1 |
120.4 |
9,605.4 |
|
North Sea – changes from 2019 |
|||||
|
|
Change |
Change |
Change |
Change |
Change |
|
Sold and delivered |
85.3 |
70.3 |
5.4 |
0.2 |
166.1 |
|
Reserves |
-26.0 |
-55.6 |
-7.3 |
0.0 |
-95.5 |
|
Contingent resources in fields |
-12.5 |
-7.0 |
0.6 |
0.0 |
-18.3 |
|
Contingent resources in discoveries |
-26.7 |
8.1 |
3.1 |
0.0 |
-12.7 |
|
Undiscovered resources |
-15.0 |
-5.0 |
0.0 |
0.0 |
-20.0 |
|
Total |
5.2 |
10.8 |
1.8 |
0.2 |
19.6 |
Download: Table (Excel)
The Norwegian Sea
The Resource Accounts for the Norwegian Sea show that 54 million Sm3 o.e was sold and delivered from this sector of the Norwegian shelf over the last year. At the same time, there is a reduction in the gross reserves of 9 million Sm3 o.e before production is deducted. This yields a reduction in remaining reserves in the Norwegian Sea of 64 million Sm3 o.e in 2020. At year-end, the reserves amounted to 428 million Sm3 o.e.
The reduction in gross reserves is due to factors including that Aasta Hansteen and Trestakk have reduced reserves compared with last year’s accounts.
The contingent resources in fields increased by 27 million Sm3 o.e. in 2020. The reason for this is that several fields have identified multiple measures to improve recovery, including e.g. drilling more wells.
The estimate for contingent resources in discoveries has increased by 31 million Sm3 o.e. compared with last year. Seven discoveries were made in the Norwegian Sea in 2020, whereof the two largest discoveries made on the shelf were in this ocean area. Total resource growth from the new discoveries is 54 million Sm3 o.e.
The estimate for unproven resources is 665 million Sm3 o.e, which is a reduction of 55 million Sm3 o.e compared with last year’s accounts.
|
Total petroleum resources in the Norwegian Sea |
|||||
|---|---|---|---|---|---|
|
|
Oil |
Gas |
NGL |
Condensate |
Total o.e. |
|
Sold and delivered |
633.0 |
608.1 |
65.5 |
37.6 |
1,403.2 |
|
Reserves |
100.8 |
278.9 |
23.5 |
3.7 |
428.0 |
|
Contingent resources in fields |
39.9 |
67.9 |
5.2 |
1.8 |
119.5 |
|
Contingent resources in discoveries |
55.4 |
144.3 |
10.8 |
1.4 |
221.6 |
|
Undiscovered resources |
265.0 |
365.0 |
0.0 |
35.0 |
665.0 |
|
Total |
1,094.2 |
1,464.2 |
105.0 |
79.5 |
2,837.3 |
|
The Norwegian Sea – changes from 2019 |
|||||
|---|---|---|---|---|---|
|
|
Change |
Change |
Change |
Change |
Change |
|
Sold and delivered |
10.4 |
37.6 |
2.7 |
1.0 |
54.3 |
|
Reserves |
-15.4 |
-39.7 |
-3.9 |
-1.2 |
-63.7 |
|
Contingent resources in fields |
12.9 |
11.2 |
1.6 |
0.0 |
27.1 |
|
Contingent resources in discoveries |
26.0 |
3.9 |
3.0 |
-4.8 |
30.8 |
|
Undiscovered resources |
-30.0 |
-25.0 |
0.0 |
0.0 |
-55.0 |
|
Total |
3.9 |
-11.9 |
3.4 |
-4.9 |
-6.5 |
Download: Table (Excel)
The Barents Sea
The Resource Accounts for the Barents Sea show that 6 million Sm3 o.e. was sold and delivered from this sector of the Norwegian shelf over the past year. The gross reserves have been reduced by 8 million Sm3 o.e. before production is deducted. This yields a reduction in remaining reserves of 14 million Sm3 o.e. in 2020. At year-end, the reserves amounted to 276 million Sm3 o.e. The reduction in gross reserves is due to the fact that the reserves in the Snøhvit field have been reduced as a consequence of an update of the reservoir model.
The contingent resources in fields have increased by 3 million Sm3 o.e. and the contingent resources in discoveries are reduced by 15 million Sm3 o.e. compared with last year’s accounts. As regards discoveries, the reduction is due to the fact that several discoveries have reduced estimates for recoverable resources. In addition, the 7324/6-1 (Sputnik) discovery is considered to be unlikely to be developed, and it is therefore not included in the accounts. No discoveries were made in the Barents Sea in 2020.
The unproven resources in the Barents Sea include volumes in the Barents Sea South, Southeast and Northeast. The estimate for the unproven resources in 2020 is 2,505 million Sm3 o.e., which is unchanged compared with last year’s accounts.
|
Total petroleum resources in the Barents Sea |
|||||
|---|---|---|---|---|---|
|
|
Oil |
Gas |
NGL |
Condensate |
Total o.e. |
|
Sold and delivered |
14.0 |
63.8 |
3.1 |
8.9 |
92.6 |
|
Reserves |
106.4 |
145.7 |
5.1 |
14.6 |
276.4 |
|
Contingent resources in fields |
5.7 |
31.7 |
0.8 |
0.8 |
39.7 |
|
Contingent resources in discoveries |
114.8 |
28.9 |
0.2 |
1.0 |
145.1 |
|
Undiscovered resources |
1,300.0 |
1,170.0 |
0.0 |
35.0 |
2,505.0 |
|
Total |
1,540.9 |
1,440.1 |
9.2 |
60.2 |
3,058.8 |
|
The Barents Sea – changes from 2019 |
|||||
|---|---|---|---|---|---|
|
|
Change |
Change |
Change |
Change |
Change |
|
Sold and delivered |
2.4 |
2.4 |
0.2 |
0.5 |
5.6 |
|
Reserves |
-2.6 |
-9.0 |
-0.4 |
2 |
-13.6 |
|
Contingent resources in fields |
0.6 |
3.0 |
-0.6 |
0.2 |
2.7 |
|
Contingent resources in discoveries |
-3.6 |
-9.1 |
-1.0 |
-0.2 |
-14.9 |
|
Undiscovered resources |
0.0 |
0.0 |
0.0 |
0.0 |
0.0 |
|
Total |
-3.3 |
-12.7 |
-1.8 |
-0.8 |
-20.2 |
Download: Table (Excel)
Oil and condensate are reported in million standard cubic metres (Sm³). NGL is reported in million tonnes, and gas is reported in billion standard cubic metres. The conversion factor for NGL in tonnes to Sm³ is 1.9. Total oil equivalents are reported in million Sm³ o.e., 1,000 Sm3 Gas = 1 Sm³ o.e.
Updated: 10/07/2023